Robustness by intrinsically disordered C-termini and translational readthrough
- PMID: 30247639
- PMCID: PMC6365619
- DOI: 10.1093/nar/gky778
Robustness by intrinsically disordered C-termini and translational readthrough
Erratum in
-
Robustness by intrinsically disordered C-termini and translational readthrough.Nucleic Acids Res. 2019 Dec 16;47(22):11978-11980. doi: 10.1093/nar/gkz1106. Nucleic Acids Res. 2019. PMID: 31733061 Free PMC article. No abstract available.
Abstract
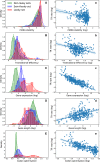
During protein synthesis genetic instructions are passed from DNA via mRNA to the ribosome to assemble a protein chain. Occasionally, stop codons in the mRNA are bypassed and translation continues into the untranslated region (3'-UTR). This process, called translational readthrough (TR), yields a protein chain that becomes longer than would be predicted from the DNA sequence alone. Protein sequences vary in propensity for translational errors, which may yield evolutionary constraints by limiting evolutionary paths. Here we investigated TR in Saccharomyces cerevisiae by analysing ribosome profiling data. We clustered proteins as either prone or non-prone to TR, and conducted comparative analyses. We find that a relatively high frequency (5%) of genes undergo TR, including ribosomal subunit proteins. Our main finding is that proteins undergoing TR are highly expressed and have intrinsically disordered C-termini. We suggest that highly expressed proteins may compensate for the deleterious effects of TR by having intrinsically disordered C-termini, which may provide conformational flexibility but without distorting native function. Moreover, we discuss whether minimizing deleterious effects of TR is also enabling exploration of the phenotypic landscape of protein isoforms.
Figures


Similar articles
-
Transcriptome-wide investigation of stop codon readthrough in Saccharomyces cerevisiae.PLoS Genet. 2021 Apr 20;17(4):e1009538. doi: 10.1371/journal.pgen.1009538. eCollection 2021 Apr. PLoS Genet. 2021. PMID: 33878104 Free PMC article.
-
A sequence required for -1 ribosomal frameshifting located four kilobases downstream of the frameshift site.J Mol Biol. 2001 Jul 27;310(5):987-99. doi: 10.1006/jmbi.2001.4801. J Mol Biol. 2001. PMID: 11502008
-
Stop codon context influences genome-wide stimulation of termination codon readthrough by aminoglycosides.Elife. 2020 Jan 23;9:e52611. doi: 10.7554/eLife.52611. Elife. 2020. PMID: 31971508 Free PMC article.
-
Ribosomal frameshifting, jumping and readthrough.Curr Opin Cell Biol. 1991 Dec;3(6):1051-5. doi: 10.1016/0955-0674(91)90128-l. Curr Opin Cell Biol. 1991. PMID: 1814364 Free PMC article. Review.
-
Translational readthrough potential of natural termination codons in eucaryotes--The impact of RNA sequence.RNA Biol. 2015;12(9):950-8. doi: 10.1080/15476286.2015.1068497. RNA Biol. 2015. PMID: 26176195 Free PMC article. Review.
Cited by
-
Transcriptome-wide investigation of stop codon readthrough in Saccharomyces cerevisiae.PLoS Genet. 2021 Apr 20;17(4):e1009538. doi: 10.1371/journal.pgen.1009538. eCollection 2021 Apr. PLoS Genet. 2021. PMID: 33878104 Free PMC article.
-
Stop-codon read-through arises largely from molecular errors and is generally nonadaptive.PLoS Genet. 2019 May 23;15(5):e1008141. doi: 10.1371/journal.pgen.1008141. eCollection 2019 May. PLoS Genet. 2019. PMID: 31120886 Free PMC article.
-
Modeling Length Changes in De Novo Open Reading Frames during Neutral Evolution.Genome Biol Evol. 2024 Jul 3;16(7):evae129. doi: 10.1093/gbe/evae129. Genome Biol Evol. 2024. PMID: 38879874 Free PMC article.
-
Translational recoding: canonical translation mechanisms reinterpreted.Nucleic Acids Res. 2020 Feb 20;48(3):1056-1067. doi: 10.1093/nar/gkz783. Nucleic Acids Res. 2020. PMID: 31511883 Free PMC article. Review.
-
Stochastic Gain and Loss of Novel Transcribed Open Reading Frames in the Human Lineage.Genome Biol Evol. 2020 Nov 3;12(11):2183-2195. doi: 10.1093/gbe/evaa194. Genome Biol Evol. 2020. PMID: 33210146 Free PMC article.
References
-
- Lynch M. The origins of genome architecture 2007. Science. 2007; 302:1401–1404. - PubMed
Publication types
MeSH terms
Substances
LinkOut - more resources
Full Text Sources
Other Literature Sources
Molecular Biology Databases

