. 2018 Nov 1;148(11):1860-1870.
doi: 10.1093/jn/nxy170.

Human Breast-Milk Feeding Enhances the Humoral and Cell-Mediated Immune Response in Neonatal Piglets

Affiliations

Human Breast-Milk Feeding Enhances the Humoral and Cell-Mediated Immune Response in Neonatal Piglets

John J Miklavcic et al. J Nutr. .

Abstract

Background: The benefits of breastfeeding infants are well characterized, including those on the immune system. However, determining the mechanism by which human breast milk (HBM) elicits effects on immune response requires investigation in an appropriate animal model.

Objective: The primary aim of this study was to develop a novel porcine model and to determine the differential effects of feeding HBM and a commercial milk formula (MF) on immune response and gastrointestinal microbial colonization in a controlled environment.

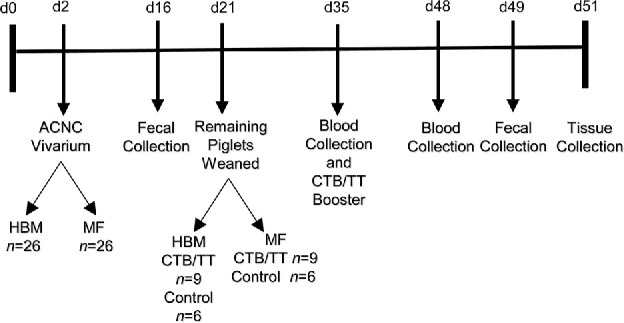
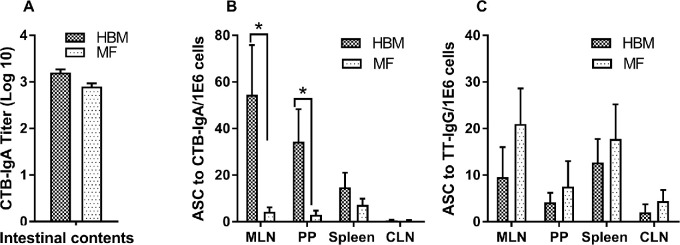
Methods: Male piglets were fed HBM (n = 26) or MF (n = 26) from day 2 through day 21. Piglets were vaccinated (n = 9/diet group) with cholera toxin and cholera toxin subunit B (CTB) and tetanus toxoid at 21 d or were fed placebo (n = 6/diet group) and then weaned to a standard solid diet at the age of 21 d. Humoral and cell-mediated immune responses were assessed from blood on days 35 and 48. Immune response was further examined from tissues, including mesenteric lymph nodes (MLNs), Peyer's patches (PPs), and spleen. The colonization of gut microbiota was characterized from feces on days 16 and 49.

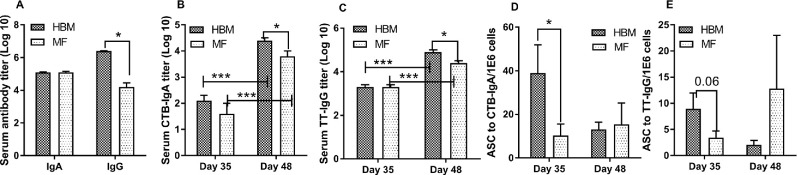
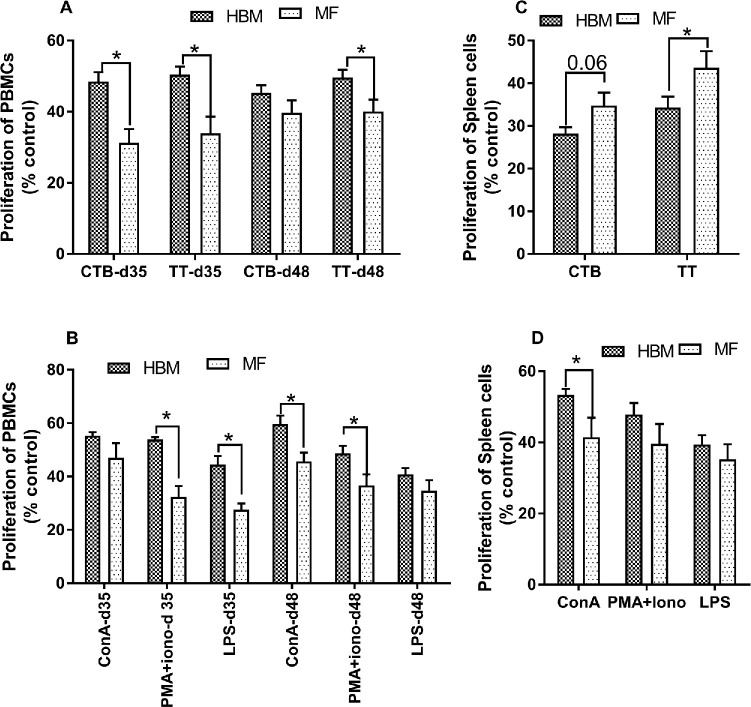
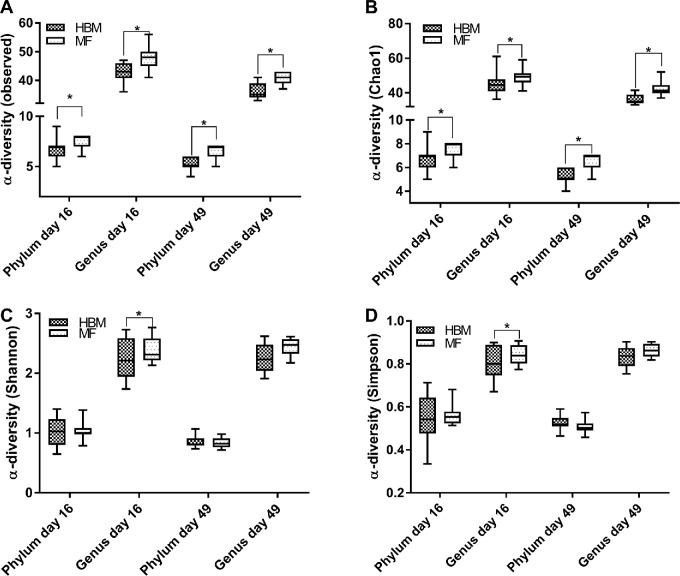
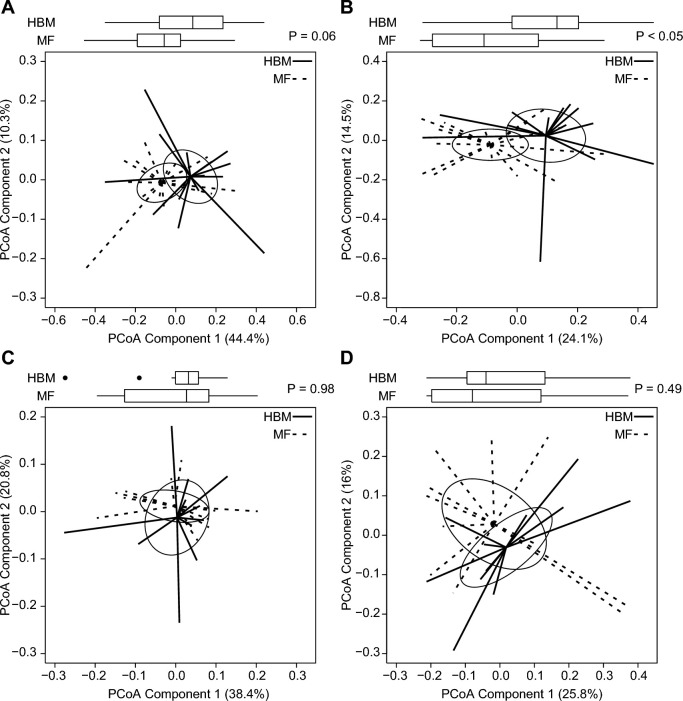
Results: Serum antibody titers in piglets fed HBM were 4-fold higher (P < 0.05) to CTB and 3-fold higher (P < 0.05) to tetanus toxoid compared with piglets fed MF on day 48. Compared with MF, the numbers of immunoglobulin A antibody-producing cells to CTB were 13-fold higher (P < 0.05) in MLNs and 11-fold higher (P < 0.05) in PPs in the HBM diet group on day 51. In addition, significantly increased T cell proliferation was observed in the HBM group relative to the MF group. Furthermore, microbial diversity in the HBM group was lower (P < 0.05) than in the MF group.

Conclusions: This porcine model appears to be valid for studying the effects of early postnatal diet on immune responses and the gastrointestinal microbiome. Our results lay the groundwork for future studies defining the role of infant diet on microbiota and immune function.


Figures

FIGURE 1
FIGURE 1
Two-day-old White Dutch Landrace Duroc male piglets were fed HBM (n = 26) or MF (n = 26) at the vivarium. Eleven piglets in each diet group were killed at 21 d, and tissues were obtained. The remaining piglets were weaned to an ad libitum diet at 21 d. In each diet group, piglets were immunized (n = 9) against CT+CTB and DTaP on day 21 and given a booster dose on day 35. Blood was drawn at 35 and 48 d. Tissues were obtained after killing at 51 d. ACNC, Arkansas Children's Nutrition Center; CT, cholera toxin; CTB, cholera toxin subunit B; d, day; DTaP, diphtheria, tetanus, and pertussis vaccine; HBM, human breast milk; MF, milk formula; TT, tetanus toxoid.
FIGURE 2
FIGURE 2
Total IgA and IgG serum titers (n = 15/diet group) for day 48 (A), CTB-specific serum IgA (n = 9/diet group) (B), TT-specific serum IgG (n = 9/diet group) (C), CTB-specific ASCs from PBMCs (n = 9/diet group) (D), and TT-specific ASCs from PBMCs on days 35 and 48 (n = 9/diet group) (E). Data were evaluated by using Mann-Whitney U test to compare diet groups and time points. *,***Different between bracketed means: *P < 0.05, ***P < 0.001. ASC, antibody-secreting cell; CTB, cholera toxin subunit B; HBM, human breast milk; MF, milk formula; PBMC, peripheral blood mononuclear cell; TT, tetanus toxoid.
FIGURE 3
FIGURE 3
IgA titers in the small intestine [duodenum (HBM: n = 2; MF: n = 2), jejunum (HBM: n = 6; MF: n = 6), and ileum (HBM: n = 6; MF: n = 6)] of immunized piglets fed HBM or MF on day 51 (A); CTB-specific ASCs from MLNs, PPs, spleen, and CLNs (n = 9/diet group) (B); and TT-specific ASCs from MLNs, PPs, spleen, and CLNs on day 51 (n = 9/diet group) (C). Values are means ± SEMs. Data were evaluated by Mann-Whitney U test. *Different between groups, P < 0.05. ASC, antibody-secreting cell; CLN, cervical lymph node; CTB, cholera toxin subunit B; HBM, human breast milk; MF, milk formula; MLN, mesenteric lymph node; PP, Peyer's patch; TT, tetanus toxoid.
FIGURE 4
FIGURE 4
Proliferative response elicited from PBMCs and spleen cells to CTB and TT in piglets (n = 15/diet group) fed HBM or MF (A), mitogen-specific proliferation from PBMCs on days 35 and 48 (B), CTB- and TT-specific proliferation from spleen cells on day 51 (C), and mitogen-specific proliferation of spleen cells on day 21 (D). Values are means ± SEMs. Data were evaluated by Mann-Whitney U test. *Different between groups, P < 0.05. ConA, concanavalin A; CTB, cholera toxin subunit B; HBM, human breast milk; MF, milk formula; PBMC, peripheral blood mononuclear cell; PMA+Iono, phorbol 12-myristate-13-acetate + ionomycin; TT, tetanus toxoid; % control, percentage difference in reduction of Alamar blue by antigen-treated compared with control untreated cells calculated in order to determine the level of proliferation.
FIGURE 5
FIGURE 5
α-Diversity boxplots for piglets at the phylum and genus levels for observed (A), Chao1 (B), Shannon (C), and Simpson (D) indexes at 16 d in HBM (n = 14) and MF (n = 15) diet groups and at 49 d in the HBM (n = 11) and MF (n = 12) diet groups. Upper and lower hinges (boxes) are minimum and maximum values within the IQR and the solid lines are median values. Data were analyzed by Mann-Whitney U test. *Different between groups, P < 0.05. HBM, human breast milk; MF, milk formula.
FIGURE 6
FIGURE 6
Box and spider plots represent Bray-Curtis estimates of β-diversity for piglets for phylum (A) and genus (B) in HBM (n = 14) and MF (n = 15) diet groups at 16 d and for phylum (C) and genus (D) in HBM (n = 11) and MF (n = 12) diet groups at 49 d. Box plot outliers are shown as black dots outside the whiskers. Solid and dashed lines extend from diet group medoids to the PCoA score for an individual piglet. Ellipses represent the SE of the point scores along the 2 components. P values represent group differences among PCoA scores along component 1 (Mann-Whitney U test). HBM, human breast milk; MF, milk formula; PCoA, principal coordinates analysis.

Similar articles

Cited by

References

    1. Beaudry M, Dufour R, Marcoux S. Relation between infant feeding and infections during the first six months of life. J Pediatr 1995;126(2):191–7. - PubMed
    1. Beaudry M, Dufour R, Marcoux S. [Breast feeding and protection against infection in industrialized countries.] Arch Pediatr 1996;3(Suppl 1):126s–7s (in French). - PubMed
    1. Hanson LA, Korotkova M. The role of breastfeeding in prevention of neonatal infection. Semin Neonatol 2002;7(4):275–81. - PubMed
    1. Hanson LA, Korotkova M, Telemo E. Breast-feeding, infant formulas, and the immune system. Ann Allergy Asthma Immunol 2003;90(6 Suppl 3):59–63. - PubMed
    1. Hanson LA, Hofvander Y, Lindquist B, Zetterstrom R. Breast-feeding as a protection against gastroenteritis and other infections. Acta Paediatr Scand 1985;74(5):641–2. - PubMed

Publication types