. 2018 Nov 30;46(21):11575-11591.
doi: 10.1093/nar/gky860.

Comprehensive analysis of the BC200 ribonucleoprotein reveals a reciprocal regulatory function with CSDE1/UNR

Affiliations

Comprehensive analysis of the BC200 ribonucleoprotein reveals a reciprocal regulatory function with CSDE1/UNR

Evan P Booy et al. Nucleic Acids Res. .

Abstract

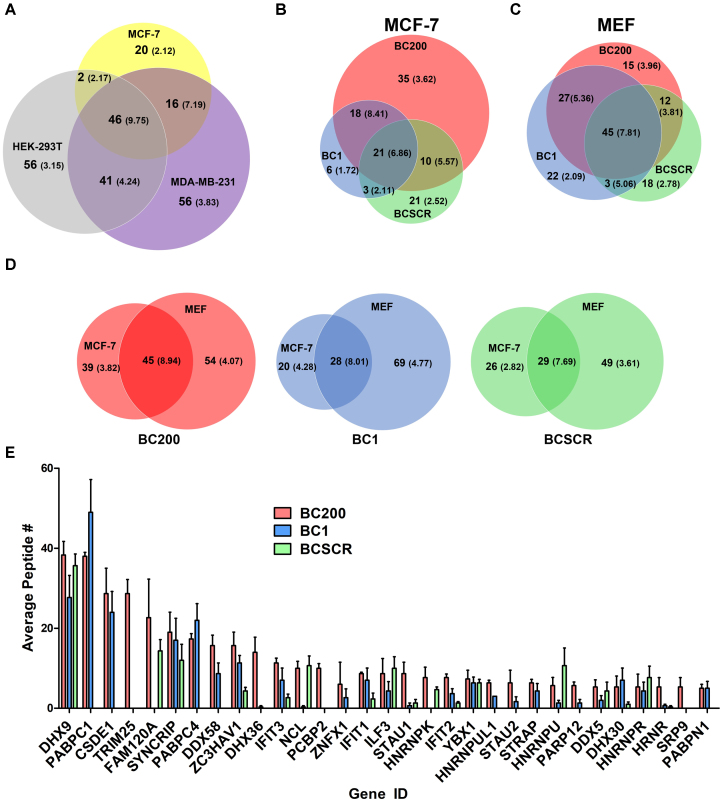
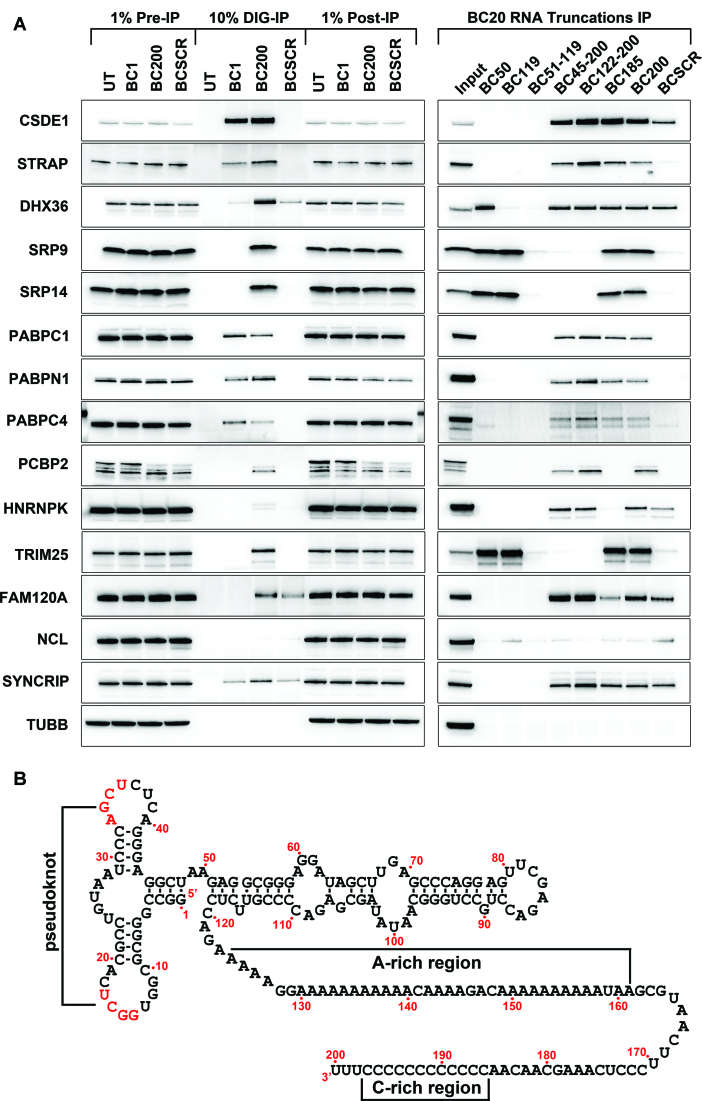
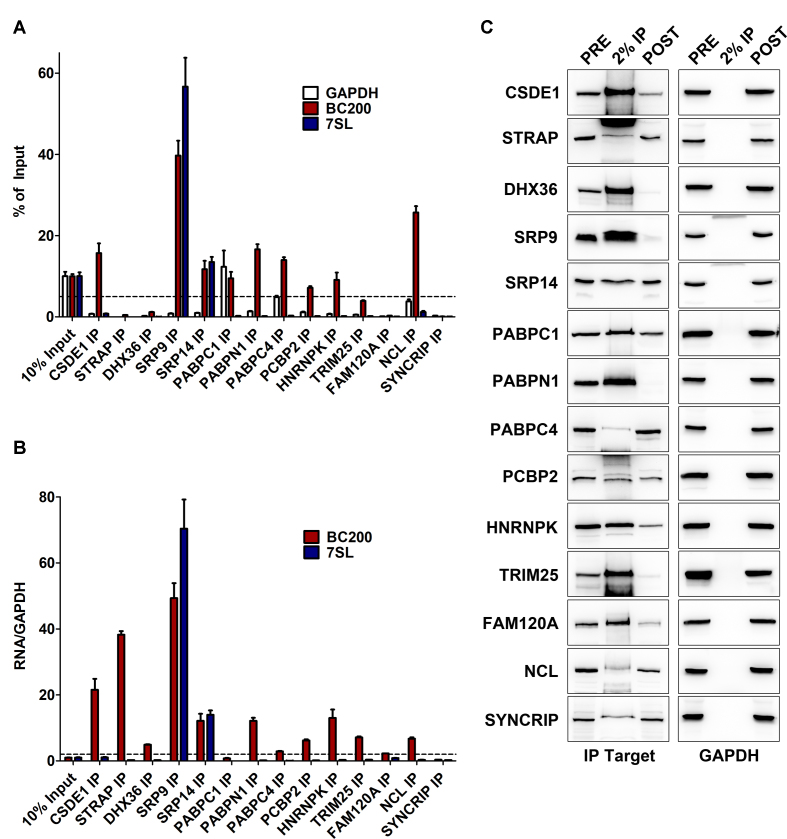
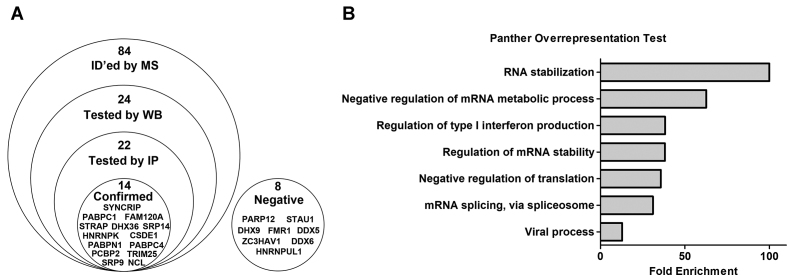
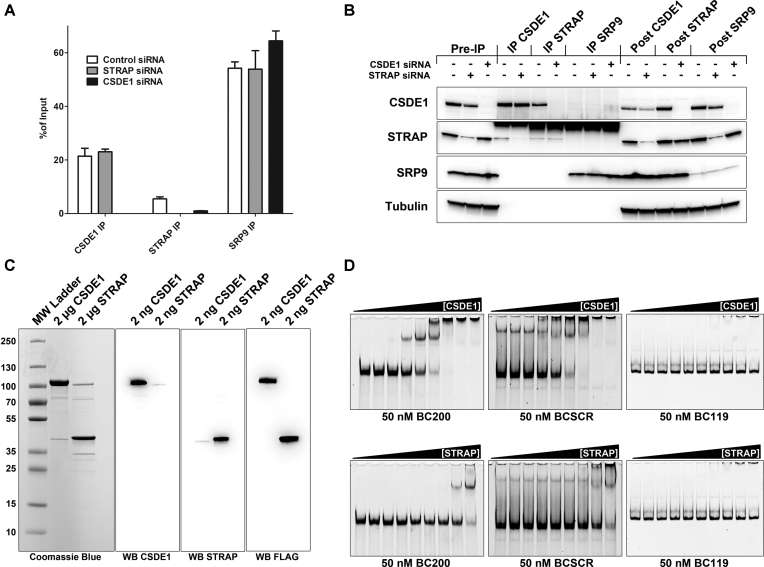
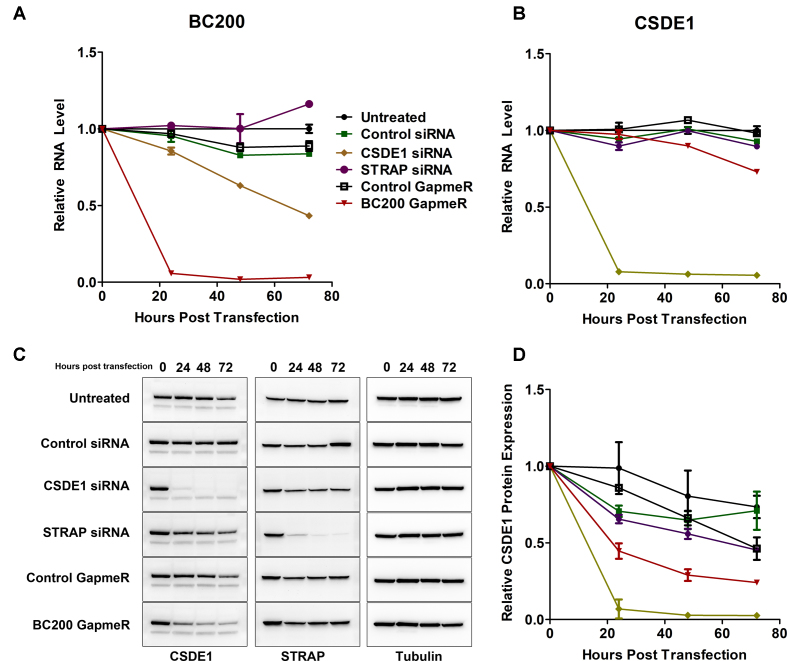
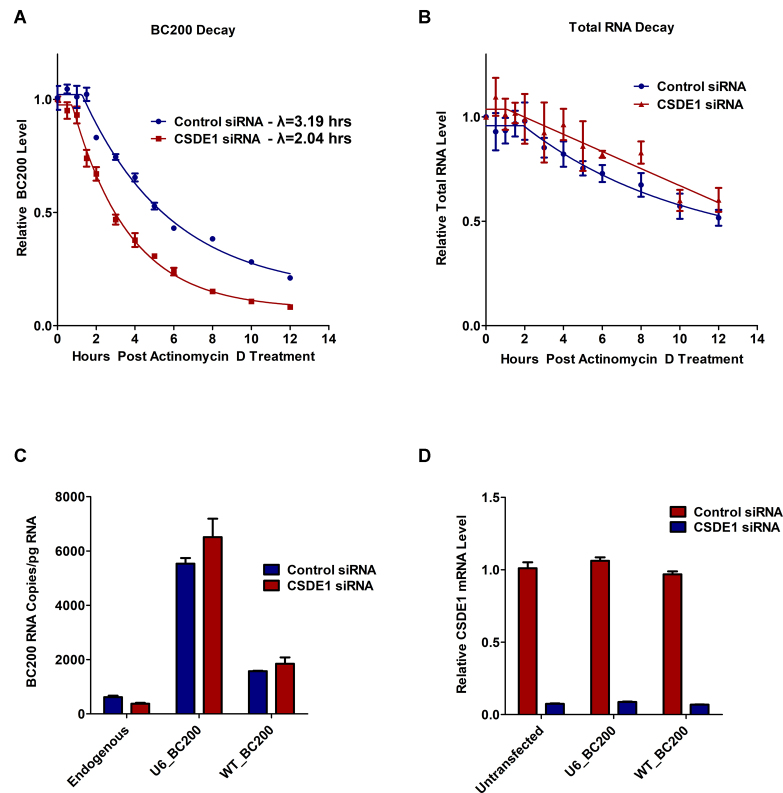
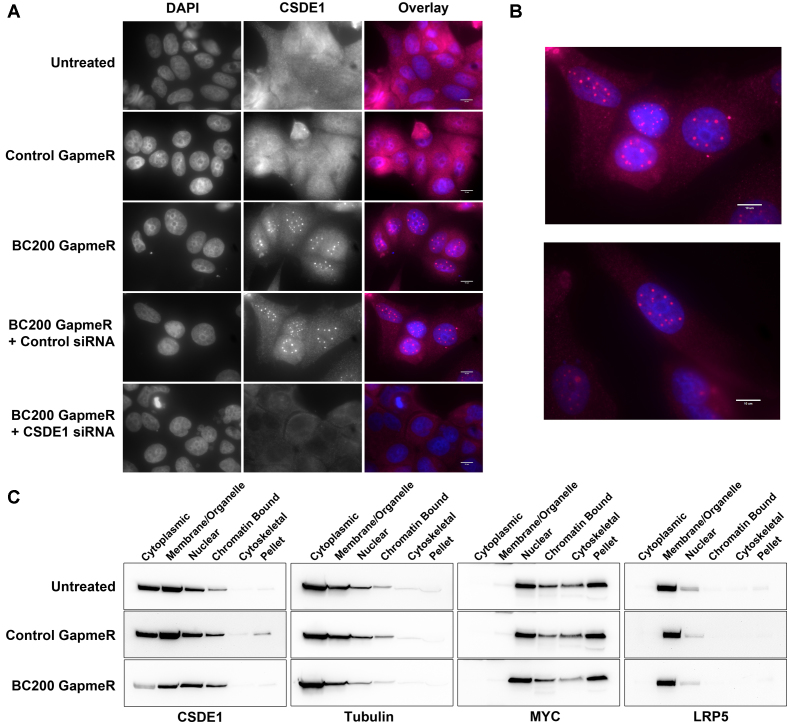
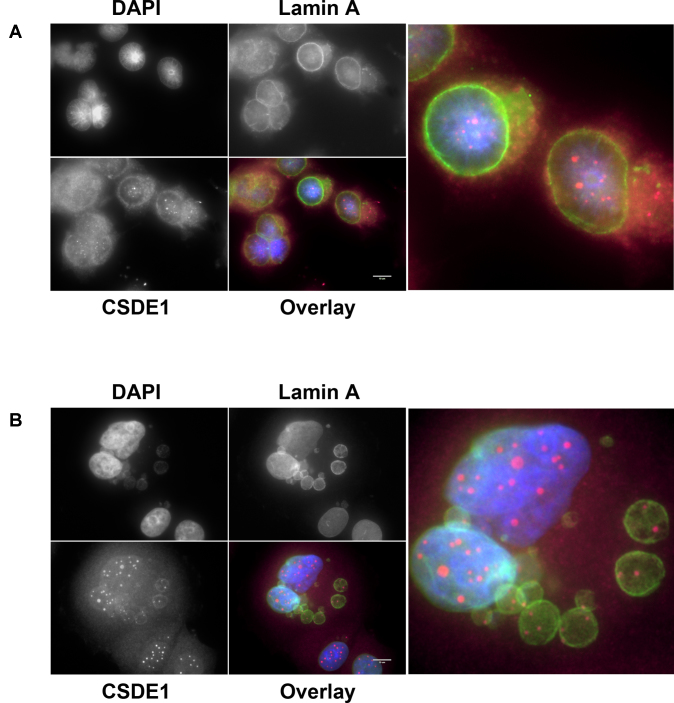
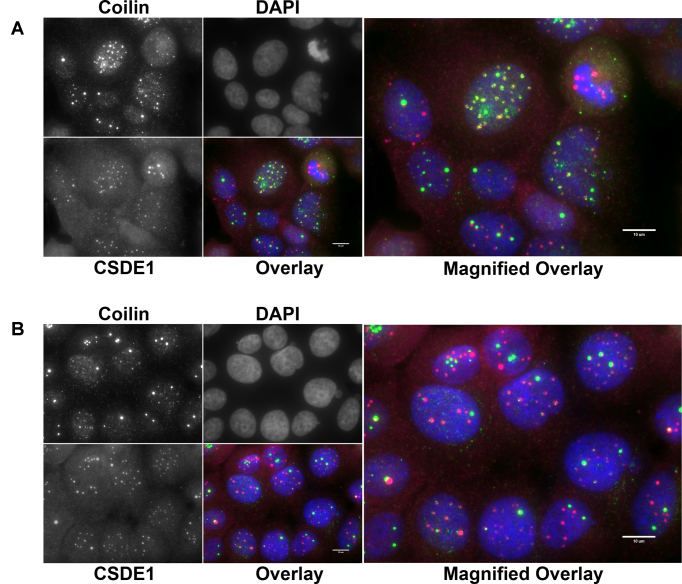
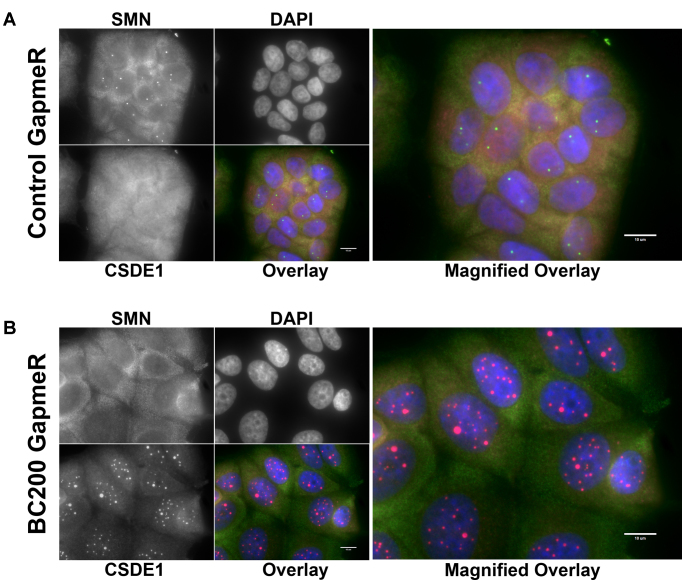
BC200 is a long non-coding RNA primarily expressed in brain but aberrantly expressed in various cancers. To gain a further understanding of the function of BC200, we performed proteomic analyses of the BC200 ribonucleoprotein (RNP) by transfection of 3' DIG-labelled BC200. Protein binding partners of the functionally related murine RNA BC1 as well as a scrambled BC200 RNA were also assessed in both human and mouse cell lines. Stringent validation of proteins identified by mass spectrometry confirmed 14 of 84 protein binding partners and excluded eight proteins that did not appreciably bind BC200 in reverse experiments. Gene ontology analyses revealed general roles in RNA metabolic processes, RNA processing and splicing. Protein/RNA interaction sites were mapped with a series of RNA truncations revealing three distinct modes of interaction involving either the 5' Alu-domain, 3' A-rich or 3' C-rich regions. Due to their high enrichment values in reverse experiments, CSDE1 and STRAP were further analyzed demonstrating a direct interaction between CSDE1 and BC200 and indirect binding of STRAP to BC200 via heterodimerization with CSDE1. Knock-down studies identified a reciprocal regulatory relationship between CSDE1 and BC200 and immunofluorescence analysis of BC200 knock-down cells demonstrated a dramatic reorganization of CSDE1 into distinct nuclear foci.


Figures

Figure 1.
Figure 1.
MS analysis of the BC200 RNP. (A) Venn diagram displaying the summary statistics of the MS analysis of the BC200 RNP in MCF-7, HEK-293T and MDA-MB-231 cell lines. Total number of proteins identified in each category are indicated by bolded numbers and average unique peptide numbers are reported in parentheses. (B) As in (A), summary statistics of the proteins bound to BC200, BC1 and BCSCR in MCF-7 cells. (C) As in (B) for MEF cells. (D) Comparison of shared and unique binding partners for BC200, BC1 and BCSCR between MCF-7 and MEF cells. (E) Average peptide numbers reported as a bar graph for the most abundant BC200 interacting proteins identified in MCF-7 cells compared to data obtained with the BC1 and BCSCR RNAs. Data represents the mean of three independent replicates ± standard deviation.
Figure 2.
Figure 2.
Western blot analysis of confirmed BC200 targets. (A) Panel 1: Western blots were performed with antibodies to the indicated proteins on pull-down samples of untransfected (UT, beads alone) and transfected BC1, BC200 and BCSCR RNAs. Panel 2: Western blots were performed as in Panel 1 on pull-down samples of the indicated DIG-labelled RNAs incubated in 500 μl cell lysate (5 mg/ml) at a concentration of 250 nM. (B) Schematic of the BC200 RNA demonstrating the predicted secondary structure.
Figure 3.
Figure 3.
RNA Immunoprecipitation experiments of confirmed BC200 targets. (A) RT-qPCR analysis of BC200, GAPDH and 7SL enrichment by immunoprecipitation of the indicated proteins. RNA extracted from 10% of the input sample was used as a reference to calculate percent of input for each RNA that was bound to the immunoprecipitated protein. Data represents the mean of three independent replicates ± standard deviation. Dashed line represents the threshold value of 5% input. (B) Percent input values of BC200 and 7SL were compared to GAPDH to demonstrate the degree of specificity of the interactions analyzed in (A). Dashed line represents the threshold value of 2-fold enrichment. (C) Immunoprecipitation efficiency was monitored by performing western blot on 50 μg of PRE and POST IP samples as well as 2% of the IP.
Figure 4.
Figure 4.
Protein Validation summary in MCF-7 cells. (A) Diagram representing the total proteins identified in MCF-7 cells (average peptide number > 1) and the progression of the validation process. (B) Panther overrepresentation test of the 14 confirmed BC200 binding partners as reported in (A).
Figure 5.
Figure 5.
CSDE1 can bind directly to BC200 whereas STRAP interactions are CSDE1 dependent. (A) Immunoprecipitation experiments performed as described for Figure 3A under conditions of CSDE1 and STRAP knock-down by siRNA (48 h post transfection, CSDE1 siRNA_2, STRAP siRNA_2). Co-immunoprecipitating BC200 RNA was detected by RT-qPCR and compared to total RNA extracted from 10% of input. Data represents the mean of three independent replicates ± standard deviation. (B) Immunoprecipitation efficiency was monitored as in Figure 3C. (C) Panel 1: Coomassie stain gel of purified CSDE1 and STRAP separated by SDS/PAGE. Panel 2: Western blot with antibodies against CSDE1 of 2 ng purified CSDE1 and STRAP protein separated by SDS/PAGE. Panel 3: As in Panel 1, with antibodies to STRAP. Panel 4: As in Panel 1, with antibodies to FLAG peptide. (D) Electrophoretic mobility shift assays of binding reactions prepared with 50 nM BC200, BCSCR or BC119 and a concentration gradient of the indicated proteins. Serial dilutions of protein were used from 1000 to 7.8 nM. Gels were stained with SYBR Gold nucleic acid stain.
Figure 6.
Figure 6.
BC200 and CSDE1 expression are mutually codependent. (A) RT-qPCR analysis of BC200 RNA expression following transfection with the indicated RNA interference oligonucleotides. Data represents the mean of three independent replicates ± standard deviation. (B) RT-qPCR analysis of CSDE1 mRNA expression following transfection with the indicated RNA interference oligonucleotides. Data represents the mean of three independent replicates ± standard deviation. (C) Western blot analysis of protein samples from a 72-hour knock-down time-course with the indicated RNA interference oligonucleotides and antibodies. Data is representative of three independent replicates. (D) Densitometry measurements of CSDE1 protein expression from (C) as well as replicate experiments. Data represents the mean of three independent replicates ± standard deviation
Figure 7.
Figure 7.
CSDE1 knock-down decreases stability of the BC200 RNA. (A) RT-qPCR analysis of BC200 expression following 72-hour CSDE1 or control knock-down and Actinomycin D treatment at T = 0. Indicated half-lives were calculated by fitting the data to a one-phase decay equation with GraphPad Prism software. Data represents the mean of three independent biological replicates measured in duplicate. (B) Relative total RNA quantities purified at the indicated time points from an equal number of cells to monitor total RNA decay. Data represents the mean of three independent replicates ± standard deviation. (C) MCF-7 cells were reverse transfected with control or CSDE1 siRNA and following 24 h were forward transfected with the plasmids containing BC200 under control of either the U6 snRNA promoter or endogenous BC200 promoter. Absolute expression levels of RNA from plasmid was calculated by RT-qPCR in parallel to a standard curve generated with purified BC200 RNA. Data represents the mean of three independent replicates ± standard deviation. (D) Relative CSDE1 mRNA expression was monitored by RT-qPCR analysis of the same RNA samples as used in (C).
Figure 8.
Figure 8.
BC200 knock-down results in decreased cytoplasmic expression and localization of CSDE1 to concentrated nuclear foci. (A) Immunofluorescent analysis of MCF-7 cells transfected with the indicated RNA interference oligonucleotides. Cells were probed with anti-CSDE1 antibodies and counter-stained with DAPI. Scale bars indicate 10 μM. (B) Magnified representative images of CSDE1 localization following BC200 knock-down. (C) Western blot analysis of the subcellular distribution of CSDE1 following transfection of either control or BC200 targeting LNA GapmeR. Blots were subsequently probed with antibodies to Tubulin (cytoplasmic), MYC (Nuclear) and LRP5 (Membrane) to control for loading and fraction specificity.
Figure 9.
Figure 9.
CSDE1-rich foci are not equivalent to previously described UNR-rich nucleoplasmic reticulum. (A) Immunofluorescent analysis of MCF-7 cells transfected with BC200 targeting GapmeR. Cells were probed with antibodies to CSDE1 (magenta) and Lamin A (green) and counter-stained with DAPI. (B) As in (A) highlighting nuclear localization in budded apoptotic nuclear membranes. Scale bars indicate 10 μM.
Figure 10.
Figure 10.
CSDE1-rich foci associate with coiled bodies in a subpopulation fixed cells. (A) Immunofluorescent analysis of MCF-7 cells transfected with BC200 targeting GapmeR. Cells were probed with antibodies to CSDE1 (magenta) and Coilin (green) and counter-stained with DAPI. Cell in centre of the field of view demonstrates complete colocalization of the nuclear foci. (B) As in (A) highlighting cells in which colocalization of foci is not evident. Scale bars indicate 10 μM.
Figure 11.
Figure 11.
CSDE1-rich foci do not colocalize with nuclear gems. (A) Immunofluorescent analysis of MCF-7 cells transfected with control GapmeR. Cells were probed with antibodies to CSDE1 (magenta) and SMN (green) and counter-stained with DAPI. (B) As in (A) MCF-7 cells were transfected with BC200 targeting GapmeR causing reorganization of CSDE1 into nuclear foci and loss of nuclear SMN. Scale bars indicate 10 μM.

Similar articles

Cited by

References

    1. Booy E.P., McRae E.K., Koul A., Lin F., McKenna S.A.. The long non-coding RNA BC200 (BCYRN1) is critical for cancer cell survival and proliferation. Mol. Cancer. 2017; 16:109. - PMC - PubMed
    1. Watson J.B., Sutcliffe J.G.. Primate brain-specific cytoplasmic transcript of the Alu repeat family. Mol. Cell. Biol. 1987; 7:3324–3327. - PMC - PubMed
    1. Chen J., Wang R., Zhang K., Chen L.B.. Long non-coding RNAs in non-small cell lung cancer as biomarkers and therapeutic targets. J. Cell. Mol. Med. 2014; 18:2425–2436. - PMC - PubMed
    1. Chen W., Bocker W., Brosius J., Tiedge H.. Expression of neural BC200 RNA in human tumours. J. Pathol. 1997; 183:345–351. - PubMed
    1. Hu T., Lu Y.R.. BCYRN1, a c-MYC-activated long non-coding RNA, regulates cell metastasis of non-small-cell lung cancer. Cancer Cell Int. 2015; 15:36. - PMC - PubMed

Publication types

MeSH terms

LinkOut - more resources