. 2018 Nov 30;46(21):11528-11538.
doi: 10.1093/nar/gky845.

The APT complex is involved in non-coding RNA transcription and is distinct from CPF

Affiliations

The APT complex is involved in non-coding RNA transcription and is distinct from CPF

Michael Lidschreiber et al. Nucleic Acids Res. .

Abstract

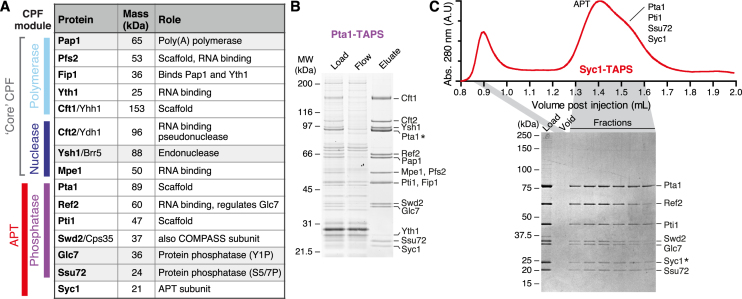
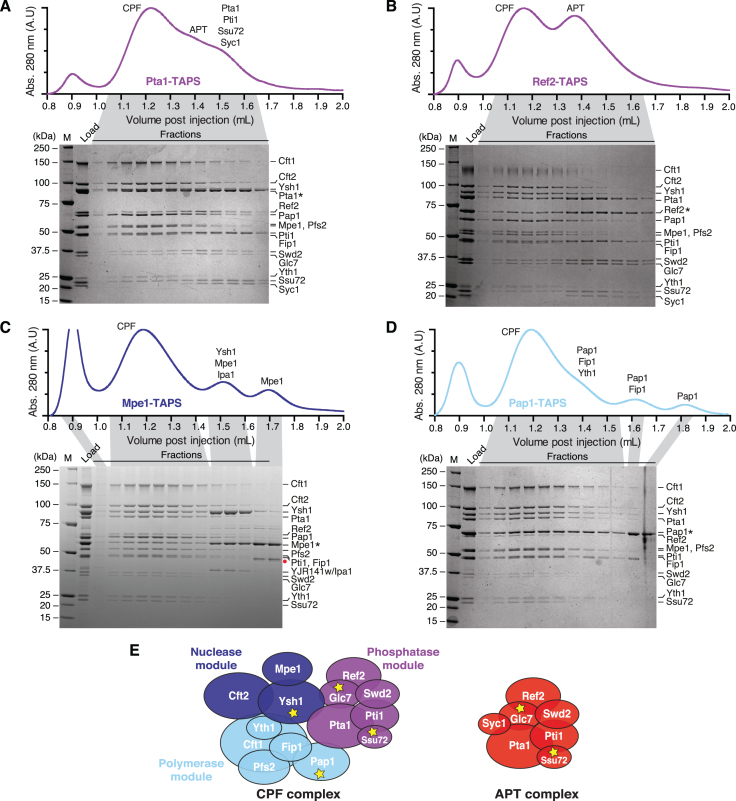
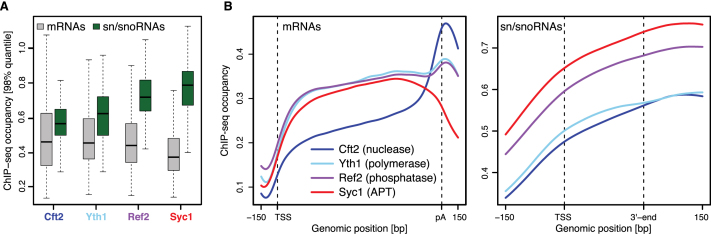
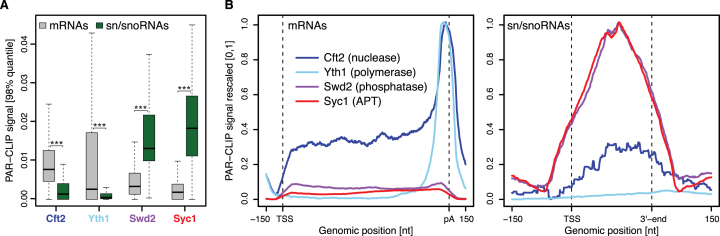
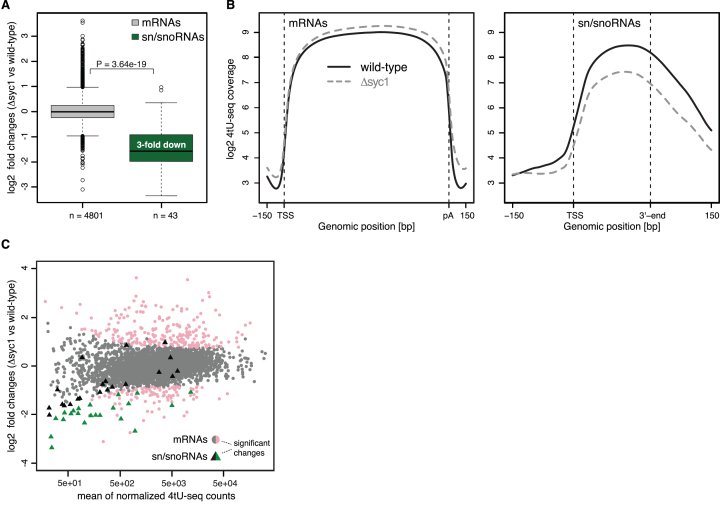
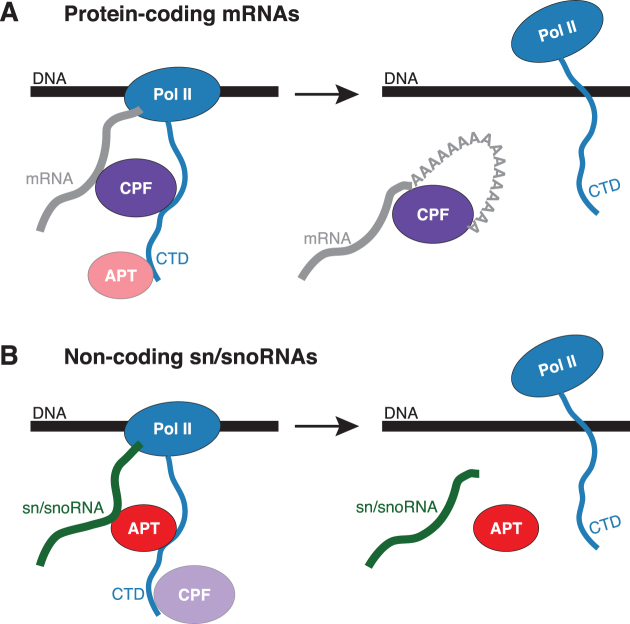
The 3'-ends of eukaryotic pre-mRNAs are processed in the nucleus by a large multiprotein complex, the cleavage and polyadenylation factor (CPF). CPF cleaves RNA, adds a poly(A) tail and signals transcription termination. CPF harbors four enzymatic activities essential for these processes, but how these are coordinated remains poorly understood. Several subunits of CPF, including two protein phosphatases, are also found in the related 'associated with Pta1' (APT) complex, but the relationship between CPF and APT is unclear. Here, we show that the APT complex is physically distinct from CPF. The 21 kDa Syc1 protein is associated only with APT, and not with CPF, and is therefore the defining subunit of APT. Using ChIP-seq, PAR-CLIP and RNA-seq, we show that Syc1/APT has distinct, but possibly overlapping, functions from those of CPF. Syc1/APT plays a more important role in sn/snoRNA production whereas CPF processes the 3'-ends of protein-coding pre-mRNAs. These results define distinct protein machineries for synthesis of mature eukaryotic protein-coding and non-coding RNAs.


Figures

Figure 1.
Figure 1.
Purification of CPF and APT complexes. (A) CPF subunits from yeast. Names of proteins used in this work are in bold. Masses were calculated using ProtParam. (B) SDS-PAGE analysis of Pta1-TAPS purification from Streptactin resin, stained with SYPRO Ruby. Subunits were analyzed using tryptic-digest mass spectrometry from excised bands and all 15 previously-known CPF proteins were identified. (C) Purification from a Syc1-tagged yeast strain yields only the seven APT subunits. The gel filtration chromatogram (absorbance at 280 nm, arbitrary units) and corresponding Coomassie-blue stained SDS-PAGE analysis of fractions are shown. An asterisk indicates the tagged subunit.
Figure 2.
Figure 2.
Syc1 is not found in the CPF complex. (A–D) Purifications from (A) Pta1-, (B) Ref2-, (C) Mpe1- and (D) Pap1-tagged yeast strains. Gel filtration chromatograms (absorbance at 280 nm, arbitrary units) and corresponding Coomassie-blue stained SDS-PAGE analyses of fractions are shown. Asterisks indicate the tagged subunits. The red circle (panel C) represents a degradation product of Mpe1 identified by tryptic digest mass spectrometry. M is molecular weight marker. (E) Schematic diagrams of CPF and APT complexes. Proteins have an area proportionate to their molecular weight. Yellow stars denote enzymes.
Figure 3.
Figure 3.
APT is more abundant than CPF on sn/snoRNA genes. (A) Distribution of ChIP-seq occupancies at selected mRNA (gray, n = 724) and sn/snoRNA (green, n = 29) genes (see Materials and Methods). Gene-wise ChIP-seq occupancies were derived by taking the 98% quantile of the smoothed, normalized occupancies over the region covering the gene body and 100 bp downstream. Box limits are the first and third quartiles, the band inside the box is the median. The ends of the whiskers extend the box by 1.5 times the interquartile range. (B) Gene-averaged ChIP-seq occupancy profiles over selected mRNA (left) and sn/snoRNA (right) genes (as in A). Before averaging, normalized gene profiles were aligned at their transcription start site (TSS) and length-scaled such that their polyadenylation (pA) sites/3′-ends coincided.
Figure 4.
Figure 4.
Syc1 preferentially crosslinks to sn/snoRNA transcripts. (A) Distribution of PAR-CLIP occupancies at selected mRNAs (grey, n = 2905) and sn/snoRNAs (green, n = 62) (see Materials and Methods). Gene-wise PAR-CLIP occupancies were derived by taking the 98% quantile of the smoothed, normalized occupancies over the region covering the gene body and 100 bp downstream. P-values were derived by two-sided Mann–Whitney U test, ***P < 0.001. Box limits are the first and third quartiles, the band inside the box is the median. The ends of the whiskers extend the box by 1.5 times the interquartile range. (B) Gene-averaged PAR-CLIP occupancy profiles over selected mRNAs (left) and sn/snoRNAs (right) (as in A). Before averaging, normalized gene profiles were aligned at their TSS and length-scaled such that their pA sites/3′-ends coincided.
Figure 5.
Figure 5.
SYC1 deletion leads to down-regulation of sn/snoRNA transcription. (A) Distribution of log2 fold changes of normalized 4tU-RNA-seq read counts for Δsyc1 versus wild-type cells for selected mRNAs (grey, n = 4801) and sn/snoRNAs (green, n = 43) (see Materials and Methods). The P-value was derived by two-sided Mann–Whitney U test. Box limits are the first and third quartiles, the band inside the box is the median. The ends of the whiskers extend the box by 1.5 times the interquartile range. (B) Transcript-averaged coverage of newly synthesized RNA measured by 4tU-Seq in wild-type (solid line) and Δsyc1 (dashed line) yeast over selected mRNAs (left) and sn/snoRNAs (right) (as in A). Before averaging, normalized transcript profiles were aligned at their TSS and length-scaled such that their pA sites/3′-ends coincided. (C) MA-plot showing log2 fold change for each transcript between Δsyc1 and wild-type yeast, versus the normalized mean read count across replicates and conditions. Transcripts with a fold change >1.5 and adjusted P-value below 0.1 (as calculated by DESeq2, Materials and Methods) are shown in color. mRNAs and sn/snoRNAs are shown as grey/pink circles and black/green triangles, respectively.
Figure 6.
Figure 6.
Model for CPF and APT function in transcription. Models are shown for CPF (A) and APT (B) on protein-coding mRNAs and sn/snoRNAs.

References

    1. Zhao J., Hyman L., Moore C.. Formation of mRNA 3′ ends in eukaryotes: mechanism, regulation, and interrelationships with other steps in mRNA synthesis. Microbiol. Mol. Biol. Rev. 1999; 63:405–445. - PMC - PubMed
    1. Xiang K., Tong L., Manley J.L.. Delineating the structural blueprint of the pre-mRNA 3′ end processing machinery. Mol. Cell. Biol. 2014; 34:1894–1910. - PMC - PubMed
    1. Jeronimo C., Collin P., Robert F.. The RNA polymerase II CTD: the Increasing complexity of a low-complexity protein domain. J. Mol. Biol. 2016; 428:2607–2622. - PubMed
    1. Gavin A.-C., Bösche M., Krause R., Grandi P., Marzioch M., Bauer A., Schultz J., Rick J.M., Michon A.-M., Cruciat C.-M. et al. . Functional organization of the yeast proteome by systematic analysis of protein complexes. Nature. 2002; 415:141–147. - PubMed
    1. Dichtl B., Blank D., Ohnacker M., Friedlein A., Roeder D., Langen H., Keller W.. A role for SSU72 in balancing RNA polymerase II transcription elongation and termination. Mol. Cell. 2002; 10:1139–1150. - PubMed

Publication types

MeSH terms

Substances