. 2018 Sep 24;16(9):e2006738.
doi: 10.1371/journal.pbio.2006738. eCollection 2018 Sep.

Evolutionary emergence of infectious diseases in heterogeneous host populations

Affiliations

Evolutionary emergence of infectious diseases in heterogeneous host populations

Hélène Chabas et al. PLoS Biol. .

Abstract

The emergence and re-emergence of pathogens remains a major public health concern. Unfortunately, when and where pathogens will (re-)emerge is notoriously difficult to predict, as the erratic nature of those events is reinforced by the stochastic nature of pathogen evolution during the early phase of an epidemic. For instance, mutations allowing pathogens to escape host resistance may boost pathogen spread and promote emergence. Yet, the ecological factors that govern such evolutionary emergence remain elusive because of the lack of ecological realism of current theoretical frameworks and the difficulty of experimentally testing their predictions. Here, we develop a theoretical model to explore the effects of the heterogeneity of the host population on the probability of pathogen emergence, with or without pathogen evolution. We show that evolutionary emergence and the spread of escape mutations in the pathogen population is more likely to occur when the host population contains an intermediate proportion of resistant hosts. We also show that the probability of pathogen emergence rapidly declines with the diversity of resistance in the host population. Experimental tests using lytic bacteriophages infecting their bacterial hosts containing Clustered Regularly Interspaced Short Palindromic Repeat and CRISPR-associated (CRISPR-Cas) immune defenses confirm these theoretical predictions. These results suggest effective strategies for cross-species spillover and for the management of emerging infectious diseases.


Conflict of interest statement

The authors have declared that no competing interests exist.

Figures
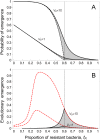
Fig 1
Fig 1. Effect of the proportion of resistant hosts (fR) on pathogen emergence when there is a single type of resistant host (n = 1), and for two values of the pathogen inoculum size (V0 = 1 and 10).
(A) Probability of pathogen emergence with (full curve, u0,1 = 0.01) or without mutations (dashed curve, u0,1 = 0). The shaded area indicates the effect of pathogen adaptation on emergence. The threshold value fR = fT that prevents pathogen emergence in the absence of pathogen adaptation is indicated with a vertical dashed line. (B) Evolutionary emergence of pathogens (the shaded area in A) is maximized for an intermediate value of the fraction of resistant hosts. The dashed red curve shows the theoretical prediction when we account for the change in the escape mutation frequency after the pathogen emergence took place (see section S1.3 of S1 Text). Other parameter values: b = 2.5, d = 1, ϕ = 0, c = 0.2, T = 24.
Fig 2
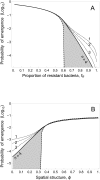
Fig 2. Effect of the fraction of resistant hosts, host resistance diversity (n), and spatial structure (ϕ) on pathogen emergence.
(A) Probability of pathogen emergence without (u0,n = 0, dashed curve) or with (u0,n = 5 * 10−3, full curve) mutations (note the logarithmic scale) when n = 4 and for increasing values of the fraction of resistant hosts in the absence of spatial structure (i.e., ϕ = 0). The shaded area illustrates the fraction of pathogen emergence caused by pathogen adaptation. The dotted curves indicate the probability of emergence for lower levels of host diversity. In (B), the probability of pathogen emergence is shown for increasing values of ϕ (i.e., spatial structure) when fR = 0.88. Other parameter values: b = 2.5, d = 1, c = 0.05.
Fig 3
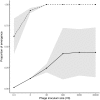
Fig 3. Probability of evolutionary emergence increases with the size of phage inoculum (V0).
The proportion of replicate populations in which emergence (i.e., in which the amplification of the phages is detected, dashed line) or evolutionary emergence (i.e., in which the amplification of an escape phage is detected, solid line) was observed following inoculation with V0 unevolved phages in 96 independent replicate populations, each consisting of 50% sensitive bacteria and 50% BIMs (fR = 0.5). The different values of phage inoculum were obtained by serial dilution and correspond approximately equal to V0 = 0.3, 3, 30, 300, or 3,000, where V0 refers to the mean of a Poisson distributed number of viruses. Shaded areas represent 95% confidence intervals of the mean of two experiments. Data are available in S1 Data. BIM, bacteriophage-insensitive mutant.
Fig 4
Fig 4. Intermediate proportion of resistant hosts maximizes the probability of evolutionary emergence.
Proportion of replicate populations with evolutionary emergence (i.e., in which the amplification of an escape phage is detected) for increasing values of the proportion of resistant bacteria (fR). The different colors correspond to replicate experiments performed using eight different BIMs (see S2 Table and S9 Fig). For each treatment, each of the 96 replicate host populations was inoculated with an initial quantity approximately equal to V0 = 300 unevolved phages. Black lines indicate the mean across the eight BIMs; gray shaded areas represent 95% confidence intervals of the mean. Data are available in S1 Data. BIM, bacteriophage-insensitive mutant.
Fig 5
Fig 5. Increasing the diversity of host resistance decreases the probability of evolutionary emergence.
Proportion of replicate populations with phage emergence (i.e., in which the amplification of the phages is detected, dashed line) or evolutionary emergence (i.e., in which the amplification of an escape phage is detected, solid line) for increasing values of the diversity of host resistance (n = 1, 2, 4, or 8 BIMs) when the proportion of host resistance is fR = 0.5. For each treatment, each of the 96 replicate host populations was inoculated with an initial quantity approximately equal to V0 = 300 unevolved phages. Shaded areas represent 95% confidence intervals of the mean of two experiments. Data are available in S1 Data. BIM, bacteriophage-insensitive mutant.

References

    1. Anderson RM, May RM. Infectious diseases of humans: dynamics and control. Wiley Online Library; 1992.
    1. Diekmann O, Heesterbeek H, Britton T. Mathematical tools for understanding infectious disease dynamics. Princeton University Press; 2013.
    1. Keeling MJ, Rohani P. Modeling infectious diseases in humans and animals. Princeton: Princeton University Press; 2008.
    1. Heesterbeek H, Anderson RM, Andreasen V, Bansal S, De Angelis D, Dye C, et al. Modeling infectious disease dynamics in the complex landscape of global health. Science. 2015;347: aaa4339. 10.1126/science.aaa4339 - DOI - PMC - PubMed
    1. Antia R, Regoes RR, Koella JC, Bergstrom CT. The role of evolution in the emergence of infectious diseases. Nature. 2003;426: 658–661. 10.1038/nature02104 - DOI - PMC - PubMed

Publication types