. 2018 Dec:76:10-22.
doi: 10.1016/j.ceca.2018.09.004. Epub 2018 Sep 15.

Key residues controlling bidirectional ion movements in Na+/Ca2+ exchanger

Affiliations

Key residues controlling bidirectional ion movements in Na+/Ca2+ exchanger

Liat van Dijk et al. Cell Calcium. 2018 Dec.

Abstract

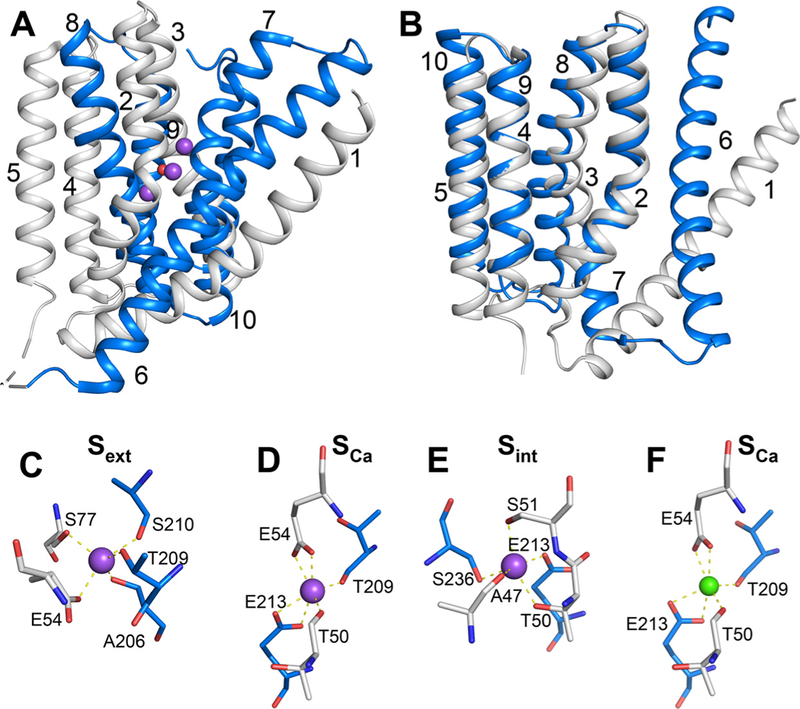
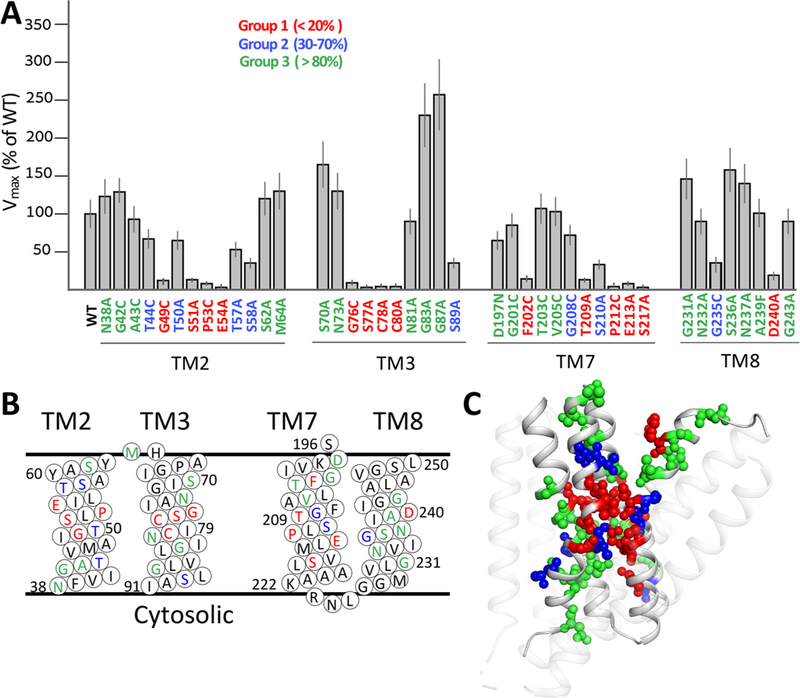
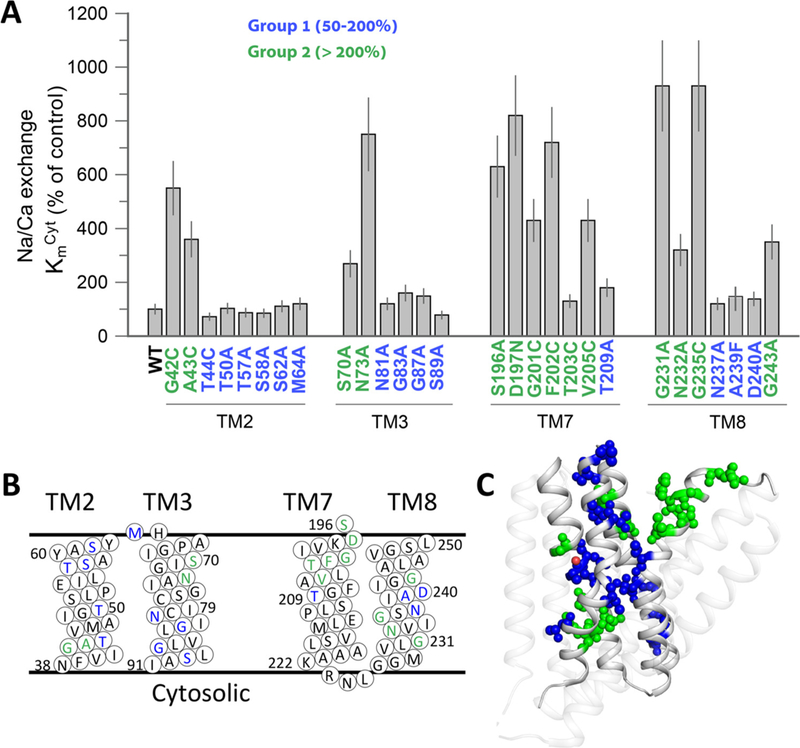
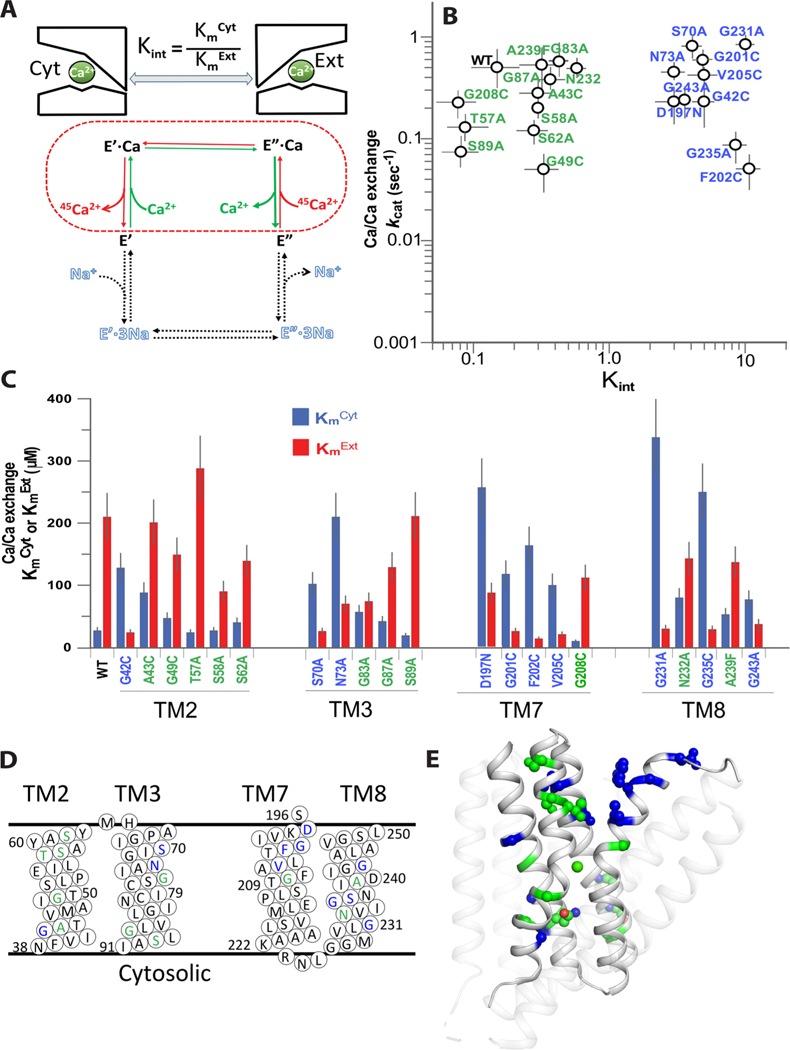
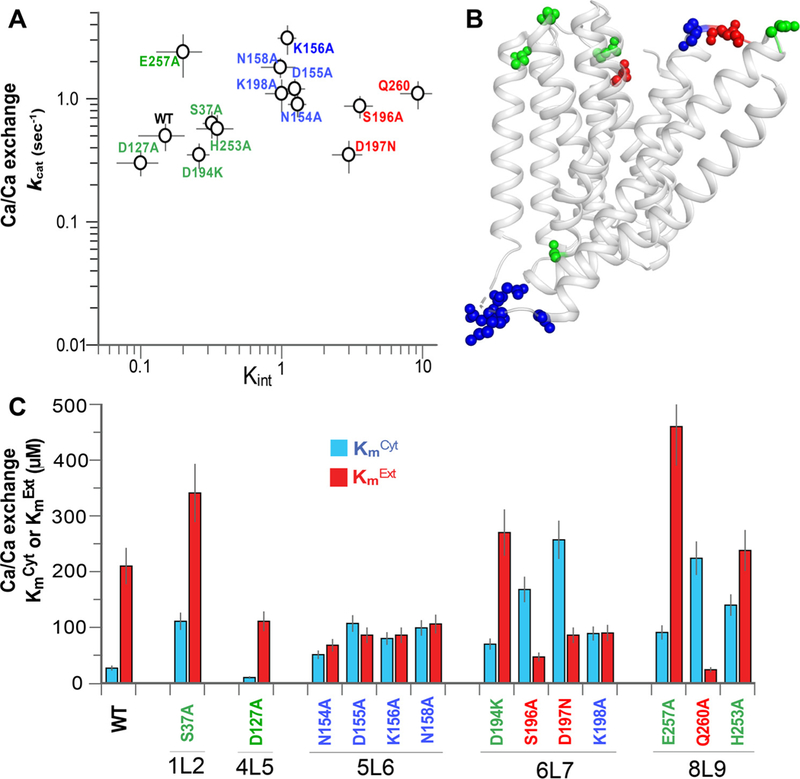
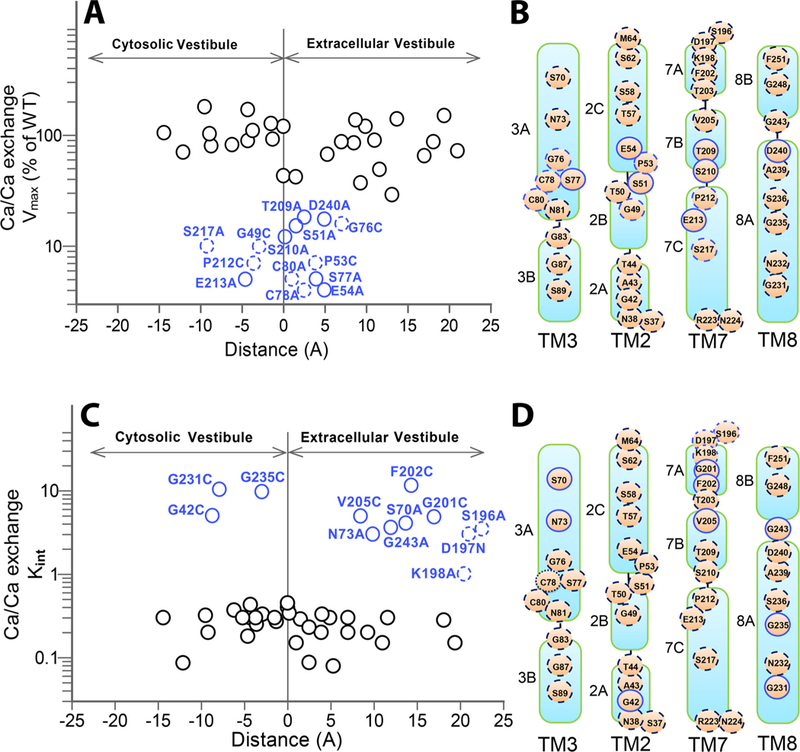
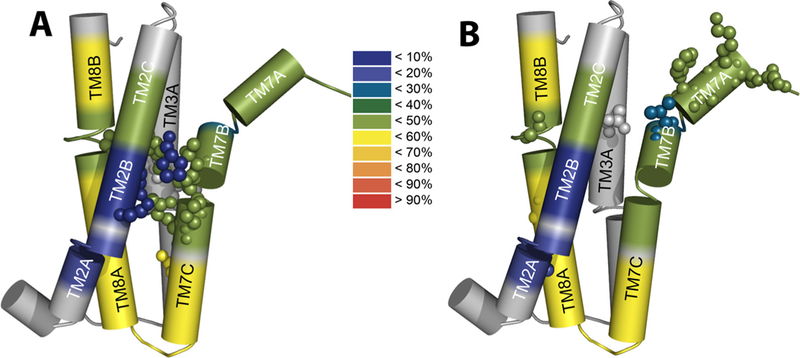
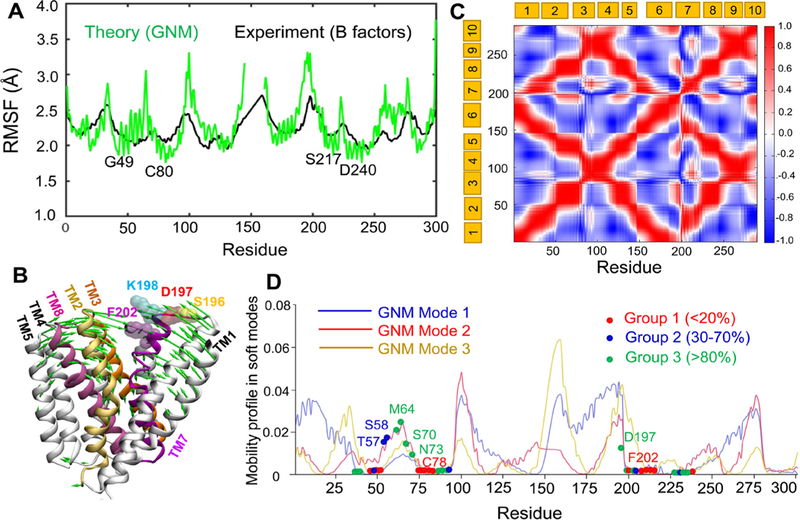
Prokaryotic and eukaryotic Na+/Ca2+ exchangers (NCX) control Ca2+ homeostasis. NCX orthologs exhibit up to 104-fold differences in their turnover rates (kcat), whereas the ratios between the cytosolic (cyt) and extracellular (ext) Km values (Kint = KmCyt/KmExt) are highly asymmetric and alike (Kint ≤ 0.1) among NCXs. The structural determinants controlling a huge divergence in kcat at comparable Kint remain unclear, although 11 (out of 12) ion-coordinating residues are highly conserved among NCXs. The crystal structure of the archaeal NCX (NCX_Mj) was explored for testing the mutational effects of pore-allied and loop residues on kcat and Kint. Among 55 tested residues, 26 mutations affect either kcat or Kint, where two major groups can be distinguished. The first group of mutations (14 residues) affect kcat rather than Kint. The majority of these residues (10 out of 14) are located within the extracellular vestibule near the pore center. The second group of mutations (12 residues) affect Kint rather than kcat, whereas the majority of residues (9 out 12) are randomly dispersed within the extracellular vestibule. In conjunction with computational modeling-simulations and hydrogen-deuterium exchange mass-spectrometry (HDX-MS), the present mutational analysis highlights structural elements that differentially govern the intrinsic asymmetry and transport rates. The key residues, located at specific segments, can affect the characteristic features of local backbone dynamics and thus, the conformational flexibility of ion-transporting helices contributing to critical conformational transitions. The underlying mechanisms might have a physiological relevance for matching the response modes of NCX variants to cell-specific Ca2+ and Na+ signaling.


Conflict of interest statement

Conflict of interest

All authors state no conflict of interests.

Figures

Fig. 1.
Fig. 1.
Structure of NCX_Mj. (A) Crystal structure of 3Na+-bound NCX_Mj (PDB 5HXE) in cartoon representation. The symmetry-related two halves are colored in gray (TM1–5) and blue (TM6–10), respectively. Purple and red spheres represent Na+ ions and water molecule, respectively. (B) Superposition of the symmetry-related two halves, as colored in panel A. (C–F) The ion-binding sites of NCX_Mj. The Smid site is not shown, since there is no experimental or computational evidence that this site can bind either Na+ or Ca2+. Ion-coordinating residues are shown as sticks. Purple and green spheres represent Na+ and Ca2+ ions, respectively.
Fig. 2.
Fig. 2.
Mutational effects on the Vmax values of the Na+/Ca2+ exchange. (A) The initial rates (t = 5s) of Na+-dependent 45Ca2+-uptake were measured by using E. coli-derived vesicles containing the overexpressed protein of a given mutant or WT NCX_Mj (see Materials and Methods). The Vmax values of the Na+/Ca2+ exchange reaction were measured for NCX_Mj mutants as described in Materials and Methods. The Vmax values of the indicated mutants are presented in percentage values in comparison with WT Vmax (100%). Data are presented as bars (mean ± SE). The data were derived from at least 3 independent experiments. Residues are colored according to their mutational effects on Vmax, as indicated. (B) Topological positions of mutated residues are presented according to color assignments, described in panel A. (C) Cartoon representation of NCX_Mj. Mutated residues are shown as spheres and are displayed in color according to the mutational effect (see panel A). Note the specific distribution of residues belonging to group 1 (red) in the vicinity of the pore core.
Fig. 3.
Fig. 3.
Mutational effects on the KmCyt values of the Na+/Ca2+ exchange. (A) The KmCyt values of the Na+/Ca2+ exchange reaction were measured for the indicated mutants, as described in Materials and Methods. The KmCyt values of the indicated mutants are presented in percentage values in comparison with the WT Kmcyt values. Data were obtained from at least 3 independent experiments and are presented as mean ± SE. Residues are colored according to their effects on Km, as indicated. (B) Topological positions of mutated residues are presented in color, as displayed in the panel A. (C) Cartoon presentation of NCX_Mj. Mutated residues are shown as spheres and colored according to the mutational effects, as in panel A.
Fig. 4.
Fig. 4.
Mutational effects of pore-forming residues on the Kint and kcat values of the Ca2+/Ca2+ exchange. (A) Schematic representation of the Ca2+/Ca2+ exchange reaction for measuring the Kint and kcat values of bidirectional Ca2+ movements. The dashed line represents the partial reaction of the Ca2+/Ca2+ exchange, where the intrinsic equilibrium of bidirectional Ca2+ movements (Kint) is defined as the ratio of apparent affinities for Ca2+ at the cytosolic (KmCyt) and extracellular (KmExt) sides (Kint = KmCyt/KmExt). B) The initial rates (t = 5s) of Ca2+-dependent 45Ca2+-uptake were measured for determining the KmCyt and KmExt values. The KmCyt values were determined using varying [Ca2+]Cyt = 2–200 μM and saturating [Ca2+]Ext = 2 mM (blue bars), whereas the KmExt values were measured using varying [Ca2+]Ext = 10–2000 μM and fixed [Ca2+]cyt = 2mM (red bars). The kcat values were derived from the measured Vmax values of the Ca2+/Ca2+ exchange as described in Materials and Methods. Data are presented as mean ± SE of at least 3 independent experiments. Mutations resulting in Kint <1 or Kint >1 are in green and blue, respectively. (C) The KmCyt (blue bars) and KmExt (red bars) values of the Ca+/Ca2+ exchange reaction were measured as described in panel B. Data are presented as mean ± SE obtained at least 3 independent experiments (see Materials and Methods). Residues are colored according to their mutational effects on Kint, as shown in panel B. (D) Topological positions of residues are assigned according to their mutational effects on Kint, as colored in panel B. (E) Cartoon presentation of NCX_Mj. Mutated residues are shown as spheres, where they are colored according to mutational effects, described in panel B.
Fig. 5.
Fig. 5.
Mutational effects of loop-residues on the Kint and kcat values of the Ca2+/Ca2+ exchange. (A) Mutational effects on the Kint and kcat values of the Ca2+/Ca2+ exchange were analyzed as described in Fig. 4 (see also Materials and Methods). Data were derived from at least 3 independent experiments and are presented as mean ± SE. Mutations exhibiting Kint < < 1, Kint ≈ 1 and Kint > > 1 are in green, blue, and red, respectively. (B) Cartoon presentation of NCX_Mj. Mutated residues are shown as spheres, where the colored residues are assorted according to their mutational effects, as indicated in panel A. (C) The measured values of KmCyt (blue bars) and KmExt (red bars) of the Ca+/Ca2+ exchange reaction were derived from at least 3 independent experiments. Data are presented as mean ± SE. Residues are colored according to their mutational effects on Kint, as colored in panel A.
Fig. 6.
Fig. 6.
Spatial distribution of residues differentially affecting the Vmax and Kint values. (A) For each mutant, the Vmax value of the Ca2+/Ca2+ exchange was plotted vs. its position within the pore. The residue-positions are expressed as the distance from the pore center (the “zero” represents the position of the pore center). The residues significantly affecting the Vmax value (< 20% of WT Vmax) are shown in blue, where less significant residues affecting the ion-transport rates are shown as solid black circles. The solid and dashed blue circles represent the ion-coordinating and non-coordinating residues, respectively. (B) Topological presentation of mutated positions. The mutational effects of residues on Vmax are colored as in panel A. (C) For each mutant, the Kint value was plotted vs its distance from the pore center. The mutants exhibiting high Kint values are indicated in blue, whereas the solid and dashed circles represent the pore-forming and helix-loop residues, respectively. Solid black cycles represent mutations having an insignificant effect on Kit (D). Topological presentation of mutated positions are colored as in panel C.
Fig. 7.
Fig. 7.
Structural-dynamics and functional relationships in NCX_Mj. Schematic heat maps of the hydrogen-deuterium exchange were overlaid on the pore-forming TMs by using the available HDX-MS data [31] and the crystal structural of NCX_Mj [12,30]. The color ruler represents the HDX levels (in %), thereby depicting the characteristic profiles of backbone dynamics in apo NCX_Mj (blue signifies the most rigid and water inaccessible segments in protein). (A) The key residues limiting the ion transport rates (shown as spheres) are located on the TM2B, TM3 A, TM7BC, and TM8 A segments within the pore core, while showing striking differences in the local backbone dynamics at respective locations. (B) Key residues affecting the intrinsic equilibrium (Kint) of bidirectional Ca2+ movements (shown as spheres) are distributed at peripheral locations on TM2 A, TM3 A, TM7AB, and TM8 AB, which is consistent with the known mechanisms of ion occlusion and also provides new clues for the mechanisms underlying ion-coupled alternating access.
Fig. 8.
Fig. 8.
Conformational dynamics of NCX_Mj predicted by elastic network models. (A) Comparison of the theoretically predicted root-mean-square fluctuations (RMSFs) of residues (green) with the B-factors profile (black) observed in X-ray crystallographic experiments (PDB: 3V5S). (B) ANM mode 2 (green arrows) in the presence of lipid bilayer induce the closure of the extracellular vestibule, in favor of a transition from OF open state to an OF occluded state. (C) Cross-correlation map for the coupled fluctuations of all residues driven by the softest GNM modes 1–3. Red regions indicate pairs of residues undergoing correlated movements, blue regions indicate the pairs that undergo anticorrelated (coupled but opposite direction) fluctuations. Note that TM1 and TM6 are highly correlated, and they are anticorrelated with TM2–4 and TM8–9. (D) Residues in group 1 occupy minima in the mobility profile. The graph displays global mobilities of residues (corresponding to the soft modes 1, 2 and 3) obtained by GNM analysis of NCX_Mj embedded in a lipid bilayer. The blue, red and oranges curves represent the predictions from the respective three GNM modes. Red, blue and green spheres indicate the mutated residues belonging to those classified as Group 1 (Vmax < 20%), Group 2 (30 < Vmax < 70%), and Group 3 (> 80%), respectively in Fig. 2. The residues that show minimal (close to zero) mobility in at least one of the three soft modes are shown by their color-coded sphere. Those located in other regions, are indicated on the mode 2 curve. Minima refer to structural regions that serve as hinges or anchors in the global movements of the entire exchanger. All calculations and visualizations were performed using the DynOmics server.
Fig. 9.
Fig. 9.
Conformational dynamics of NCX_Mj captured by full-atomic computations suggests the potential role of the 5L6 loop. (A–B) Simulations indicate that the 5L6 loop reorients differently in the outward-facing (OF) and inward-facing (IF) conformers of NCX_Mj as illustrated for (A) X-ray resolved NCX_Mj OF conformer (PDB: 5HWY), and (B) MD-refined IF conformer. (C) Structure of the IF homologous superfamily member VCX1 Calcium/Proton Exchanger resolved in the IF state (PDB: 4K1C). The simulations suggest that the 5L6 loop (orange) swings into the intracellular vestibule in the IF state. Notably, the homologous 5L6 loop (or acidic helix) of VCX1 (H+/Ca2+ exchanger) also exhibits a similar orientation in the IF state.

Similar articles

Cited by

References

    1. Philipson KD, Nicoll DA, Sodium-calcium exchange: a molecular perspective, Annu. Rev. Physiol. 62 (2000) 111–133. - PubMed
    1. Blaustein MP, Lederer WJ, Sodium/calcium exchange: its physiological implications, Physiol. Rev. 79 (1999) 763–854. - PubMed
    1. Khananshvili D, The SLC8 gene family of sodium-calcium exchangers (NCX): structure, function, and regulation in health and disease, Mol. Asp. Med. 34 (2013) 220–235. - PubMed
    1. Palty R, Silverman WF, Hershfinkel M, Caporale T, Sensi SL, Parnis J, Nolte C, Fishman D, Shoshan-Barmatz V, Herrmann S, Khananshvili D, Sekler I, NCLX is an essential component of mitochondrial Na+/Ca2+ exchange, Proc. Natl. Acad. Sci. U. S. A. 107 (2010) 436–441, 10.1073/pnas.0908099107. - DOI - PMC - PubMed
    1. Khananshvili D, Sodium-calcium exchangers (NCX): molecular hallmarks underlying the tissue-specific and systemic functions, Plügers Arch. 466 (2014) 43–60. - PubMed

Publication types