. 2018 Nov;129(11):2350-2360.
doi: 10.1016/j.clinph.2018.08.023. Epub 2018 Sep 8.

Ocular torsion responses to electrical vestibular stimulation in vestibular schwannoma

Affiliations

Ocular torsion responses to electrical vestibular stimulation in vestibular schwannoma

Stuart W Mackenzie et al. Clin Neurophysiol. 2018 Nov.

Abstract

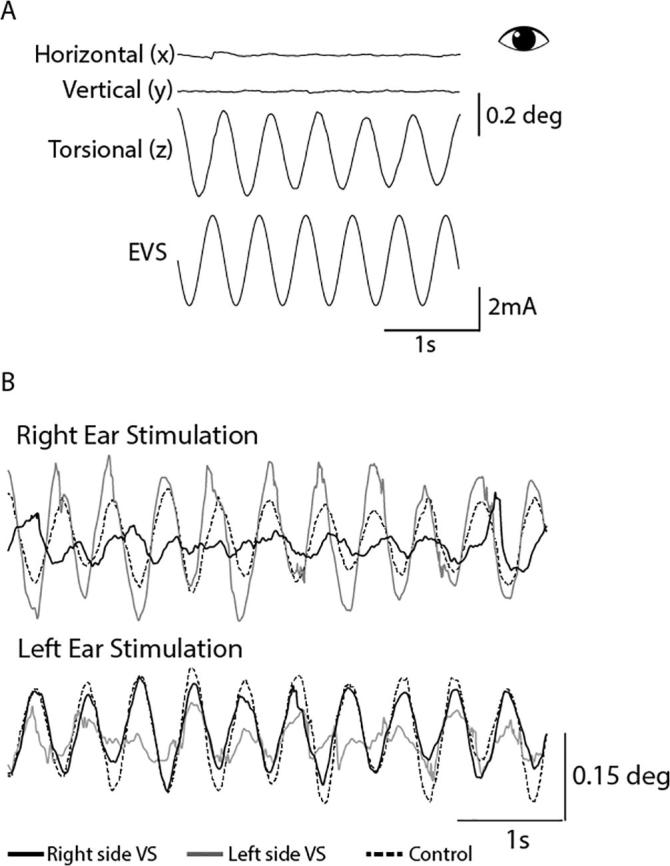
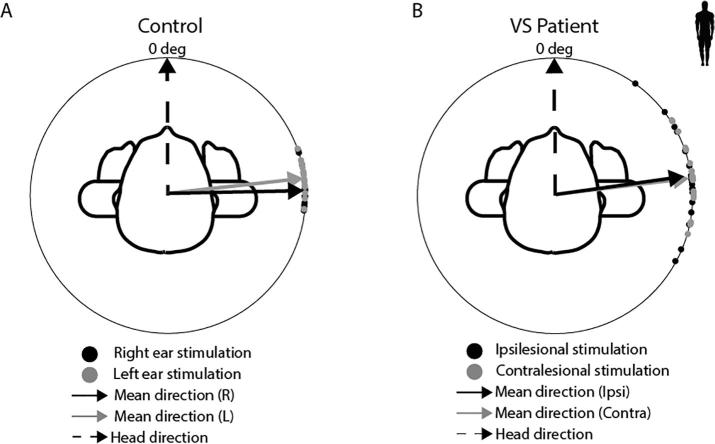
Objectives: We determined if eye movements evoked by Electrical Vestibular Stimulation (EVS) can be used to detect vestibular dysfunction in patients with unilateral vestibular schwannoma (VS).

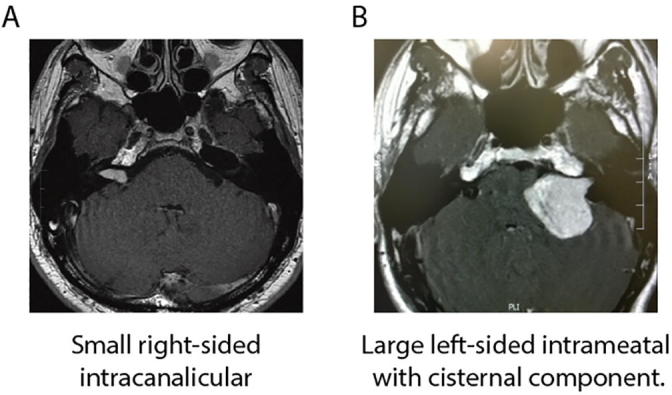
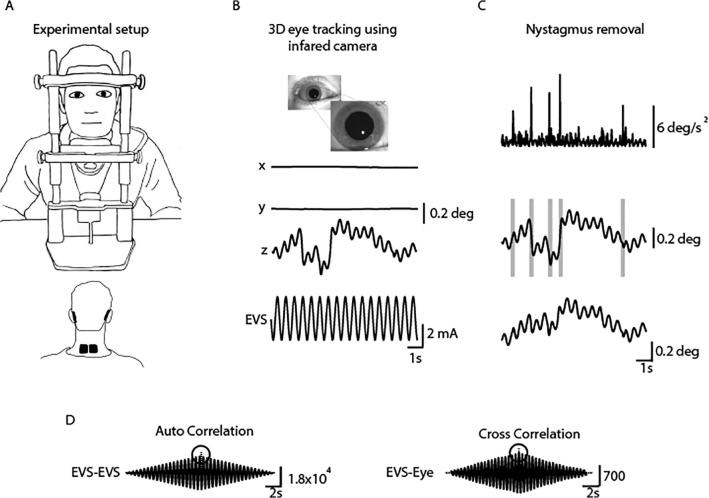
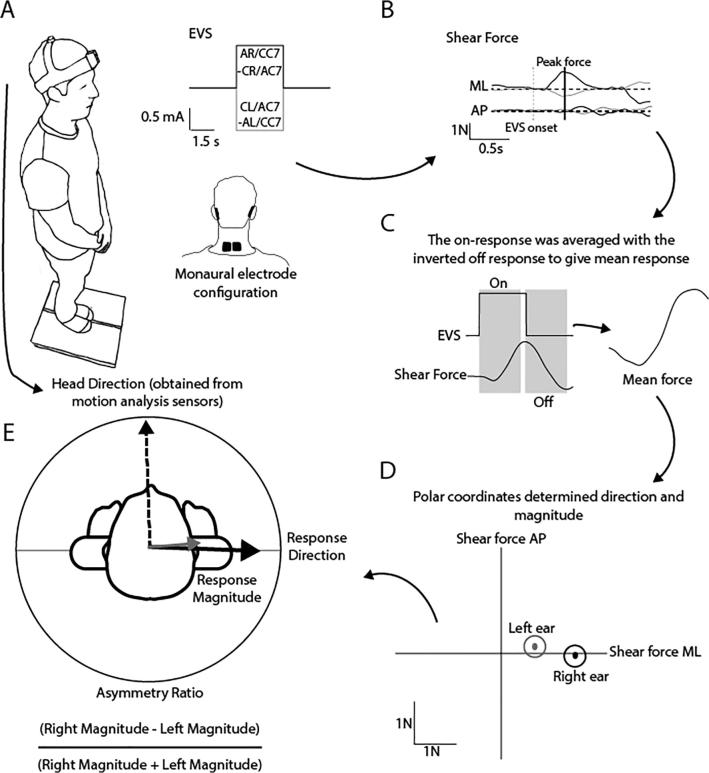
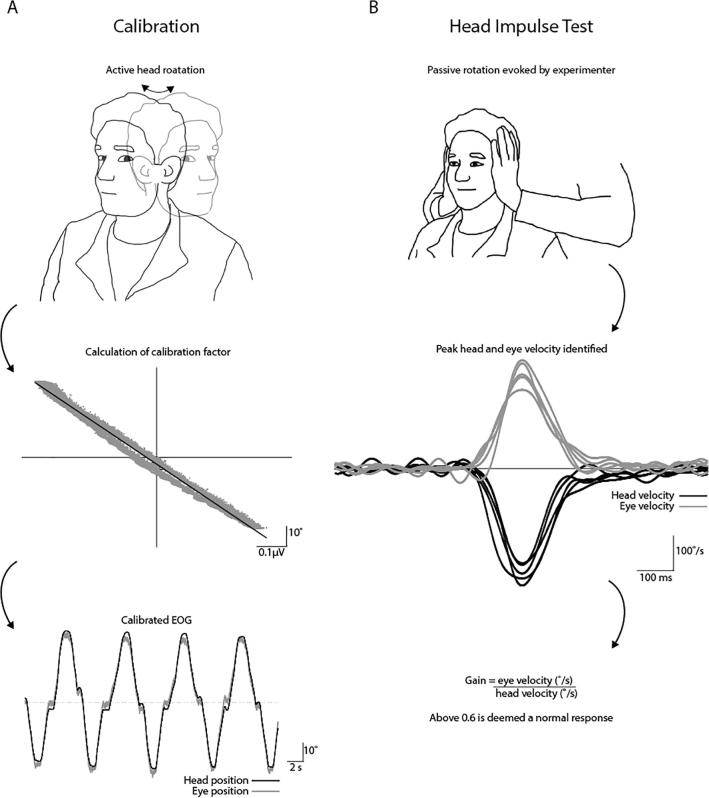
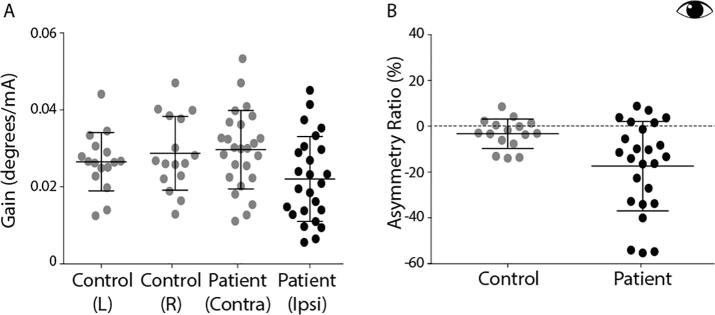
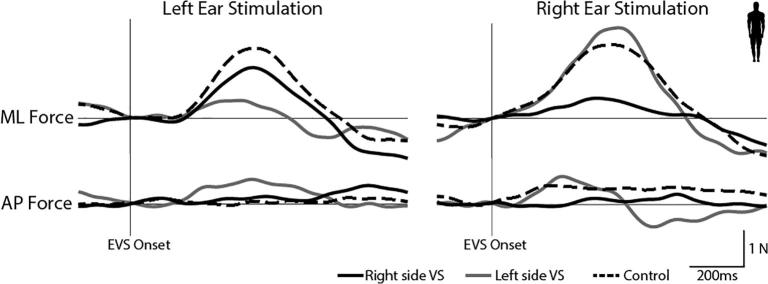
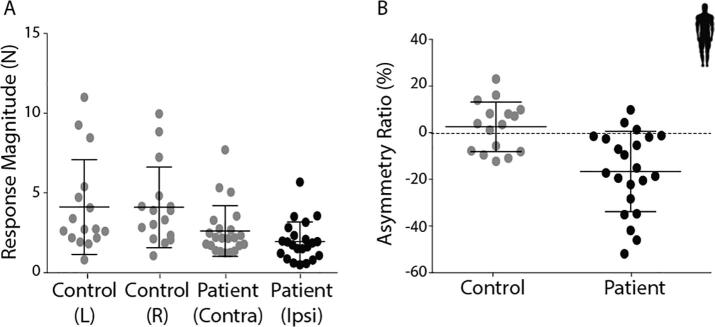
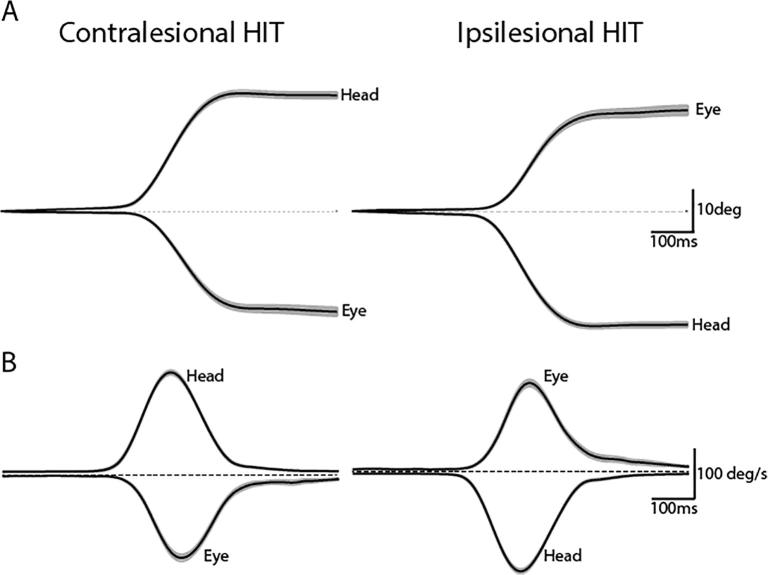
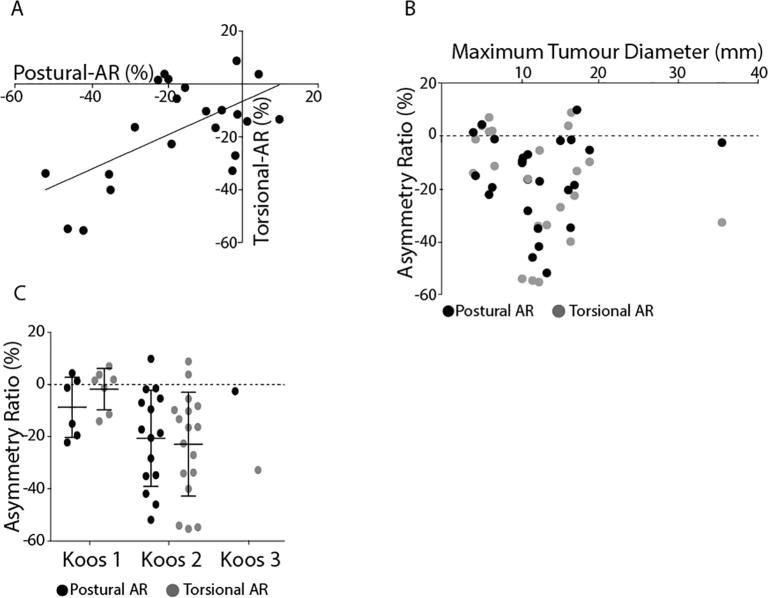
Methods: Ocular torsion responses to monaural sinusoidal EVS currents (±2 mA, 2 Hz) were measured in 25 patients with tumours ranging in size from Koos grade 1-3. For comparative purposes we also measured postural sway response to EVS, and additionally assessed vestibular function with the lateral Head Impulse Test (HIT). Patient responses were compared to age-matched healthy control subjects.

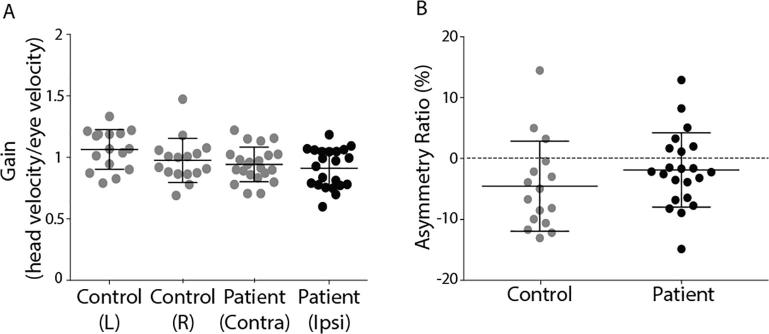
Results: Patients exhibited smaller ocular responses to ipsilesional versus contralesional EVS, and showed a larger asymmetry ratio (AR) than control subjects (19.4 vs. 3.3%, p < 0.05). EVS-evoked sway responses were also smaller in ipsilesional ear, but exhibited slightly more variability than the eye movement response, along with marginally lower discriminatory power (patients vs. controls: AR = 16.6 vs 2.6%, p < 0.05). The HIT test exhibited no significant difference between groups.

Conclusions: These results demonstrate significant deficits in the ocular torsion response to EVS in VS patients.

Significance: The fast, convenient and non-invasive nature of the test are well suited to clinical use.

Keywords: Asymmetry ratio; Electrical vestibular stimulation; Head impulse test; Vestibular schwannoma.


Figures

Fig. 1
Fig. 1
MRI scan of vestibular schwannoma. (A) A patient with a small right-sided intracanalicular tumour. (B) A patient with a large left-sided intrameatal tumour with a cisternal component.
Fig. 2
Fig. 2
Analysis of EVS-evoked ocular responses. Adapted from Mackenzie and Reynolds (2018b). (A) Subjects sat in darkness with the head fixed during 10 s EVS stimuli (2 Hz, ±2 mA), delivered in a monaural configuration. (B) 3D eye movements were recorded using an infrared camera and then tracked off-line. (C) An eye acceleration threshold was used to detect fast phase movements which were then removed using a compensatory inverse nystagmus algorithm. (D) Response gain was determined by the ration of the peak EVE-eye cross correlation to the peak EVE-EVS auto correlation.
Fig. 3
Fig. 3
EVS-evoked postural sway experimental setup. (A) Participants stood on a force platform while receiving monaural EVS stimuli. (B) Ground-reaction forces were used to determine response direction and magnitude. For the left ear, anodal responses were inverted and cathodal for the right. (C) The EVS off response was inverted and averaged with the on response. (D) and (E) The magnitude and direction (atan Fx/Fy) of the peak force vector within this time window was measured from a participant average. An asymmetry ratio was calculated using the left and right ear response magnitudes.
Fig. 4
Fig. 4
Head Impulse Test. (A) EOG and head position, recorded during active yaw rotation, were plotted against each other to derive a calibration factor for EOG. (B) The experimenter performed multiple HITs towards the left and right ears. Peak velocity of the head and eye were used to calculate gain.
Fig. 5
Fig. 5
3D eye movements evoked by EVS stimulation. (A) A representative control participant. EVS induces a sensation of head roll about the naso-occipital axis. This leads to the torsional (z) eye movements being much larger than both the horizontal (x) and vertical (y) components of the eye movements. For this reason, only torsional eye movements were analysed. (B) A healthy individual (black dashed trace) shows a similar response gain when either the right or left ear is stimulated. However, the vestibular schwannoma patients show a reduced response magnitude during ipsilesional stimulation (solid black and grey traces).
Fig. 6
Fig. 6
EVS-evoked torsional eye movement response magnitudes and asymmetry ratios. (A) Response gains for control’s left and right ear stimulation and patient’s contralesional ear (grey) and patients ipsilesional ear (black). (B) Asymmetry ratio for controls (grey) and patients (black). Mean and SD presented.
Fig. 7
Fig. 7
EVS-evoked sway response. EVS during a head forward (0°) orientation produces a compensatory sway response as shown by a force increase in the ML force. A healthy individual (black dashed trace) shows a similar response magnitude when either the right or left ear is stimulated. However, the vestibular schwannoma patients show a reduced response magnitude during ipsilesional stimulation (solid black and grey traces).
Fig. 8
Fig. 8
EVS-evoked postural response magnitudes and asymmetry ratios. (A) Response magnitude for controls left and right ear stimulation and patients contralesional ear (grey) and patient ipsilesional ear stimulation (black). (B) Asymmetry ratio for controls (grey) and patients (black). Mean and SD presented.
Fig. 9
Fig. 9
EVS-evoked postural response direction. (A) Controls produced a mean force response (solid arrows) directed 90° to head orientation (dashed arrow) for both left (grey) and right (black) ear stimulation. (B) Patients produced the same response direction as controls for both contralesional (grey) and ipsilesional (black) stimulation. Anode-left and cathode-right trials have been flipped in direction to match anode-right and cathode-left.
Fig. 10
Fig. 10
HIT amplitude and velocity. (A) Mean amplitudes of 28 and 27° rotation were achieved for contralesional and ipsilesional HITs respectively. (B) Mean velocities of 197 and 200°/s were produced during contralesional and ipsilesional HITs respectively. These values are all within the range of a successful HIT. Mean (black trace) and 95% confidence limits (grey shaded region) are presented.
Fig. 11
Fig. 11
HIT Response gains and asymmetry ratios. (A) HITs in healthy (towards left or right ear) and VS patients (contralesional or ipsilesional) resulted in response gains of ∼1. (B) Asymmetry ratios. Mean and SD are presented, along with individual subject data.
Fig. 12
Fig. 12
Experimental comparisons. (A) Both posture and eye movement tests produced similar asymmetry ratios, resulting in a significant positive correlation. (B) Neither postural nor eye movement asymmetry ratios showed any correlation with tumour diameter. (C) Patients were grouped according to Koos classification (measure of tumour size). Postural asymmetry ratios did not differ between classifications, whereas torsional evoked asymmetry ratios showed a significant increase from Koos grade 1–2.

Similar articles

Cited by

References

    1. Aw S.T., Aw G.E., Todd M.J., Halmagyi G.M. Enhanced vestibulo-ocular reflex to electrical vestibular stimulation in Meniere's disease. J Assoc Res Otolaryngol. 2013;14:49–59. - PMC - PubMed
    1. Aw S.T., Todd M.J., Aw G.E., Weber K.P., Halmagyi G.M. Gentamicin vestibulotoxicity impairs human electrically evoked vestibulo-ocular reflex. Neurology. 2008;71:1776–1782. - PubMed
    1. Aw S.T., Todd M.J., Lehnen N., Aw G.E., Weber K.P., Eggert T. Electrical vestibular stimulation after vestibular deafferentation and in vestibular schwannoma. PloS One. 2013;8:e82078. - PMC - PubMed
    1. Baldissera F., Cavallari P., Craighero L., Fadiga L. Modulation of spinal excitability during observation of hand actions in humans. Eur J Neurosci. 2001;13:190–194. - PubMed
    1. Clemis J.D., Ballad W.J., Baggot P.J., Lyon S.T. Relative frequency of inferior vestibular schwannoma. Arc Otolaryngol Head Neck Surg. 1986;112:190–194. - PubMed

Publication types