

Comparative transcriptome analysis of the wild-type model apomict Hieracium praealtum and its loss of parthenogenesis (lop) mutant
- PMID: 30249189
- PMCID: PMC6154955
- DOI: 10.1186/s12870-018-1423-1
Comparative transcriptome analysis of the wild-type model apomict Hieracium praealtum and its loss of parthenogenesis (lop) mutant
Abstract
Background: Asexual seed formation (apomixis) has been observed in diverse plant families but is rare in crop plants. The generation of apomictic crops would revolutionize agriculture, as clonal seed production provides a low cost and efficient way to produce hybrid seed. Hieracium (Asteraceae) is a model system for studying the molecular components of gametophytic apomixis (asexual seed reproduction).
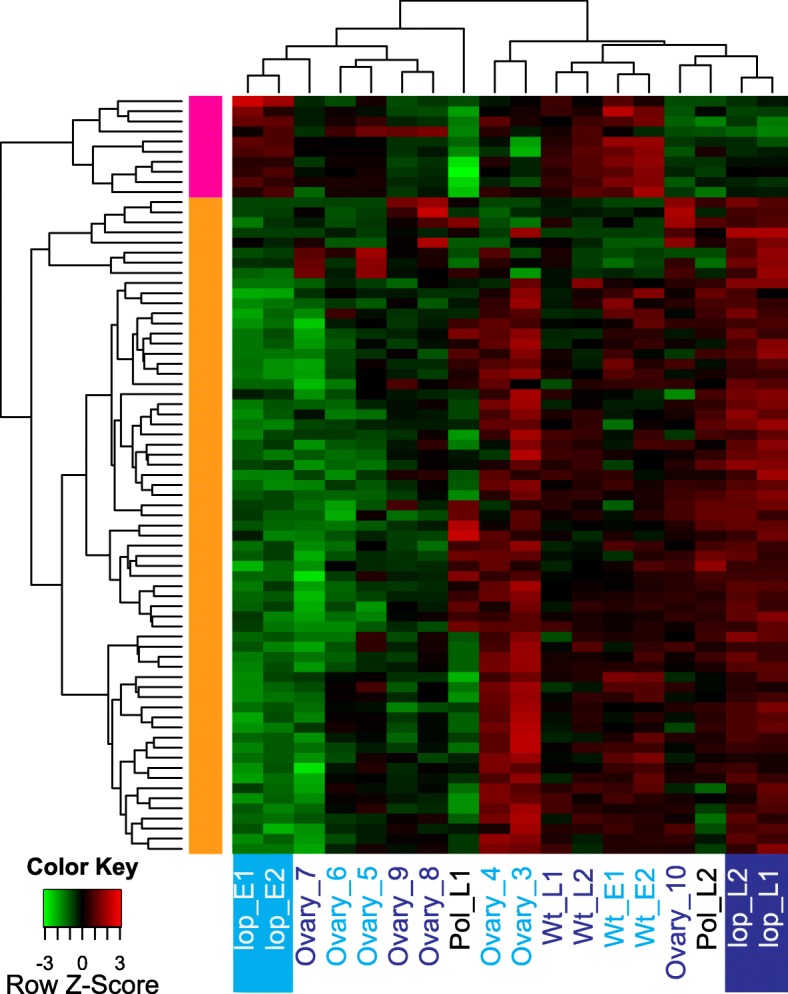
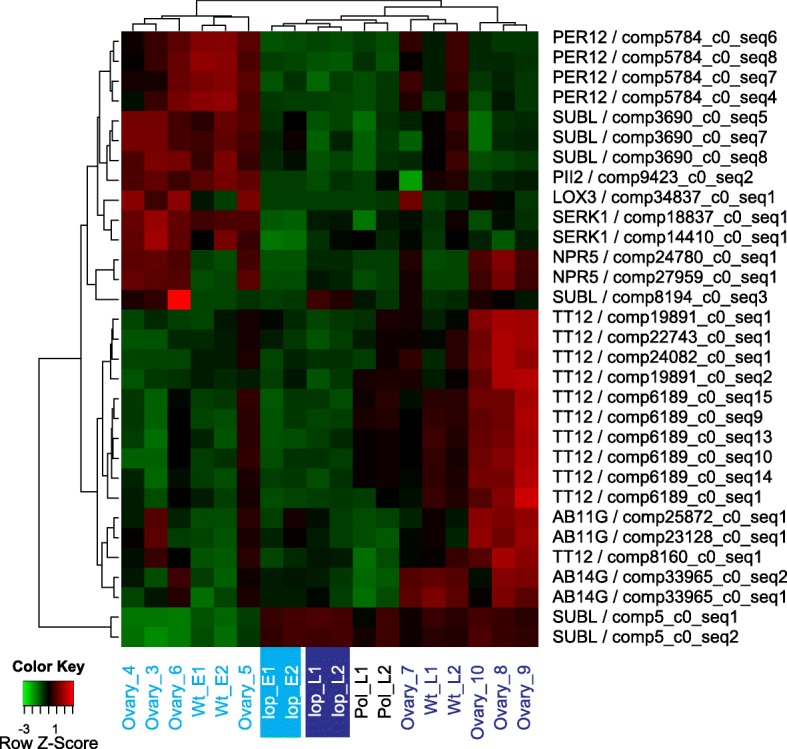
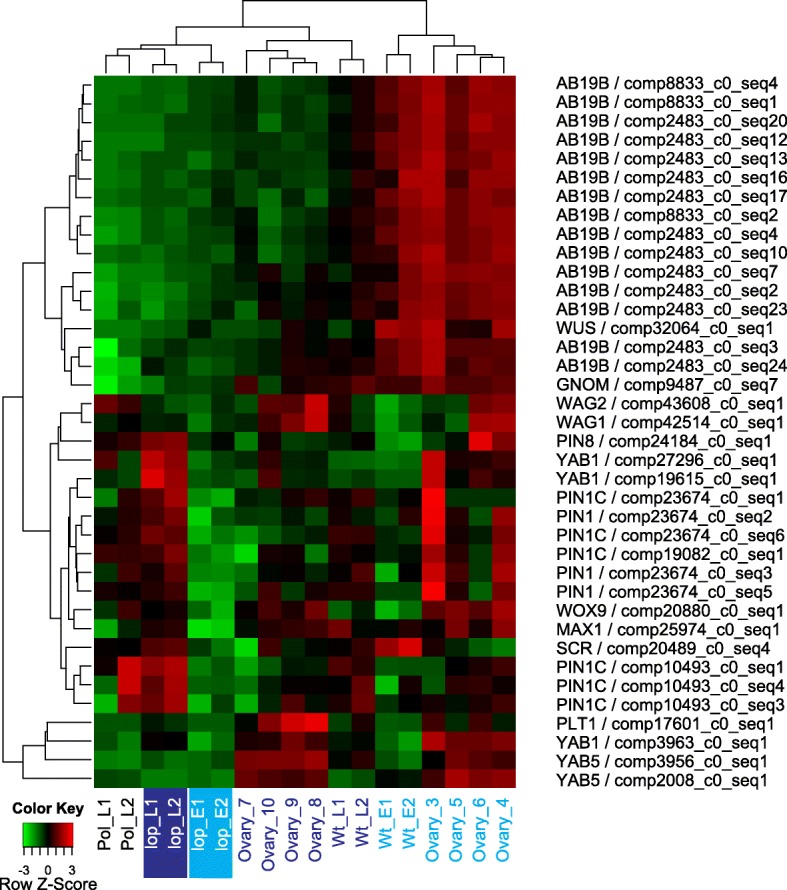
Results: In this study, a reference transcriptome was produced from apomictic Hieracium undergoing the key apomictic events of apomeiosis, parthenogenesis and autonomous endosperm development. In addition, transcriptome sequences from pre-pollination and post-pollination stages were generated from a loss of parthenogenesis (lop) mutant accession that exhibits loss of parthenogenesis and autonomous endosperm development. The transcriptome is composed of 147,632 contigs, 50% of which were annotated with orthologous genes and their probable function. The transcriptome was used to identify transcripts differentially expressed during apomictic and pollination dependent (lop) seed development. Gene Ontology enrichment analysis of differentially expressed transcripts showed that an important difference between apomictic and pollination dependent seed development was the expression of genes relating to epigenetic gene regulation. Genes that mark key developmental stages, i.e. aposporous embryo sac development and seed development, were also identified through their enhanced expression at those stages.
Conclusion: The production of a comprehensive floral reference transcriptome for Hieracium provides a valuable resource for research into the molecular basis of apomixis and the identification of the genes underlying the LOP locus.
Keywords: Apomixis; Asexual; Hieracium; Parthenogenesis; RNA sequencing; Transcriptome.
Conflict of interest statement
Ethics approval and consent to participate
Not applicable.
Consent for publication
Not applicable.
Competing interests
The authors declare that they have no competing interests.
Publisher’s Note
Springer Nature remains neutral with regard to jurisdictional claims in published maps and institutional affiliations.
Figures


Similar articles
-
A reference genetic linkage map of apomictic Hieracium species based on expressed markers derived from developing ovule transcripts.Ann Bot. 2015 Mar;115(4):567-80. doi: 10.1093/aob/mcu249. Epub 2014 Dec 22. Ann Bot. 2015. PMID: 25538115 Free PMC article.
-
Genetic separation of autonomous endosperm formation (AutE) from the two other components of apomixis in Hieracium.Plant Reprod. 2013 Jun;26(2):113-23. doi: 10.1007/s00497-013-0214-y. Epub 2013 Mar 8. Plant Reprod. 2013. PMID: 23471494
-
Evolution of apomixis loci in Pilosella and Hieracium (Asteraceae) inferred from the conservation of apomixis-linked markers in natural and experimental populations.Heredity (Edinb). 2015 Jan;114(1):17-26. doi: 10.1038/hdy.2014.61. Epub 2014 Jul 16. Heredity (Edinb). 2015. PMID: 25026970 Free PMC article.
-
Clonal Reproduction through Seeds in Sight for Crops.Trends Genet. 2020 Mar;36(3):215-226. doi: 10.1016/j.tig.2019.12.006. Epub 2020 Jan 20. Trends Genet. 2020. PMID: 31973878 Review.
-
Apomixis in hawkweed: Mendel's experimental nemesis.J Exp Bot. 2011 Mar;62(5):1699-707. doi: 10.1093/jxb/err011. Epub 2011 Feb 18. J Exp Bot. 2011. PMID: 21335438 Review.
Cited by
-
Genes Modulating the Increase in Sexuality in the Facultative Diplosporous Grass Eragrostis curvula under Water Stress Conditions.Genes (Basel). 2020 Aug 21;11(9):969. doi: 10.3390/genes11090969. Genes (Basel). 2020. PMID: 32825586 Free PMC article.
-
Genetic mapping of the LOSS OF PARTHENOGENESIS locus in Pilosella piloselloides and the evolution of apomixis in the Lactuceae.Front Plant Sci. 2023 Aug 25;14:1239191. doi: 10.3389/fpls.2023.1239191. eCollection 2023. Front Plant Sci. 2023. PMID: 37692427 Free PMC article.
-
Phenotypic plasticity of aposporous embryo sac development in Hieracium praealtum.Plant Signal Behav. 2019;14(8):1622981. doi: 10.1080/15592324.2019.1622981. Epub 2019 Jun 4. Plant Signal Behav. 2019. PMID: 31161899 Free PMC article.
-
Controlling Apomixis: Shared Features and Distinct Characteristics of Gene Regulation.Genes (Basel). 2020 Mar 20;11(3):329. doi: 10.3390/genes11030329. Genes (Basel). 2020. PMID: 32245021 Free PMC article. Review.
-
Efficient CRISPR/Cas9-Mediated Knockout of an Endogenous PHYTOENE DESATURASE Gene in T1 Progeny of Apomictic Hieracium Enables New Strategies for Apomixis Gene Identification.Genes (Basel). 2020 Sep 10;11(9):1064. doi: 10.3390/genes11091064. Genes (Basel). 2020. PMID: 32927657 Free PMC article.
References
-
- Nogler G. A. Embryology of Angiosperms. Berlin, Heidelberg: Springer Berlin Heidelberg; 1984. Gametophytic Apomixis; pp. 475–518.
-
- Roche D, Cong P, Chen Z, Hanna WW, Gustine DL, Sherwood RT, Ozias-Akins P. Short communication: an apospory-specific genomic region is conserved between Buffelgrass (Cenchrus ciliaris L.) and Pennisetum squamulatum Fresen. Plant J. 1999;19(2):203–208. doi: 10.1046/j.1365-313X.1999.00514.x. - DOI - PubMed
-
- Pessino SC, Ortiz JPA, Leblanc O, do Valle CB, Evans C, Hayward MD. Identification of a maize linkage group related to apomixis in Brachiaria. Theor Appl Genet. 1997;94(3):439–444. doi: 10.1007/s001220050434. - DOI
Publication types
MeSH terms
Substances
Grants and funding
LinkOut - more resources
Full Text Sources
Other Literature Sources
