. 2018 Sep 25;15(1):27.
doi: 10.1186/s12987-018-0111-8.

Cerebral influx of Na+ and Cl- as the osmotherapy-mediated rebound response in rats

Affiliations

Cerebral influx of Na+ and Cl- as the osmotherapy-mediated rebound response in rats

Eva Kjer Oernbo et al. Fluids Barriers CNS. .

Abstract

Background: Cerebral edema can cause life-threatening increase in intracranial pressure. Besides surgical craniectomy performed in severe cases, osmotherapy may be employed to lower the intracranial pressure by osmotic extraction of cerebral fluid upon intravenous infusion of mannitol or NaCl. A so-called rebound effect can, however, hinder continuous reduction in cerebral fluid by yet unresolved mechanisms.

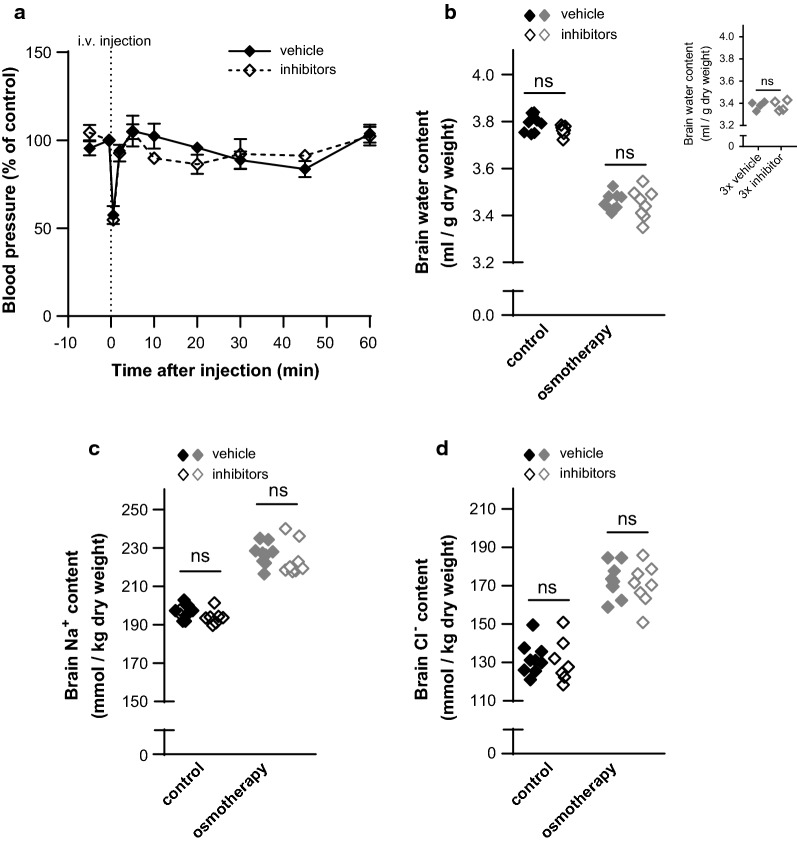
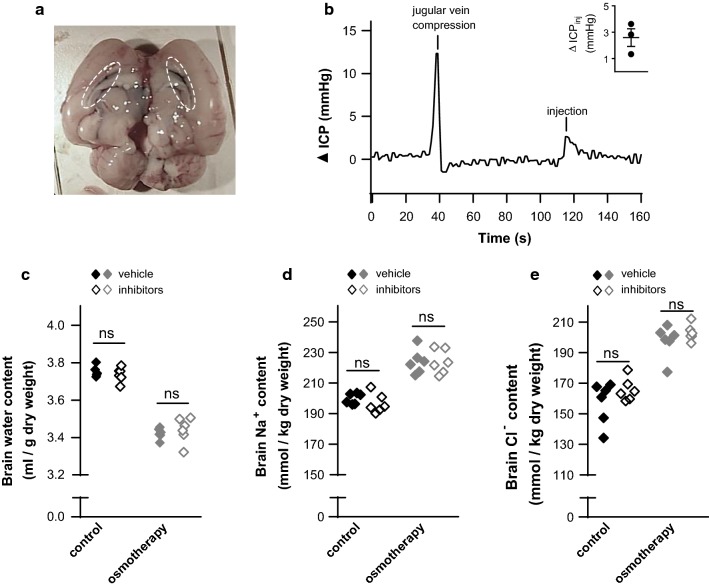
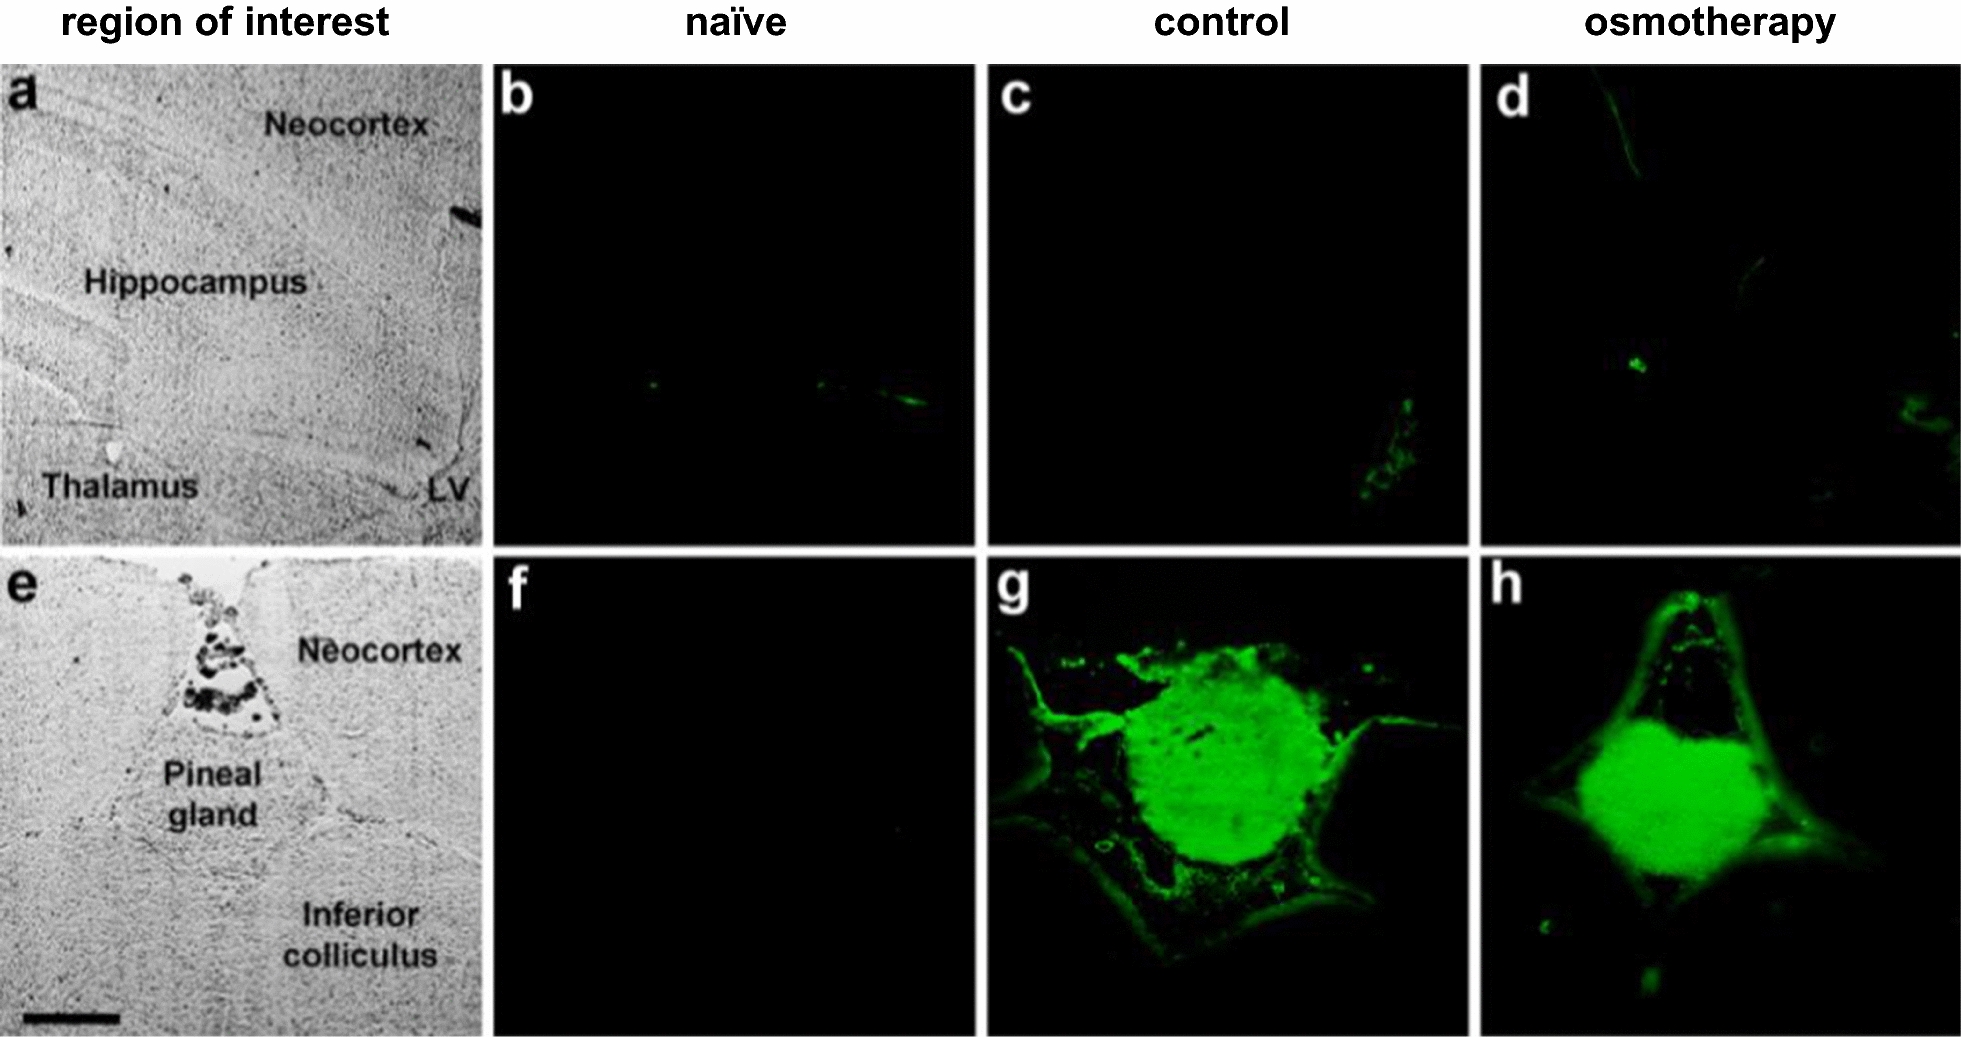
Methods: We determined the brain water and electrolyte content in healthy rats treated with osmotherapy. Osmotherapy (elevated plasma osmolarity) was mediated by intraperitoneal injection of NaCl or mannitol with inclusion of pharmacological inhibitors of selected ion-transporters present at the capillary lumen or choroidal membranes. Brain barrier integrity was determined by fluorescence detection following intravenous delivery of Na+-fluorescein.

Results: NaCl was slightly more efficient than mannitol as an osmotic agent. The brain water loss was only ~ 60% of that predicted from ideal osmotic behavior, which could be accounted for by cerebral Na+ and Cl- accumulation. This electrolyte accumulation represented the majority of the rebound response, which was unaffected by the employed pharmacological agents. The brain barriers remained intact during the elevated plasma osmolarity.

Conclusions: A brain volume regulatory response occurs during osmotherapy, leading to the rebound response. This response involves brain accumulation of Na+ and Cl- and takes place by unresolved molecular mechanisms that do not include the common ion-transporting mechanisms located in the capillary endothelium at the blood-brain barrier and in the choroid plexus epithelium at the blood-CSF barrier. Future identification of these ion-transporting routes could provide a pharmacological target to prevent the rebound effect associated with the widely used osmotherapy.

Keywords: Brain barriers; Brain edema; Ion-transporting mechanisms; Osmotherapy; Rebound effect.


Figures

Fig. 1
Fig. 1
Plasma electrolyte concentrations in response to NaCl osmotherapy (elevated plasma osmolarity). A functional nephrectomy was performed in rats prior to i.p. treatment with isosmolar NaCl (control) or hyperosmolar NaCl (osmotherapy) and compared to non-operated naïve rats. a Plasma creatinine concentrations (in mM) in naïve rats (0.018 ± 0.001, n = 3), control rats (0.061 ± 0.002, n = 9), and osmotherapy-treated rats (0.063 ± 0.001, n = 9). b Plasma urea concentrations (in mM) in naïve rats (4.7 ± 0.2, n = 3), control rats (9.1 ± 0.3, n = 9), and rats exposed to osmotherapy (9.7 ± 0.5, n = 9). c Plasma osmolarity (in mOsm) of naïve rats (n = 3), control rats (n = 9), and rats exposed to osmotherapy (n = 9). d, e The plasma electrolyte concentrations (in mM) in naïve rats (135.6 ± 0.5 Na+ and 109.0 ± 0.6 Cl, n = 3), control rats (130.0 ± 0.6 Na+ and 105.6 ± 0.7 Cl, n = 9) and rats exposed to osmotherapy (156.5 ± 0.5 Na+ and 140.7 ± 0.8 Cl, n = 9). Statistically significant differences were determined by a one-way ANOVA with Dunnett’s multiple comparisons post hoc test in a, b and Tukey’s multiple comparisons post hoc test in ce. Asterisk above the scatter plots indicates statistical significance compared to naïve rats (a, b) or control rats (ce). ***p < 0.001, ns not significant
Fig. 2
Fig. 2
Osmotherapy-induced brain water loss and electrolyte gain. Rats were treated with isosmolar NaCl (control), hyperosmolar NaCl (osmotherapy, denoted NaCl in legend), or mannitol. a The brain water content (in ml/g dry weight) in naïve (n = 3) and control (n = 9) rats, and in rats exposed to osmotherapy in the form of NaCl (n = 9) or mannitol (n = 6). The theoretical brain water loss assuming ideal osmotic behavior (to 3.24 ml/g dry weight, calculated by Eq. 1) is illustrated as a dashed red line. b, c The brain electrolyte content (in mmol/kg dry weight) shown for naïve rats (197 ± 4 Na+ and 141 ± 2 Cl, n = 3), control rats (197 ± 1 Na+ and 132 ± 3 Cl, n = 9), and rats exposed to NaCl-mediated osmotherapy (227 ± 2 Na+ and 173 ± 3 Cl, n = 9) or mannitol-mediated osmotherapy (209 ± 1 Na+ and 182 ± 3 Cl, n = 6). d, e Plasma electrolyte concentrations (in mM) for rats exposed to mannitol-mediated osmotherapy (117.9 ± 0.8 Na+ and 94.9 ± 5.7 Cl, n = 6). Values from control rats and rats exposed to NaCl-mediated osmotherapy are from Fig. 1d, e and included for comparison. To determine whether means of naïve, control, and NaCl were statistically different from each other, a one-way ANOVA with Tukey’s multiple comparisons post hoc test was performed. This statistical analysis was further performed to determine differences between means of control, NaCl, and mannitol groups [note; comparison of mannitol (no vehicle treatment) with either of the experimental NaCl groups (i.v. or intraventricular vehicle) provided similar results]. Asterisk above the scatter plot indicates statistical significance compared to control rats and asterisk within the lines indicates statistical significance between the indicated groups. *p < 0.05, ***p < 0.001
Fig. 3
Fig. 3
Inhibitors of ion-transporting mechanisms at the blood-side membranes do not affect water loss and electrolyte gain. a The arterial blood pressure was measured before and until 1 h after i.v. treatment with vehicle or inhibitors (10 mg/kg bumetanide, 6 mg/kg amiloride, and 20 mg/kg methazolamide). Values are given as the percentage of arterial blood pressure from the last control measurement (corresponding to 30 s before i.v. injection). The arterial blood pressure did not differ significantly from control measurements after 1 h (p > 0.90). The end arterial blood pressure was unchanged following inhibitor delivery, n = 3 of each, p > 0.90. b The brain water content was unaffected by i.v. inhibitor application in control rats [in (ml/g dry weight): vehicle: 3.79 ± 0.01 vs. inhibitors: 3.76 ± 0.01] and in rats subjected to NaCl-mediated osmotherapy (vehicle: 3.46 ± 0.01 vs. inhibitors: 3.45 ± 0.02), n = 7–9. Inset: Brain water content in osmotherapy-treated rats exposed to triple doses of vehicle (3.38 ± 0.02) or inhibitors (3.38 ± 0.02), n = 4 of each. c The brain Na+ content (in mmol/kg dry weight) in control rats (vehicle: 197 ± 1 vs. inhibitors: 194 ± 1) and in rats exposed to osmotherapy (vehicle: 227 ± 2 vs. inhibitors: 224 ± 3), n = 7–9. d The brain Cl content (in mmol/kg dry weight) in control rats (vehicle: 132 ± 3 vs. inhibitors: 131 ± 4) and in rats exposed to osmotherapy (vehicle: 173 ± 3 vs. inhibitors: 170 ± 4), n = 7–9. Vehicle values from control and osmotherapy-treated rats are from Fig. 2a–c and included for comparison. Statistically significant differences were determined by a two-way ANOVA with Tukey’s multiple comparisons post hoc test, except for values in the inset of b, which were analyzed using a two-tailed un-paired Student’s t-test. ns not significant
Fig. 4
Fig. 4
Inhibition of choroidal ion-transporting mechanisms does not affect brain water loss or electrolyte gain. a Representative image of brain hemispheres following Evans blue injection into the right lateral ventricle (stained lateral ventricles highlighted in dashed ovals), n = 3. b A representative epidural ICP trace with jugular vein compression included as a positive control. The inset shows mean ∆ICP ± SEM (mmHg) during intraventricular injection, n = 3. c Brain water content (in ml/g dry weight) of rats treated with intraventricular injections of vehicle or inhibitors prior to i.p. administration of isosmolar NaCl (control; vehicle: 3.75 ± 0.01 vs. inhibitors: 3.74 ± 0.02) or hyperosmolar NaCl (osmotherapy; vehicle: 3.42 ± 0.01 vs. inhibitors: 3.44 ± 0.03), n = 6 of each. d The brain Na+ content (in mmol/kg dry weight) in control rats treated with vehicle (200 ± 1) or inhibitors (197 ± 3) and in osmotherapy-treated rats exposed to vehicle (224 ± 3) or inhibitors (224 ± 3), n = 6 of each. e The brain Cl content (in mmol/kg dry weight) in control rats treated with vehicle (162 ± 3) or inhibitors (166 ± 3) and in osmotherapy-treated rats exposed to vehicle (198 ± 4) or inhibitors (203 ± 2), n = 6 of each. Statistical significant differences were determined by a two-way ANOVA with Tukey’s multiple comparisons post hoc test. ns not significant
Fig. 5
Fig. 5
Osmotherapy does not alter the brain barrier permeability. Na+-fluorescein (green fluorescence) was injected into the blood circulation of rats prior to i.p. exposure of isosmolar NaCl (control) or hyperosmolar NaCl (osmotherapy). Naïve rats did not receive Na+-fluorescein and were euthanized immediately after anaesthesia induction. a, e Phase contrast images illustrate structures of the brain regions of interest in transmitted white light. Representative images of Na+-fluorescein in bd hippocampus, thalamus, neocortex, and the lateral ventricle (LV) and fh pineal gland (positive control) of naïve rats, control rats, and osmotherapy-treated rats, n = 3. Scale bar = 500 μm

Similar articles

Cited by

References

    1. Ropper AH. Management of raised intracranial pressure and hyperosmolar therapy. Pract Neurol. 2014;14:152–158. doi: 10.1136/practneurol-2014-000811. - DOI - PubMed
    1. Ucar T, Akyuz M, Kazan S, Tuncer R. Role of decompressive surgery in the management of severe head injuries: prognostic factors and patient selection. J Neurotrauma. 2005;22:1311–1318. doi: 10.1089/neu.2005.22.1311. - DOI - PubMed
    1. McManus ML, Churchwell KB, Strange K. Regulation of cell volume in health and disease. N Engl J Med. 1995;333:1260–1266. doi: 10.1056/NEJM199511093331906. - DOI - PubMed
    1. Todd MM. Hyperosmolar therapy and the brain: a hundred years of hard-earned lessons. Anesthesiology. 2013;118:777–779. doi: 10.1097/ALN.0b013e3182815980. - DOI - PubMed
    1. Paczynski RP. Osmotherapy. Basic concepts and controversies. Crit Care Clin. 1997;13:105–129. doi: 10.1016/S0749-0704(05)70298-0. - DOI - PubMed

LinkOut - more resources