

Patterns of seasonal influenza activity in U.S. core-based statistical areas, described using prescriptions of oseltamivir in Medicare claims data
- PMID: 30249390
- PMCID: PMC6519085
- DOI: 10.1016/j.epidem.2018.08.002
Patterns of seasonal influenza activity in U.S. core-based statistical areas, described using prescriptions of oseltamivir in Medicare claims data
Abstract
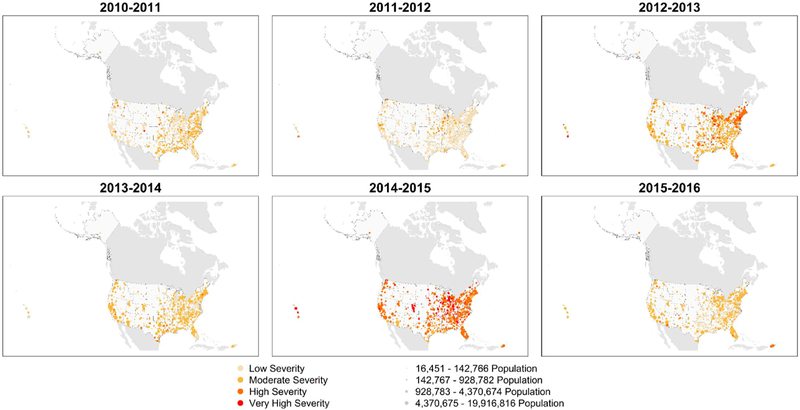
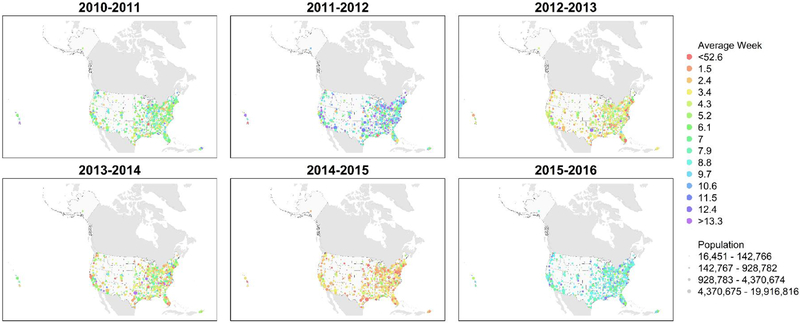
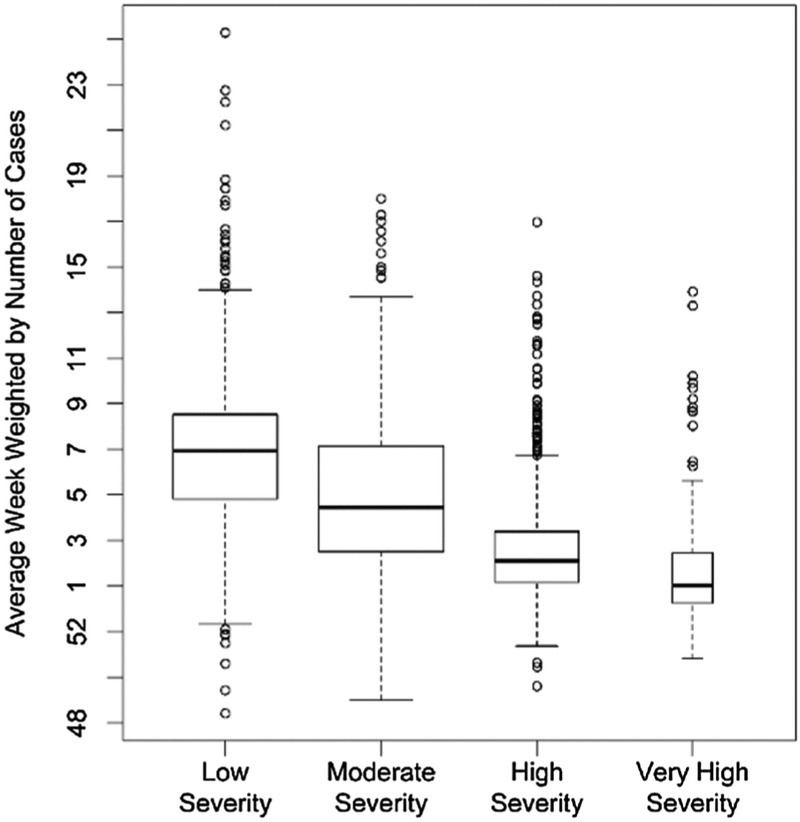
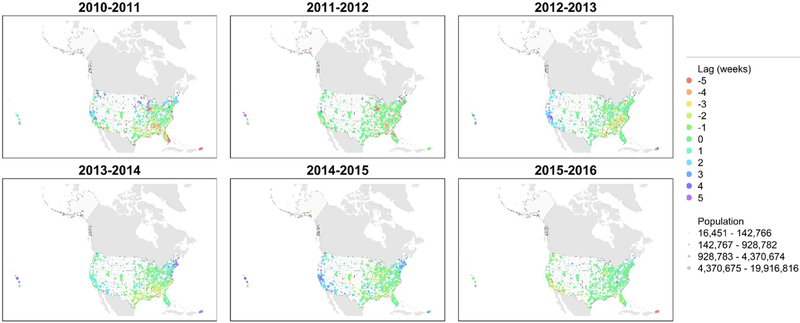
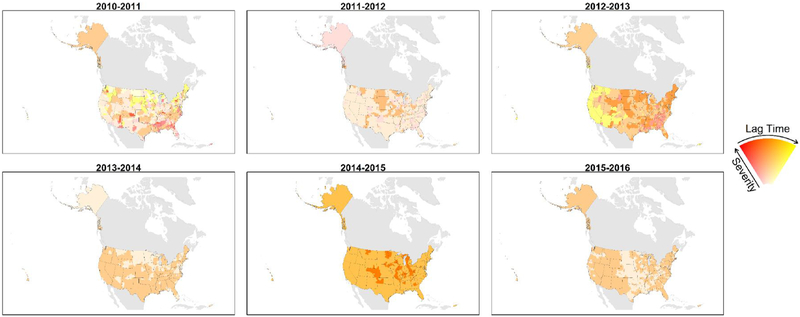
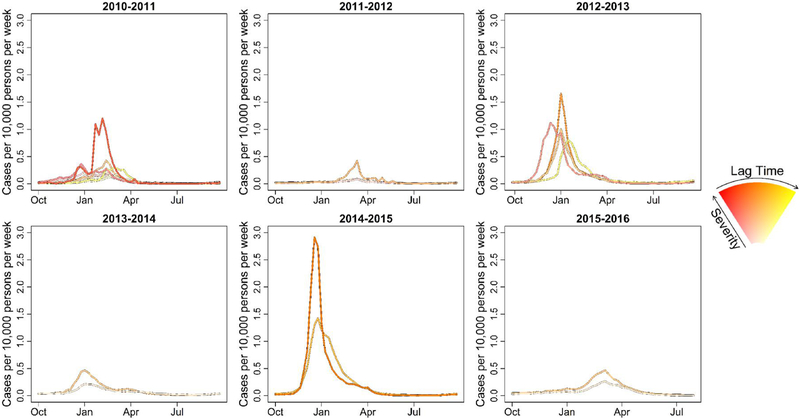
Using Medicare claims data on prescriptions of oseltamivir dispensed to people 65 years old and older, we present a descriptive analysis of patterns of influenza activity in the United States for 579 core-based statistical areas (CBSAs) from the 2010-2011 through the 2015-2016 influenza seasons. During this time, 1,010,819 beneficiaries received a prescription of oseltamivir, ranging from 45,888 in 2011-2012 to 380,745 in 2014-2015. For each season, the peak weekly number of prescriptions correlated with the total number of prescriptions (Pearson's r ≥ 0.88). The variance in peak timing decreased with increasing severity (p < 0.0001). Among these 579 CBSAs, neither peak timing, nor relative timing, nor severity of influenza seasons showed evidence of spatial autocorrelation (0.02 ≤ Moran's I ≤ 0.23). After aggregating data to the state level, agreement between the seasonal severity at the CBSA level and the state level was fair (median Cohen's weighted κ = 0.32, interquartile range = 0.26-0.39). Based on seasonal severity, relative timing, and geographic place, we used hierarchical agglomerative clustering to join CBSAs into influenza zones for each season. Seasonal maps of influenza zones showed no obvious patterns that might assist in predicting influenza zones for future seasons. Because of the large number of prescriptions, these data may be especially useful for characterizing influenza activity and geographic distribution during low severity seasons, when other data sources measuring influenza activity are likely to be sparse.
Keywords: Antivirals; Influenza; Medicare.
Published by Elsevier B.V.
Figures
References
-
- Appiah GD, Blanton L, D’Mello T, Kniss K, Smith S, Mustaquim D, Steffens C, Dhara R, Cohen J, Chaves SS, Bresee J, Wallis T, Xu X, Abd Elal AI, Gubareva L, Wentworth DE, Katz J, Jernigan D, Brammer L, Centers for Disease Control and Prevention, 2015. Influenza activity – United States, 2014–15 season and composition of the 2015–16 influenza vaccine. MMWR Morb. Mortal Wkly. Rep. 64, 583–590. - PMC - PubMed
-
- Arizona Department of Health Services, 2016. Arizona – Influenza Summary Week 12 (3/30/2016 – 3/26/2016 Season (10/4/2015-10/12016). http://www.azdhs.gov/documents/preparedness/epidemiology-disease-control....
-
- Bangert M, Gil H, Oliva J, Delgado C, Vega T, S DEM, Larrauri A, Epidemiology Working Group of the Spanish Influenza Sentinel Surveillance System, 2017. Pilot study to harmonize the reported influenza intensity levels within the Spanish influenza sentinel surveillance system (SISSS) using the moving epidemic method (MEM). Epidemiol. Infect. 145, 715–722. 10.1017/S0950268816002727. - DOI - PMC - PubMed
-
- Biggerstaff M, Kniss K, Jernigan D, Brammer L, Bresee J, Garg S, Burns E, Reed C, 2017. Systematic assessment of multiple routine and near-real time indicators to classify the severity of influenza seasons and pandemics in the United States, 2003–04 through 2015–2016. Am. J. Epidemiol. 187 (5), 1040–1050. 10.1093/aje/kwx334. - DOI - PMC - PubMed
-
- Brammer L, Kniss K, Epperson S, Blanton L, Mustaquim D, Steffens C, D’Mello T, Perez A, Dhara R, Chaves S, Elal AA, Gubareva L, Wallis T, Xu X, Villanueva J, Bresee J, Cox N, Finelli L, 2013. Influenza activity — United States, 2012–13 season and composition of the 2013–14 influenza vaccine. MMWR Morb. Mortal Wkly. Rep. 62, 473–479. - PubMed
MeSH terms
Substances
Grants and funding
LinkOut - more resources
Full Text Sources
Other Literature Sources
Medical
