. 2018 Oct 16;115(8):1589-1602.
doi: 10.1016/j.bpj.2018.08.034. Epub 2018 Sep 1.

Insights into the Cooperative Nature of ATP Hydrolysis in Actin Filaments

Affiliations

Insights into the Cooperative Nature of ATP Hydrolysis in Actin Filaments

Harshwardhan H Katkar et al. Biophys J. .

Abstract

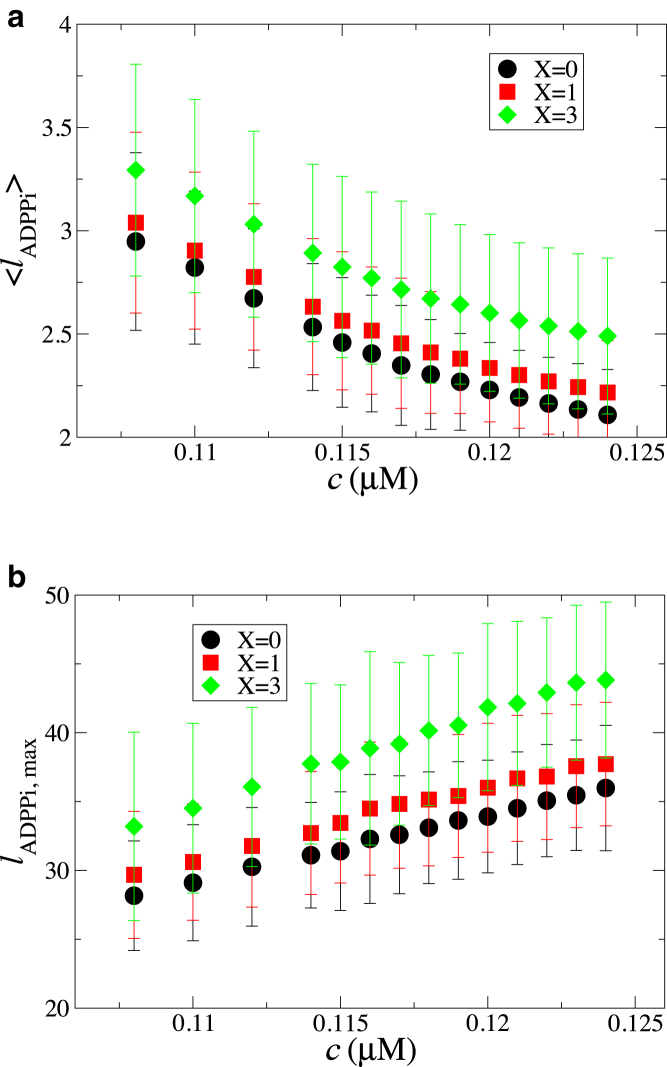
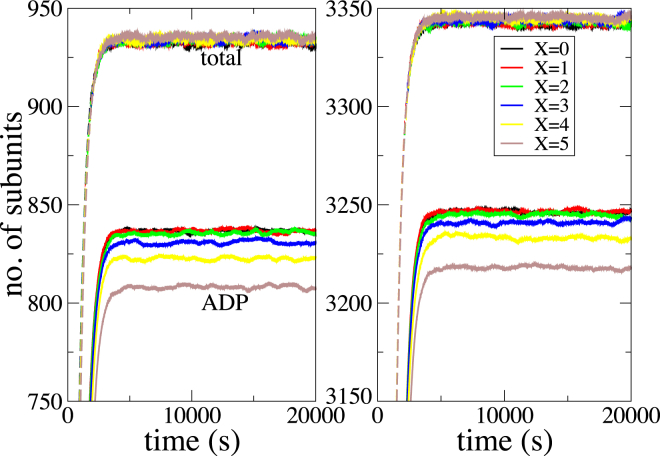
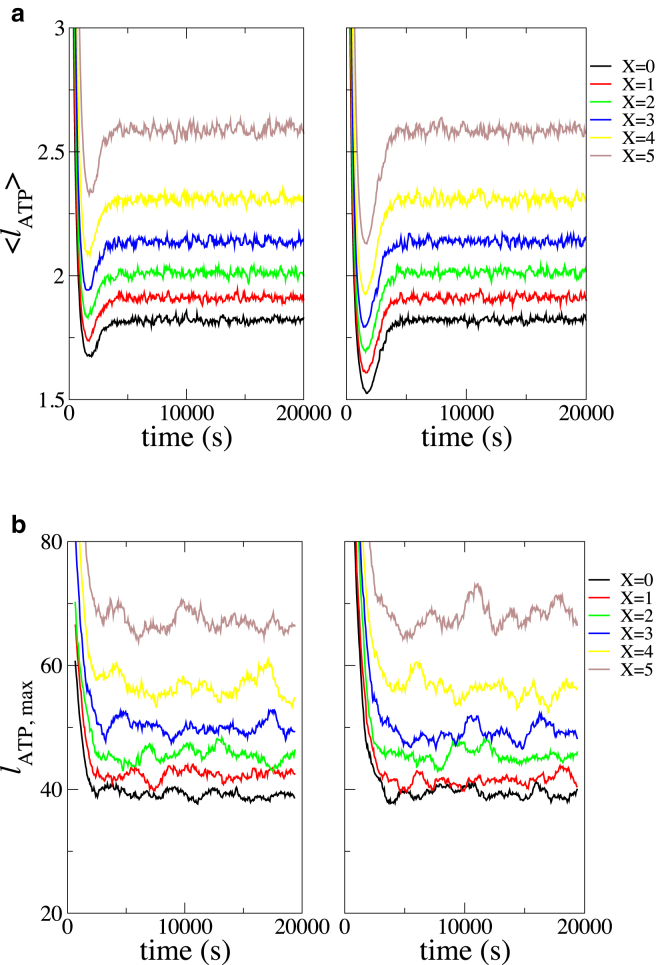
Actin filaments continually assemble and disassemble within a cell. Assembled filaments "age" as a bound nucleotide ATP within each actin subunit quickly hydrolyzes followed by a slower release of the phosphate Pi, leaving behind a bound ADP. This subtle change in nucleotide state of actin subunits affects filament rigidity as well as its interactions with binding partners. We present here a systematic multiscale ultra-coarse-graining approach that provides a computationally efficient way to simulate a long actin filament undergoing ATP hydrolysis and phosphate-release reactions while systematically taking into account available atomistic details. The slower conformational changes and their dependence on the chemical reactions are simulated with the ultra-coarse-graining model by assigning internal states to the coarse-grained sites. Each state is represented by a unique potential surface of a local heterogeneous elastic network. Internal states undergo stochastic transitions that are coupled to conformations of the underlying molecular system. The model reproduces mechanical properties of the filament and allows us to study whether conformational fluctuations in actin subunits produce cooperative filament aging. We find that the nucleotide states of neighboring subunits modulate the reaction kinetics, implying cooperativity in ATP hydrolysis and Pi release. We further systematically coarse grain the system into a Markov state model that incorporates assembly and disassembly, facilitating a direct comparison with previously published models. We find that cooperativity in ATP hydrolysis and Pi release significantly affects the filament growth dynamics only near the critical G-actin concentration, whereas far from it, both cooperative and random mechanisms show similar growth dynamics. In contrast, filament composition in terms of the bound nucleotide distribution varies significantly at all monomer concentrations studied. These results provide new insights, to our knowledge, into the cooperative nature of ATP hydrolysis and Pi release and the implications it has for actin filament properties, providing novel predictions for future experimental studies.


Figures

Figure 1
Figure 1
Schematic showing the CG mapping used in our study. The atomistic structure of ADP-Pi bound actin subunit is shown as ribbons, with the corresponding CG sites shown as beads. CG bead indices 1–12 are marked next to each CG site. Our final model has five major beads corresponding to CG sites with indices 1–5. To see this figure in color, go online.
Figure 2
Figure 2
Multibody effect in ATP hydrolysis plotted as a ratio of the conditional rate with the average rate for specific combinations of nucleotide states of neighboring subunits. Combinations of neighboring subunit states are indicated using a key on the x axis that denotes the state (0 = unhydrolyzed, 1 = hydrolyzed) of each of the neighboring subunits, starting from the third neighbor toward the pointed end to the third neighbor toward the barbed end. Error bars indicate the standard error for each data point and are smaller than the symbol size for most of the data. To see this figure in color, go online. See Fig. S5b for data corresponding to all 64 possible combinations.
Figure 3
Figure 3
Multibody effect in Pi release plotted as a ratio of the conditional rate to the average rate for specific combinations of nucleotide states of neighboring subunits. The key on the x axis is similar to that described in Fig. 2 (except for the new definitions 0 = ADP-Pi, 1 = ADP). Error bars indicate the standard error for each data point. To see this figure in color, go online. See Fig. S7 for data corresponding to all 64 possible combinations.
Figure 4
Figure 4
(a) Filament length dynamics for different strengths of multibody effect shown in different colors at concentrations below (left panel, c = 0.116 μM) and above (right panel, c = 0.120 μM) the critical concentration. (b) Filament growth rate (filled symbols) as a function of concentration of free actin is shown. Different colors represent different strengths of multibody effects. Open circles are experimental data taken from (34), originally extracted from experiments in (47). The inset shows the ratio of growth rate at a given strength of multibody effects compared to the growth rate at X = 0. To see this figure in color, go online.
Figure 5
Figure 5
Variation in filament composition due to incorporation of multibody effects in ATP hydrolysis and Pi release shown in terms of (a) the average length of a contiguous ADP-Pi section along the filament and (b) maximal length of a contiguous ADP-Pi section along the filament. Different symbols indicate varying strengths of multibody effects, as indicated in the legend. To see this figure in color, go online.
Figure 6
Figure 6
The total number of subunits (dotted lines) and the number of hydrolyzed subunits (solid lines) in the filament as a function of simulation time. Different colors correspond to varying strengths of multibody effects incorporated in the model, with X = 0 corresponding to a purely stochastic hydrolysis. The left panel corresponds to c0 = 0.3 μM, and the right panel corresponds to c0 = 0.7 μM. To see this figure in color, go online.
Figure 7
Figure 7
Variation in filament composition due to incorporation of multibody effects in Pi release reaction shown as (a) average length of a contiguous ATP section along the filament and (b) maximal length of a contiguous ATP section along the filament. Different colors indicate varying strengths of multibody effects, as indicated in the legend. The left panel corresponds to c0 = 0.3 μM, and the right panel corresponds to c0 = 0.7 μM. To see this figure in color, go online.

References

    1. Kabsch W., Mannherz H.G., Holmes K.C. Atomic structure of the actin:DNase I complex. Nature. 1990;347:37–44. - PubMed
    1. Blanchoin L., Pollard T.D. Hydrolysis of ATP by polymerized actin depends on the bound divalent cation but not profilin. Biochemistry. 2002;41:597–602. - PubMed
    1. Rould M.A., Wan Q., Trybus K.M. Crystal structures of expressed non-polymerizable monomeric actin in the ADP and ATP states. J. Biol. Chem. 2006;281:31909–31919. - PubMed
    1. Saunders M.G., Voth G.A. Water molecules in the nucleotide binding cleft of actin: effects on subunit conformation and implications for ATP hydrolysis. J. Mol. Biol. 2011;413:279–291. - PubMed
    1. McCullagh M., Saunders M.G., Voth G.A. Unraveling the mystery of ATP hydrolysis in actin filaments. J. Am. Chem. Soc. 2014;136:13053–13058. - PMC - PubMed

Publication types