

A role for Mog1 in H2Bub1 and H3K4me3 regulation affecting RNAPII transcription and mRNA export
- PMID: 30249596
- PMCID: PMC6216277
- DOI: 10.15252/embr.201845992
A role for Mog1 in H2Bub1 and H3K4me3 regulation affecting RNAPII transcription and mRNA export
Abstract
Monoubiquitination of histone H2B (to H2Bub1) is required for downstream events including histone H3 methylation, transcription, and mRNA export. The mechanisms and players regulating these events have not yet been completely delineated. Here, we show that the conserved Ran-binding protein Mog1 is required to sustain normal levels of H2Bub1 and H3K4me3 in Saccharomyces cerevisiae Mog1 is needed for gene body recruitment of Rad6, Bre1, and Rtf1 that are involved in H2B ubiquitination and genetically interacts with these factors. We provide evidence that the absence of MOG1 impacts on cellular processes such as transcription, DNA replication, and mRNA export, which are linked to H2Bub1. Importantly, the mRNA export defect in mog1Δ strains is exacerbated by the absence of factors that decrease H2Bub1 levels. Consistent with a role in sustaining H2Bub and H3K4me3 levels, Mog1 co-precipitates with components that participate in these modifications such as Bre1, Rtf1, and the COMPASS-associated factors Shg1 and Sdc1. These results reveal a novel role for Mog1 in H2B ubiquitination, transcription, and mRNA biogenesis.
Keywords: H2B ubiquitination; epigenetics; mRNA export; transcription; yeast.
© 2018 The Authors.
Figures
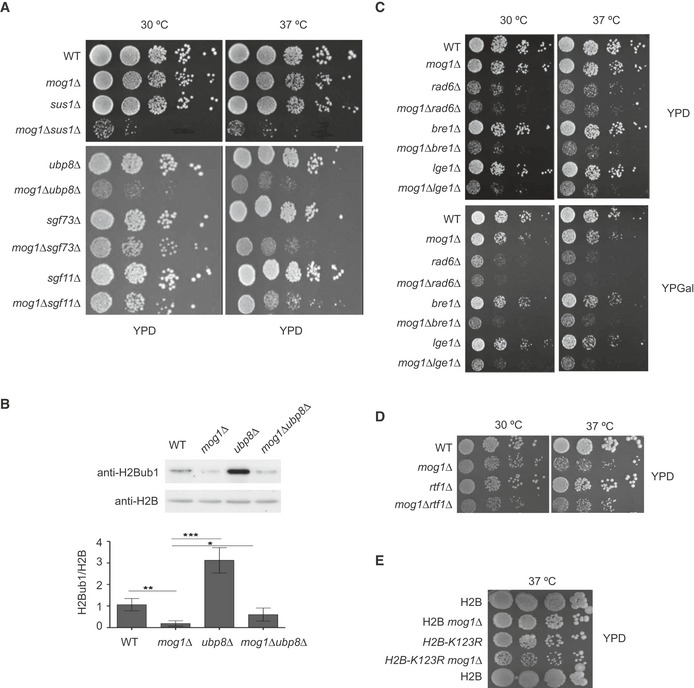
- A
MOG1 interacts genetically with the H2B deubiquitination machinery. Tenfold serial dilutions of the indicated strains were spotted on YPD and incubated for 2 days at the indicated temperatures.
- B
Expression levels of total H2B and H2Bub1 were analyzed in wild‐type (WT), mog1Δ, ubp8Δ, and ubp8Δmog1Δ whole‐cell lysates by Western blotting using anti‐total H2B and anti‐H2Bub1 antibodies. Bar graphs of H2Bub1 levels after H2B normalization show the mean and standard deviations of at least three independent experiments. Error bars represent SD. The P‐value was calculated using Student's t‐test (*P = 0.01–0.05; **P = 0.001–0.01; ***P < 0.001).
- C–E
The indicated strains were diluted as described in (A) and were then spotted on YPD or YPGal and incubated for 2 days.

A representative Coomassie‐stained SDS–PAGE gel showing the pattern of proteins co‐purifying with Ubp8‐TAP from wild‐type (WT) or mog1Δ cells. Protein markers (M) of the indicated molecular weight (kDa) are shown in lane M. The list of proteins detected using mass spectrometric analysis is shown in Table EV2.
ChIP analysis of the presence of TAP‐tagged Ubp8 at ADH1, PMA1, and YEF3 promoter (P) and coding regions (5'ORF) in WT or mog1Δ strains. The bar graphs indicate the mean and standard deviation for at least three independent experiments. Significance of the differences was calculated using Student's t‐test.

- A–D
Representative images showing the GFP signal for Rad6‐GFP (A), Bre1‐GFP (B), Rtf1‐GFP (C), and Ubp8‐GFP (D) in WT or mog1Δ strains. DAPI (DNA) and BF (bright field) pictures of the same images are shown. In all images, the scale bar corresponds to 5 μm.

The expression levels of H3K4me3 and H3 in total extracts of wild‐type (WT), mog1Δ, set1Δ, and spp1Δ strains were analyzed by Western blotting using the indicated antibodies. Bar graphs of H3K4me3 levels after H3 normalization show the mean and standard deviations of at least three independent experiments. The P‐value was calculated using Student's t‐test (*P = 0.01–0.05; ***P < 0.001).
ChIP analysis of H3K4me3 presence at ADH1, PMA1, and YEF3 promoter (P) and 5'ORF in wild‐type (WT) or mog1Δ strains relative to total H3. The bar graphs indicate the mean and standard deviation for at least three independent experiments. The significance of the differences was calculated using Student's t‐test (*P = 0.01–0.05; **P = 0.001–0.01; ***P < 0.001).
MOG1 interacts genetically with the H3 methylases Set1 and Set2. Tenfold serial dilutions of the indicated strains were spotted on YPD and incubated for 2 days at the indicated temperatures.
Histone H3K4A and H3K4A mog1Δ strains were compared with their isogenic strains as in (C).

The expression levels of H3K79me3 and of total H3 in total extracts from WT, mog1Δ, and bre1Δ cells were analyzed by Western blotting using the indicated antibodies.
As in (A) except that set2Δ, WT, and mog1Δ strains were analyzed using an anti‐H3K36me3 antibody.
As in (A) except that WT, mog1Δ, and rad1Δ strains were analyzed using an anti‐H3K4me2 antibody.

- A
Tenfold serial dilutions of the indicated strains were spotted on YPD containing the indicated concentrations of hydroxyurea (HU) and were incubated for 2–3 days.
- B, C
(B) mRNA synthesis rates (SR) as determined in Genomic Run‐On analysis and (C) mRNA abundance (RA), in mog1Δ compared with wild‐type (WT) cells. Bar graphs showing the average level and standard deviation of three experiments (n = 3) for SR and RA values obtained as the median of the whole gene dataset values in arbitrary units (×107) from image analysis quantification. Error bars represent SD. Significance of the differences was obtained using Student's t‐test, and statistical difference is considered as *P = 0.01–0.05. The scatter plots (right panels) show the variation of the transcription (B) or mRNA (C) levels of individual genes. Pearson correlation values are −0.039 (SR) and −0.042 (RA). This low correlation and the flat shape of the clouds on scatter plots (see red tendency line) indicates that there is no bias of the transcriptional effect with regard to expression level.
- D
Box plots of SR and RA median levels of mog1Δ cells compared with WT for all genes (Total), SAGA and TFIID‐dominated genes. These data were obtained from three independent replicates (n = 3) of the RA and SR data that were averaged as explained in the main text. The line within the box and the diplayed number represent the median of the whole data set (Total) for 351 (for RA) or 316 (SR) SAGA‐dominated genes and for the 3,903 (RA) or 3,403 (SR) TFIID‐dominated genes. The box represents the second quartile and the whiskers the first and third quartiles. Significance of the differences was calculated using Student's t‐test. No significant difference between the different groups was found. The similar variations in SRs and RAs indicate that there are no changes in mRNA half‐lives upon MOG1 deletion (shown in Fig EV4). The total number of genes with confident value in the analyses was 3,953 for RA and 3,989 for SR.


- A
ChIP analysis of TAP‐tagged Rad6 presence at ADH1, PMA1, and YEF3 coding regions (5’ and 3’) in WT or mog1Δ strains. Bar charts indicate the mean and standard deviation for at least three independent experiments. Significance of the differences was obtained using Student's t‐test (*P = 0.01–0.05; **P = 0.001–0.01; ***P = 0.0001–0.001; ****P < 0.0001).
- B–D
Bre1‐TAP, Rtf1‐TAP, and Rpb3, respectively, were analyzed as described in (A).
- E
Bar charts showing the relative chromatin occupancy to 5'ORFs (left panel) or 3'ORFs (right panel) of each factor relative to Rpb3 occupancy at these gene positions. Inputs were analyzed by Western blotting using anti‐TAP and anti‐PGK (loading control) antibodies to monitor protein levels (Fig EV5). Significance of the differences was obtained using Student's t‐test (*P = 0.01–0.05; **P = 0.001–0.01).
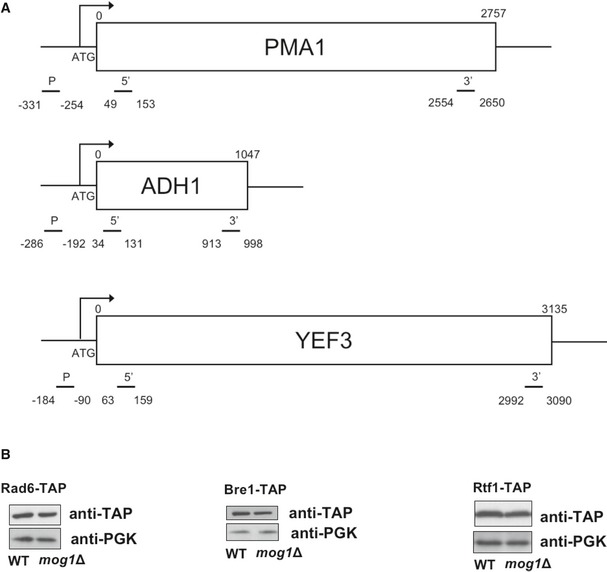
Schematic representation of primer pairs used throughout this paper for ChIP analysis of PMA1, ADH1, and YEF3 genes.
Inputs for ChIPs were analyzed by Western blotting using anti‐TAP and anti‐PGK (loading control) antibodies to monitor protein levels.
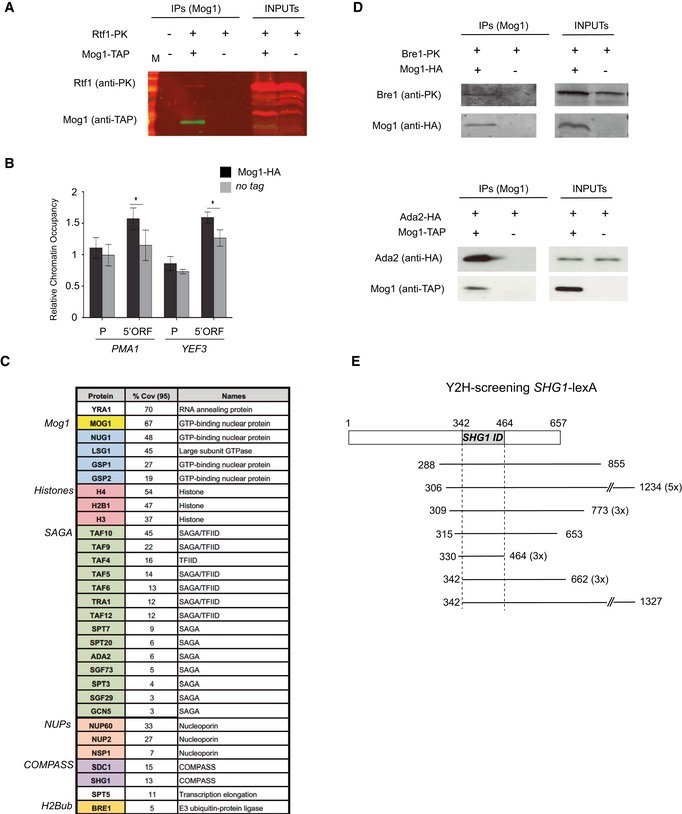
Co‐purification of Rtf1‐PK in cells expressing Mog1‐TAP (+,+). A non‐tagged strain (−,−) and cells expressing only Rtf1‐PK (+,−) were included as negative controls for co‐purification. Inputs and IPs are depicted for each strain.
ChIP analysis of the presence of HA‐tagged Mog1 compared to a non‐tagged strain (WT) at PMA1 and YEF3 promoter (P) and coding regions (5'ORF). The occupancy level was calculated as the signal ratio of the IP samples in relation to the input signal normalized to an intergenic region. Bar charts indicate the mean and standard deviation for at least three independent experiments. Significance of the differences was obtained using Student's t‐test and is presented as a P‐value (*P < 0.05).
List of proteins identified from at least two independent LC‐MS/MS analyses of Mog1‐TAP purifications. Numbers indicate peptides of matching amino acids from identified peptides with a confidence greater or equal to 95% divided by the total number of amino acids in the sample (coverage 95%). An identifier of function or complex for each protein is listed.
Mog1‐HA immunoprecipitation in cells expressing Bre1‐PK (upper panel) and Mog1‐TAP co‐precipitation in cells expressing Ada2‐HA (lower panel) are indicated as in (A) inputs and IPs are depicted for each strain.
Representation of the different fragments of the MOG1 gene identified in genome‐wide Shg1 yeast two‐hybrid screening. The region common to all identified MOG1 clones between residues 114 and 154 is depicted in gray as the SHG1 ID (interaction domain). The start and end positions in the MOG1 gene are indicated as well as the number of clones containing this fragment.


The Mog1E65K Ran‐binding mutant complements the slow growth of mog1ΔsetΔ mutants. Tenfold serial dilutions of wild‐type (WT), mog1Δ, set1Δ, and mog1ΔsetΔ strains transformed with wild‐type MOG1 (pMOG1) or with the Ran‐binding mutant (pMOG1E65K) as indicated were spotted on SC‐LEU and incubated for 2 days at the indicated temperatures.
The Mog1E65K Ran‐binding mutant complements the low H3K4me3 and H2Bub1 levels of mog1Δ. The expression levels of H3K4me3, total H3, H2Bub1, total H2B, and PGK1 in whole‐cell lysates from wild‐type (WT) or from mog1Δ cells transformed with an empty plasmid (+pEmpty), wild‐type MOG1 (pMOG1), or a Ran‐binding mutant (pMOG1E65K) were analyzed by Western blotting using the corresponding antibodies.
Gsp2 is not involved in H2Bub1 regulation. The expression levels of total H2B and of H2Bub1 were analyzed in whole‐cell lysates from wild‐type (WT) and gsp2Δ strains by Western blotting using anti‐total H2B and anti‐H2Bub1 antibodies.
References
-
- Rodríguez‐Navarro S, Hurt E (2011) Linking gene regulation to mRNA production and export. Curr Opin Cell Biol 23: 302–309 - PubMed
-
- Osley MA (2006) Regulation of histone H2A and H2B ubiquitylation. Brief Funct Genomic Proteomic 5: 179–189 - PubMed
-
- Pavri R, Zhu B, Li G, Trojer P, Mandal S, Shilatifard A, Reinberg D (2006) Histone H2B monoubiquitination functions cooperatively with FACT to regulate elongation by RNA polymerase II. Cell 125: 703–717 - PubMed
Publication types
MeSH terms
Substances
Grants and funding
LinkOut - more resources
Full Text Sources
Other Literature Sources
Molecular Biology Databases
Research Materials
Miscellaneous
