. 2018 Oct 2;115(40):10154-10159.
doi: 10.1073/pnas.1803667115. Epub 2018 Sep 24.

Anatomical and microstructural determinants of hippocampal subfield functional connectome embedding

Affiliations

Anatomical and microstructural determinants of hippocampal subfield functional connectome embedding

Reinder Vos de Wael et al. Proc Natl Acad Sci U S A. .

Abstract

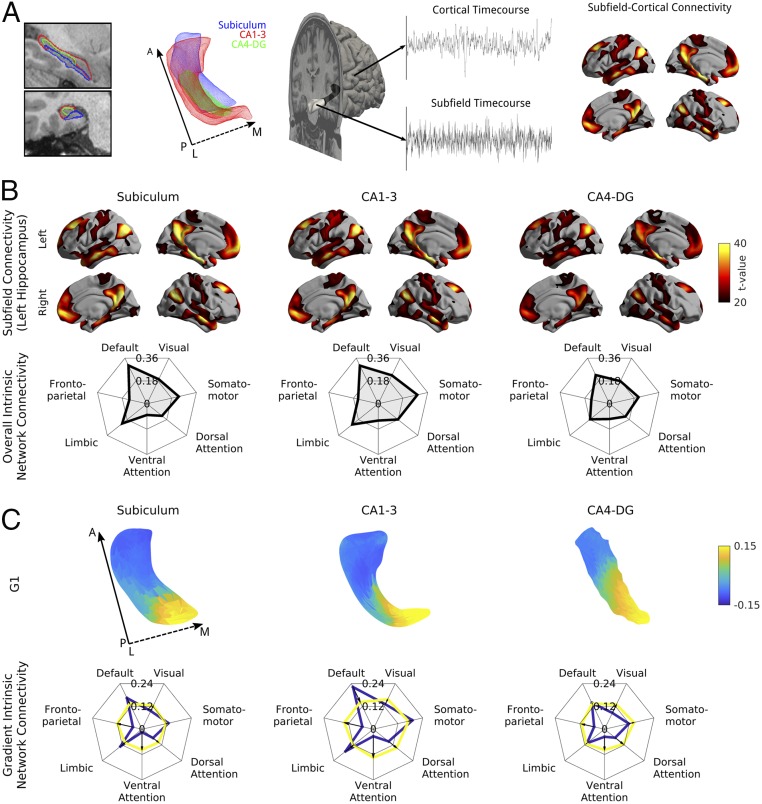
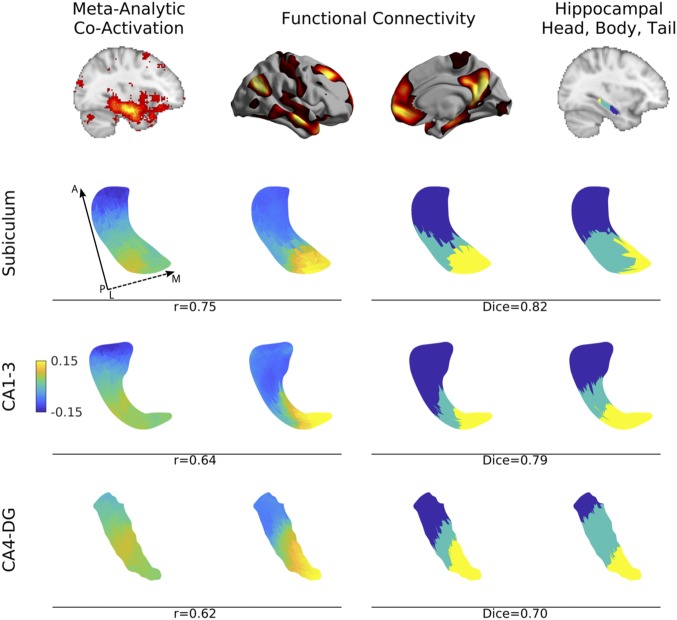
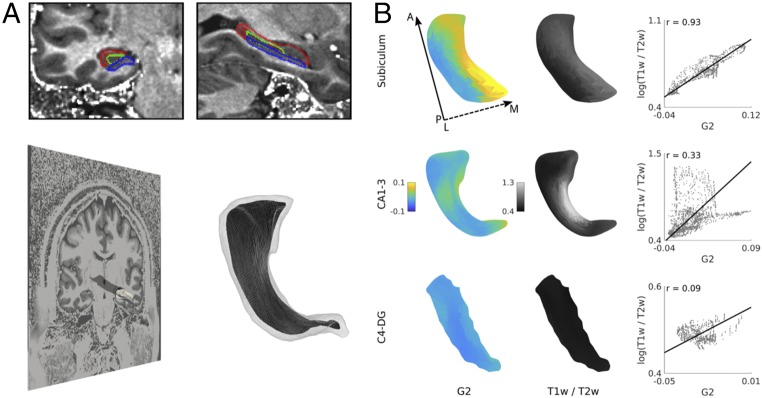
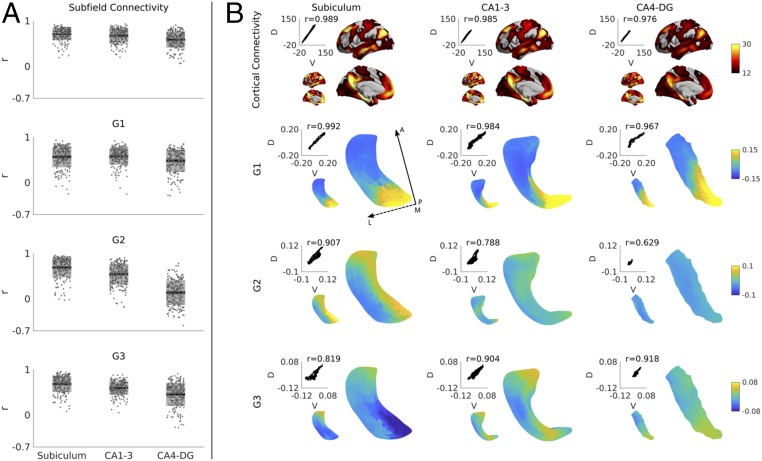
The hippocampus plays key roles in cognition and affect and serves as a model system for structure/function studies in animals. So far, its complex anatomy has challenged investigations targeting its substructural organization in humans. State-of-the-art MRI offers the resolution and versatility to identify hippocampal subfields, assess its microstructure, and study topographical principles of its connectivity in vivo. We developed an approach to unfold the human hippocampus and examine spatial variations of intrinsic functional connectivity in a large cohort of healthy adults. In addition to mapping common and unique connections across subfields, we identified two main axes of subregional connectivity transitions. An anterior/posterior gradient followed long-axis landmarks and metaanalytical findings from task-based functional MRI, while a medial/lateral gradient followed hippocampal infolding and correlated with proxies of cortical myelin. Findings were consistent in an independent sample and highly stable across resting-state scans. Our results provide robust evidence for long-axis specialization in the resting human hippocampus and suggest an intriguing interplay between connectivity and microstructure.

Keywords: MRI; connnectome; hippocampus; microstructure; neuroimaging.


Conflict of interest statement

The authors declare no conflict of interest.

Figures

Fig. 1.
Fig. 1.
Analysis of functional connectome embedding of left hippocampal subfields. (A) Subfield-wide connectivity analysis. Segmentations and surfaces were automatically extracted for subiculum (blue), CA1–3 (red), and CA4–DG (green). Segmentations are shown in a T1w scan and as a mesh from a superior view with solid and dashed arrows denoting posterior (P) to anterior (A) and lateral (L) to medial (M) directions, respectively. rs-fMRI time series were extracted along the medial surfaces of each of these subfields and the neocortical surface. The mean time series of each subfield was computed and correlated with all cortical vertices resulting in a subfield-specific connectivity map. (B) Common and distinct functional connectivity of left hemispheric subfields (Left column, subiculum; Center column, CA1–3; Right column, CA4–DG) and neocortex as well as their connectivity to seven intrinsic networks, derived from a previous functional community detection (31). Surface-based findings were corrected for multiple comparisons and additionally thresholded at t > 20 to highlight only the most prominent connections. (C) The first principal component of intrinsic functional connectivity along hippocampal subfields (Left column, subiculum; Center column, CA1–3; Right column, CA4–DG) describes an anterior/posterior gradient. Based on a hippocampal–cortical connectivity matrix, we performed diffusion map embedding, an unsupervised manifold learning technique. The surfaces display the loadings of the first component, and the spider plots show connectivity patterns of the bottom (anterior, blue) and top (posterior, yellow) 25% of vertices to the seven intrinsic functional communities. Solid and dashed arrows denote posterior to anterior and lateral to medial direction, respectively.
Fig. 2.
Fig. 2.
Long-axis specialization of the left subiculum (second row), CA1–3 (third row), and CA4–DG (fourth row) across different modalities. The principal gradient of both metaanalytic task-fMRI coactivation (first column) and rs-fMRI (second column) ran in anterior/posterior direction. K-means clusters (k = 3) of the rs-fMRI connectivity derived gradient (third column) overlapped strongly with manual segmentations of hippocampal head, body, and tail based on a previous atlas (27) (fourth column). Correlation coefficient values denote the association between metaanalytic coactivation and functional connectivity within each subfield. Dice indices denote geometric overlaps between k-means clusters of functional connectivity and the hippocampal head, body, and tail. Hippocampal surfaces are shown from a superior view. Solid and dashed arrows denote posterior to anterior and lateral to medial direction, respectively. For findings in the right hemisphere, see SI Appendix, Fig. S4.
Fig. 3.
Fig. 3.
Association between left hippocampal second gradient and T1w/T2w intensities. (A) To assess the association between functional gradients and hippocampal microstructure, we mapped hippocampal segmentations to T1w/T2w images and extracted T1w/T2w intensities at each vertex of the hippocampal medial surfaces. (B) Systematic correlation analyses indicated highest correlations between surface-sampled T1w/T2w and the second gradient, which runs along the hippocampal infolding. Solid and dashed arrows denote posterior to anterior and lateral to medial direction, respectively. For findings in the right hemisphere, see SI Appendix, Fig. S6.
Fig. 4.
Fig. 4.
(A) Test/retest stability of left hippocampal connectivity and gradients and (B) reproducibility in an independent HCP subsample. Dark gray zones in the boxplots denote 95% confidence intervals; light gray zones denote one SD. Small and large surfaces represent data of the discovery (D) and validation (V) cohorts, respectively. Scatterplots show the vertex-wise correspondence between groups, with Pearson correlation values denoted above the scatterplot. Solid and dashed arrows denote posterior to anterior and medial to lateral direction, respectively.

References

    1. Penfield W, Milner B. Memory deficit produced by bilateral lesions in the hippocampal zone. AMA Arch Neurol Psychiatry. 1958;79:475–497. - PubMed
    1. Burgess N, Maguire EA, O’Keefe J. The human hippocampus and spatial and episodic memory. Neuron. 2002;35:625–641. - PubMed
    1. Phelps EA. Human emotion and memory: Interactions of the amygdala and hippocampal complex. Curr Opin Neurobiol. 2004;14:198–202. - PubMed
    1. Franklin TB, Saab BJ, Mansuy IM. Neural mechanisms of stress resilience and vulnerability. Neuron. 2012;75:747–761. - PubMed
    1. Braak H, Braak E. Neuropathological stageing of Alzheimer-related changes. Acta Neuropathol. 1991;82:239–259. - PubMed

Publication types