. 2018 Nov 20;86(12):e00091-18.
doi: 10.1128/IAI.00091-18. Print 2018 Dec.

Treatment of Dextran Sulfate Sodium-Induced Colitis with Mucosa-Associated Lymphoid Tissue Lymphoma Translocation 1 Inhibitor MI-2 Is Associated with Restoration of Gut Immune Function and the Microbiota

Affiliations

Treatment of Dextran Sulfate Sodium-Induced Colitis with Mucosa-Associated Lymphoid Tissue Lymphoma Translocation 1 Inhibitor MI-2 Is Associated with Restoration of Gut Immune Function and the Microbiota

Kyung Won Lee et al. Infect Immun. .

Abstract

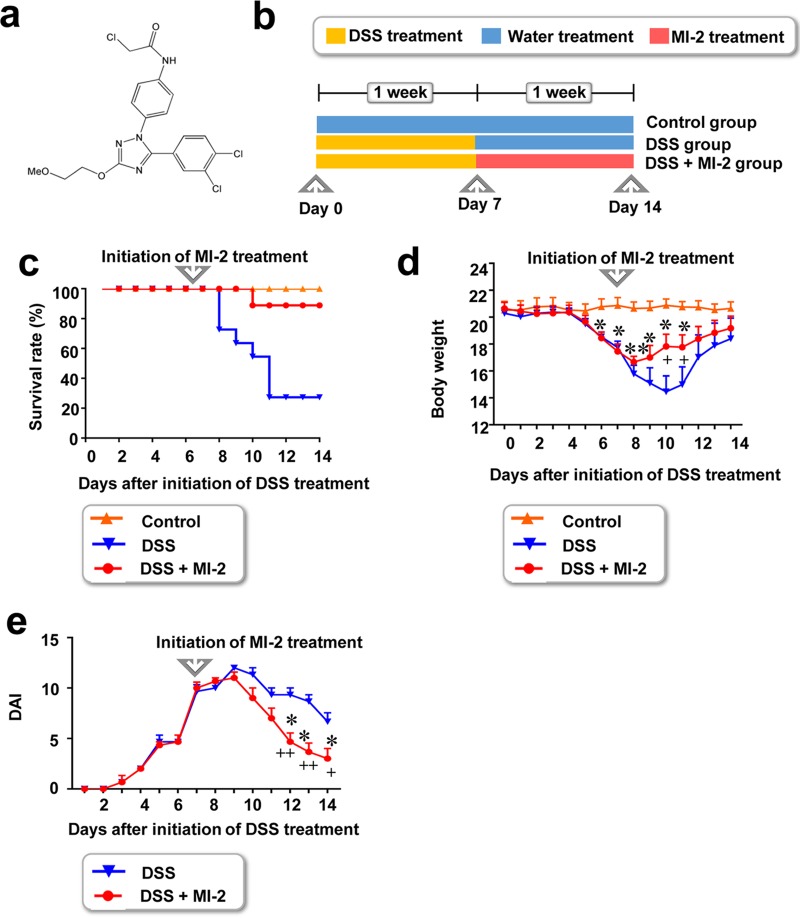
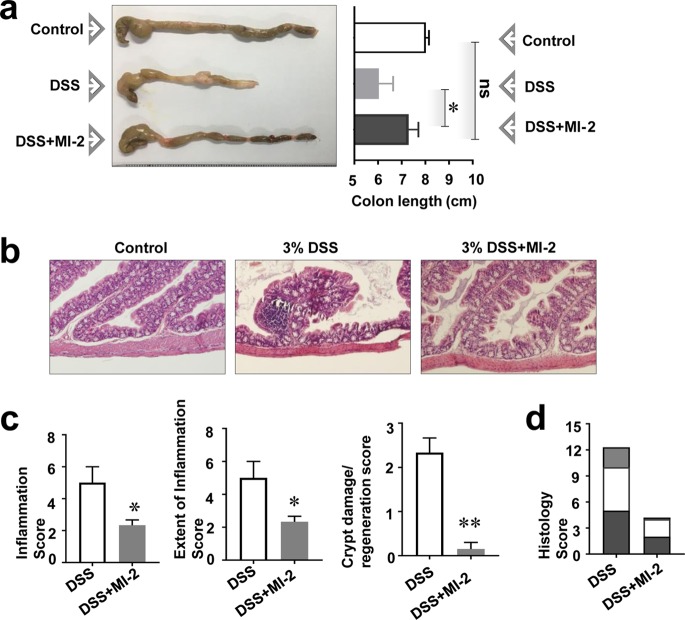
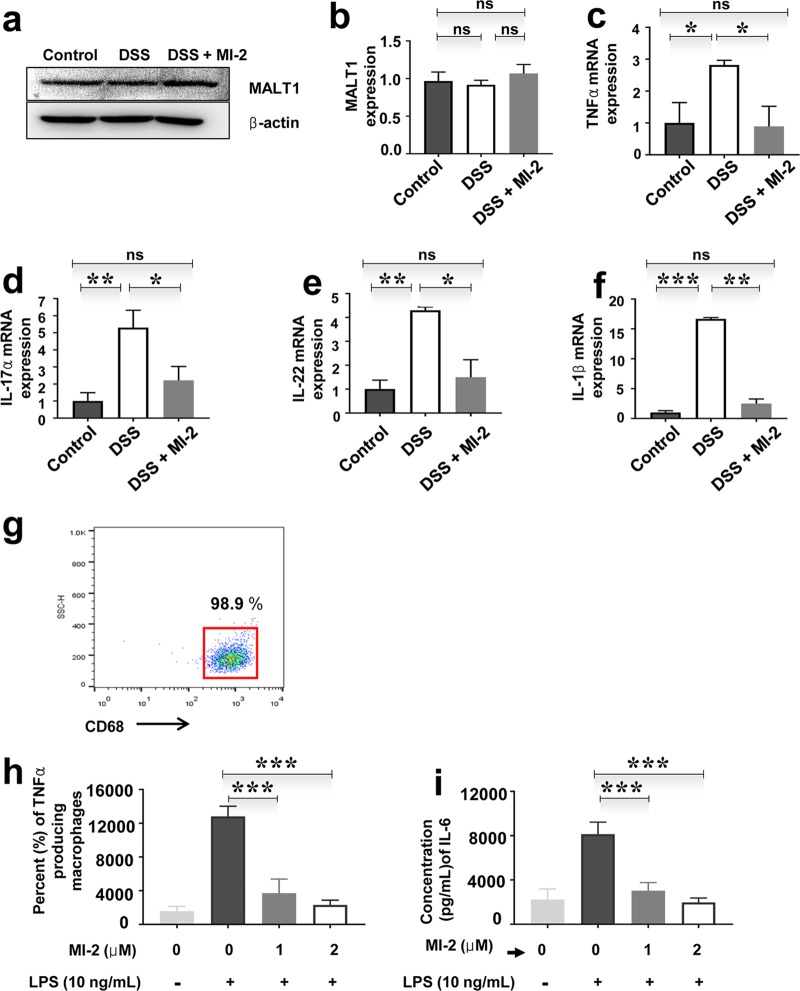
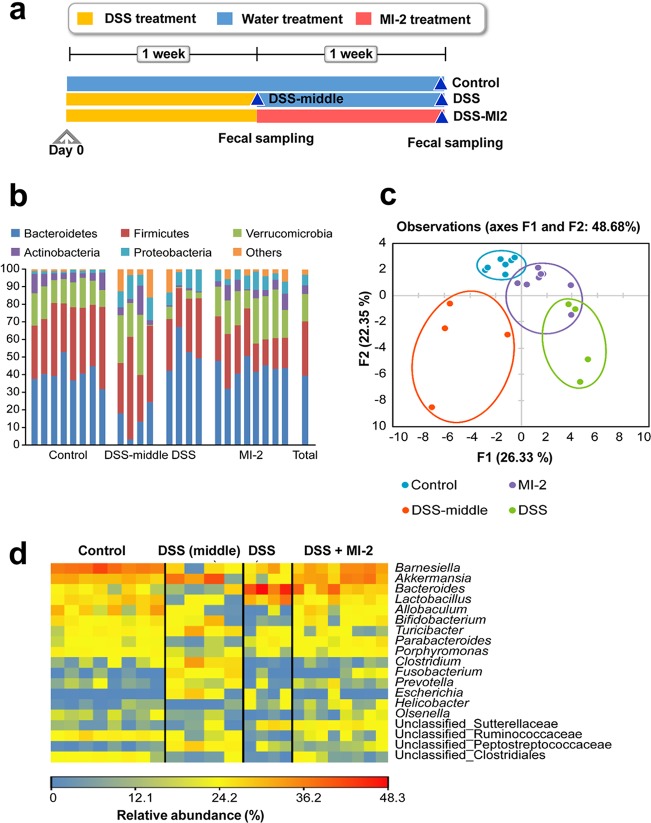
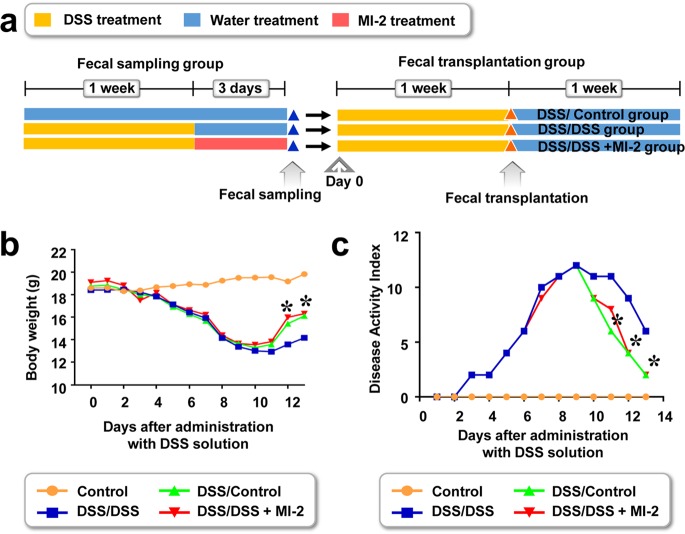
Disruption of the healthy intestinal microbiome and homeostasis of the intestinal immune system, which are closely interactive, are two key factors for ulcerative colitis. Here, we show that MI-2, a selective inhibitor of mucosa-associated lymphoid tissue lymphoma translocation-1 (MALT1), alleviated excessive inflammatory responses and was associated with restoration of healthy intestinal microbiome in mice suffering from dextran sulfate sodium (DSS)-induced colitis. We found that the diversity of intestinal microbiome of mice with DSS-induced colitis was significantly lower than that of healthy mice. However, MI-2 treatment in mice with DSS-induced colitis resulted in restored microbially diverse populations. To understand the possibility of the beneficial effect of the restored microbially diverse populations of MI-2-treated mice with DSS-induced colitis, we showed that inserting fecal microbiota from MI-2-treated mice with DSS-induced colitis and healthy control mice into mice with DSS-induced colitis could alleviate symptoms of colitis. The possibility of MI-2 treatment in DSS-induced colitis, associated with restoration of healthy microbially diverse populations in addition to reshaping host immune modulating capacity by reducing inflammatory cytokines (tumor necrosis factor alpha, interleukin-1β [IL-1β], IL-17α, and IL-22), may be considered therapeutic for ulcerative colitis.

Keywords: MALT1; MI-2; inflammation; microbiome; ulcerative colitis.


Figures

FIG 1
FIG 1
Effect of the MALT1 inhibitor MI-2 in a mouse model of DSS-induced colitis. (a) Chemical structure of MI-2. (b) C57BL/6J mice were administered 3% (wt/vol) DSS in autoclaved drinking water for 7 days to induce colitis, followed by regular autoclaved drinking water for 7 days. Starting from day 7, mice were i.p. injected with MI-2 (25 mg/kg). (c and d) Survival rate and body weight. Results were pooled from three independent experiments (n = 10 to 15 mice per group). (e) DAI values calculated based on results pooled from three independent experiments. P values were <0.05 (*) and <0.01 (**) between MI-2-treated mice with DSS-induced colitis (DSS + MI-2 group) and untreated healthy mice (control group). P values were <0.05 (+) between MI-2-treated and untreated mice with DSS-induced colitis (DSS + MI-2 and DSS groups, respectively) (two-tailed unpaired Student's t test). Error bars denote standard errors of the means (SEM).
FIG 2
FIG 2
MI-2 restores intestinal tissue damage in DSS-induced colitis. (a) Colon length in control, DSS, and DSS plus MI-2 groups are shown. (Left) Images of colons are representative of three independent experiments (n = 10 to 15 mice per group). (Right) The graph shows the mean values ± standard errors of colon lengths pooled from three independent experiments (n = 10 to 15 mice per group). (b) Representative images of colon tissue sections stained with H&E from three independent experiments (n = 10 to 15 mice per group). (c) Level of crypt damage/regeneration, extent of inflammation, and inflammation score for each sample. Graphs show pooled results from three independent experiments (n = 10 to 15 mice per group). (d) Histological scores calculated based on crypt damage/regeneration, extent of inflammation, and inflammation scores (from panel c) for DSS and DSS plus MI-2 mice. P values were <0.05 (*) and <0.01 (**) versus control (untreated) cells (two-tailed unpaired Student's t test). Error bars denote SEM.
FIG 3
FIG 3
MI-2 inhibits inflammatory cytokine and antibacterial molecule production by macrophages in intestinal tissue. (a) MALT1 protein expression in the colon tissue of control, DSS, and DSS plus MI-2 groups was detected by Western blotting. Images shown are representative of three independent experiments. (b) Quantification of MALT1 protein expression in colon tissue of control, DSS, and DSS plus MI-2 mice based on three independent experiments. (c to f) mRNA expression levels of TNF-α (c), IL-17α (d), IL-22 (e), and IL-1β (f) in colon tissue of control, DSS, and DSS plus MI-2 mice, as detected by qPCR. Graphs are representative of two independent experiments (n = 6 per group). (g) Representative dot plot showing the percentage of cells positive for CD68 from three independent experiments. Representative histogram of macrophages differentiated from human peripheral blood monocytes in the presence of M-CSF is shown. Data represent the results of three independent experiments. (h) TNF-α concentration in culture supernatant of untreated or LPS-treated human peripheral monocyte-derived macrophage cultures with or without MI-2 treatment, as determined by ELISA; data are from three independent experiments. (i) IL-6 concentration in culture supernatant of untreated or LPS-treated human peripheral monocyte-derived macrophage cultures with or without MI-2 treatment, as determined by ELISA. Pooled results from three independent experiments are shown. P values were <0.01 (**) and <0.001 (***) versus the control group (two-tailed unpaired Student's t test). Error bars denote SEM.
FIG 4
FIG 4
Altered intestinal microbiome composition in MI-2-treated mice with DSS-induced colitis. (a) Microbiome profiles of control, DSS-middle, DSS, and DSS plus MI-2 mice. (b) Relative abundance of phyla in each group. Phyla accounting for <5% of total sequences were combined as Others. Total is the relative abundance of total sequences across all 24 samples in the four groups. (c) PCA of intestinal microbiota. Forty-one OTUs accounting for at least 0.5% of total sequences across all 24 samples in the four groups were included in the analysis. (d) Heat map showing the relative abundance of key bacteria. Genera and unclassified groups accounting for >0.5% of total sequences and differing significantly among the four groups were regarded as key bacteria.
FIG 5
FIG 5
Transplanted fecal microbiota from MI-2-treated mice with DSS-induced colitis and healthy controls increases survival and body weight in mice with DSS-induced colitis. (a) Fecal transplantation from healthy control mice (DSS/Control), mice with DSS-induced colitis (DSS/DSS), and MI-2-treated mice with DSS-induced colitis (DSS/DSS + MI-2) into mice with DSS-induced colitis was performed. (b and c) Body weight was measured (b) and DAI was determined (c), and r results were pooled from two independent experiments (n = 10 to 12 mice per group). *, P value of <0.05 between mice with fecal transplantation from MI-2-treated DSS-induced control mice into mice with DSS-induced colitis (DSS/DSS-MI2) and mice with fecal transplantation from control mice into mice with DSS-induced colitis (DSS/Control). +, P value of <0.05 between mice with fecal transplantation from MI-2-treated DSS-induced control mice into mice with DSS-induced colitis (DSS/DSS + MI-2) and mice with fecal transplantation from untreated DSS-induced colitis into mice with DSS-induced colitis (DSS/DSS) (two-tailed unpaired Student's t test). Error bars denote SEM.

Similar articles

Cited by

References

    1. Farrell RJ, Peppercorn MA. 2002. Ulcerative colitis. Lancet 359:331–340. doi:10.1016/S0140-6736(02)07499-8. - DOI - PubMed
    1. Leong RW, Koo JH. 2009. Colorectal cancer in inflammatory bowel disease. J Gastroenterol Hepatol 24:503–505. doi:10.1111/j.1440-1746.2009.05790.x. - DOI - PubMed
    1. Triantafillidis JK, Nasioulas G, Kosmidis PA. 2009. Colorectal cancer and inflammatory bowel disease: epidemiology, risk factors, mechanisms of carcinogenesis and prevention strategies. Anticancer Res 29:2727–2737. - PubMed
    1. Kappelman MD, Rifas-Shiman SL, Kleinman K, Ollendorf D, Bousvaros A, Grand RJ, Finkelstein JA. 2007. The prevalence and geographic distribution of Crohn’s disease and ulcerative colitis in the United States. Clin Gastroenterol Hepatol 5:1424–1429. doi:10.1016/j.cgh.2007.07.012. - DOI - PubMed
    1. Bajer L, Kverka M, Kostovcik M, Macinga P, Dvorak J, Stehlikova Z, Brezina J, Wohl P, Spicak J, Drastich P. 2017. Distinct gut microbiota profiles in patients with primary sclerosing cholangitis and ulcerative colitis. World J Gastroenterol 23:4548–4558. doi:10.3748/wjg.v23.i25.4548. - DOI - PMC - PubMed

Publication types

MeSH terms

LinkOut - more resources