. 2018 Nov 1;201(9):2683-2699.
doi: 10.4049/jimmunol.1701783. Epub 2018 Sep 24.

Pleiotropic Impacts of Macrophage and Microglial Deficiency on Development in Rats with Targeted Mutation of the Csf1r Locus

Affiliations

Pleiotropic Impacts of Macrophage and Microglial Deficiency on Development in Rats with Targeted Mutation of the Csf1r Locus

Clare Pridans et al. J Immunol. .

Erratum in

Abstract

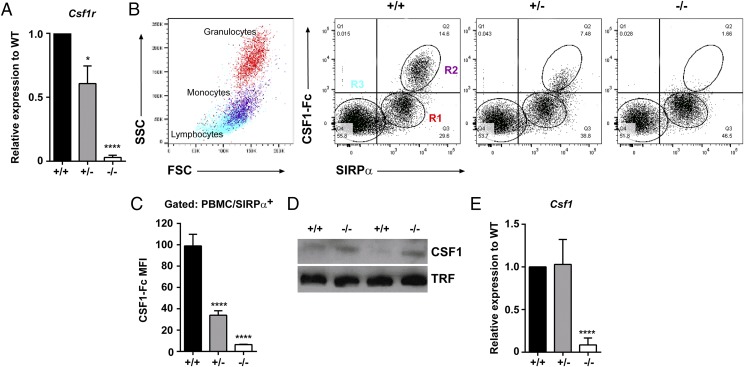
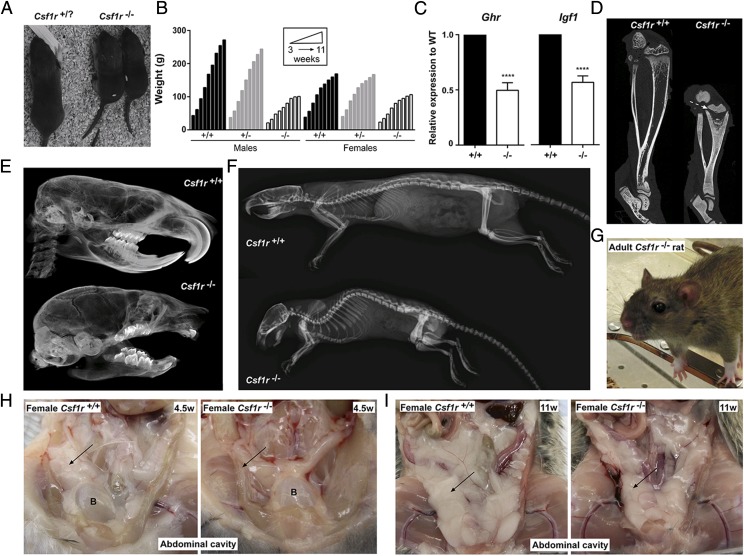
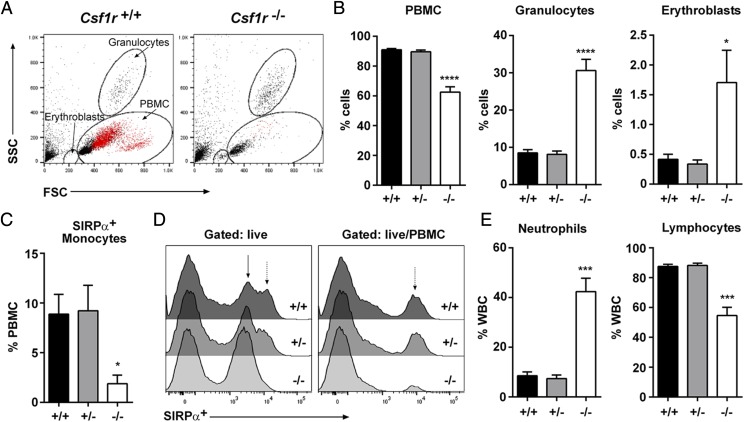
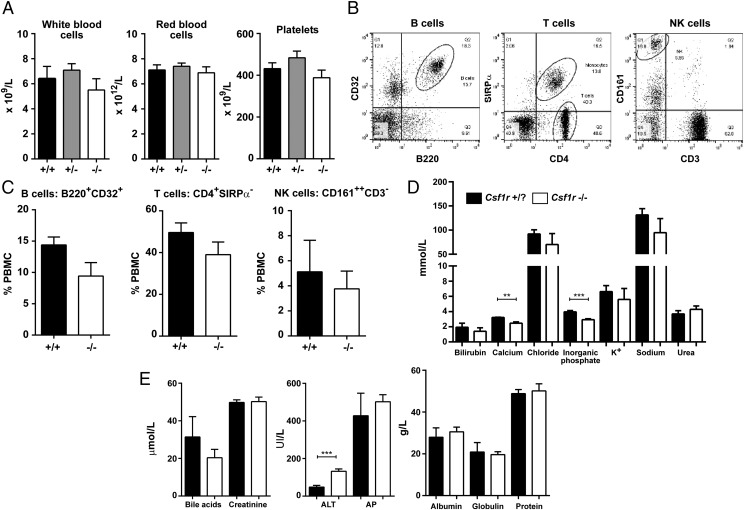
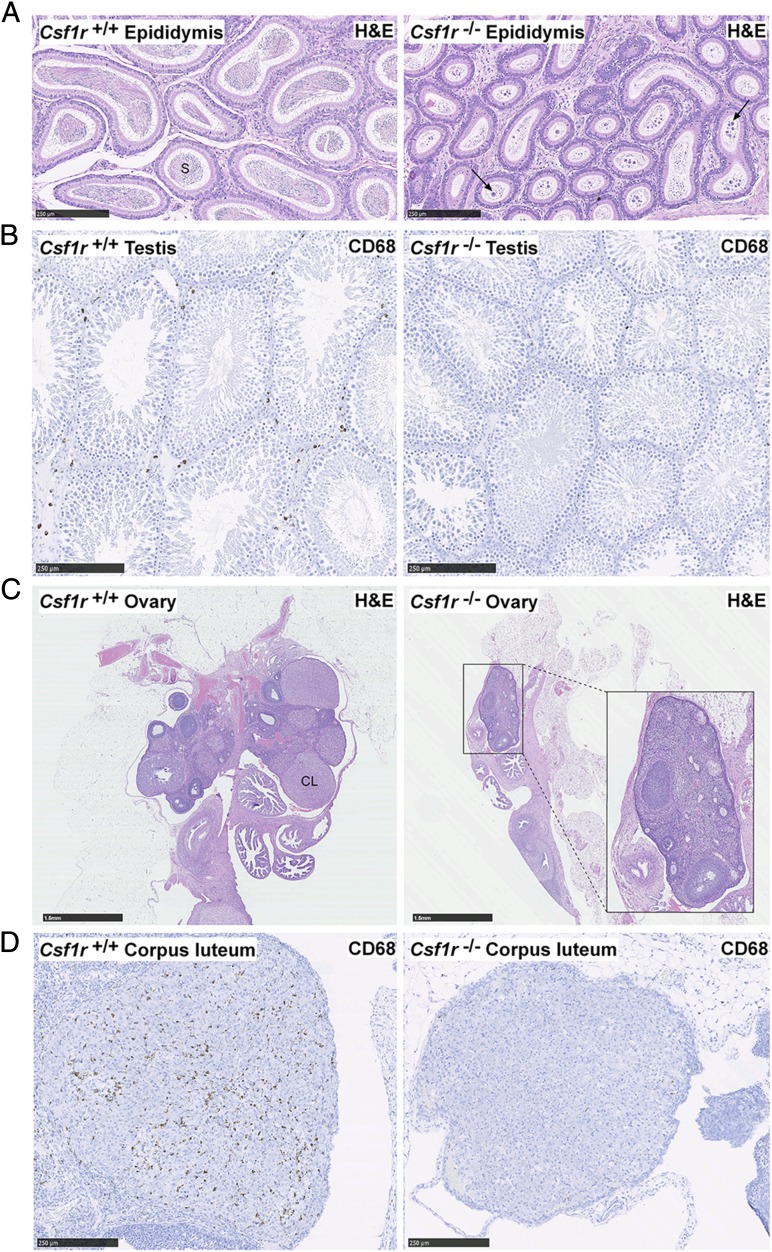
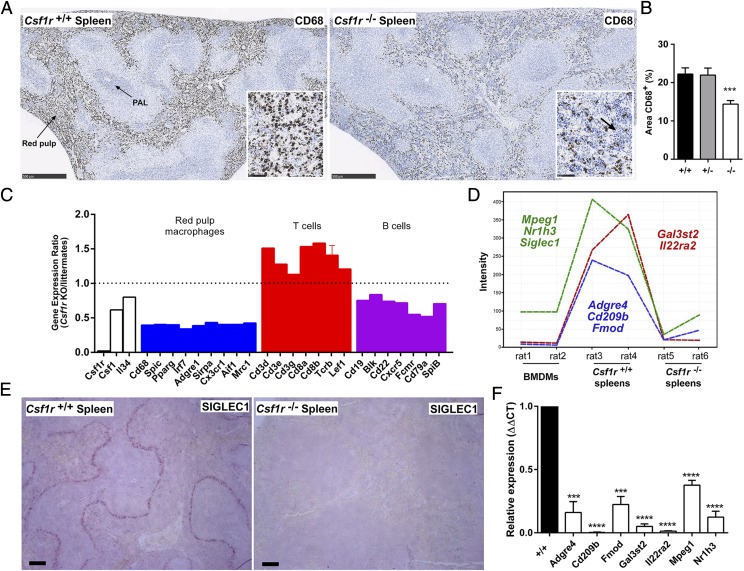
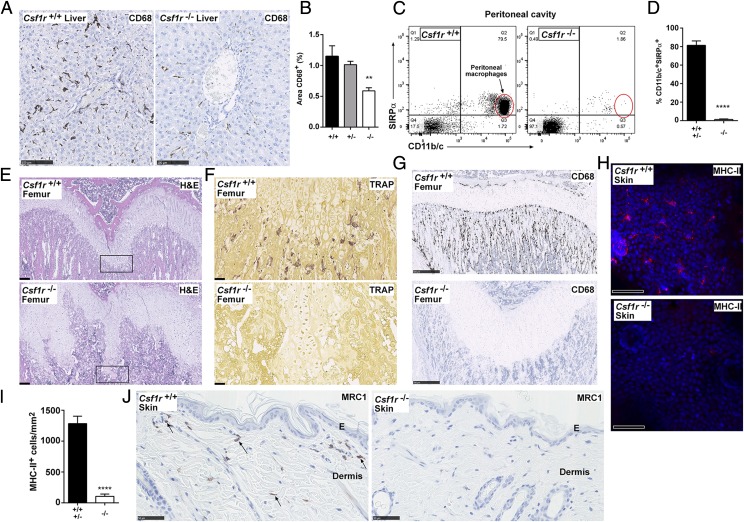
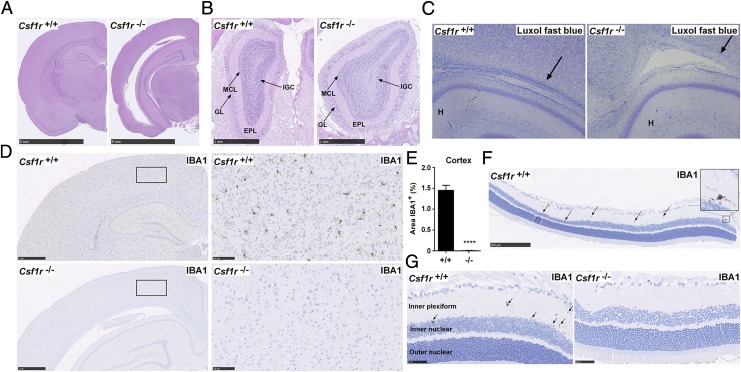
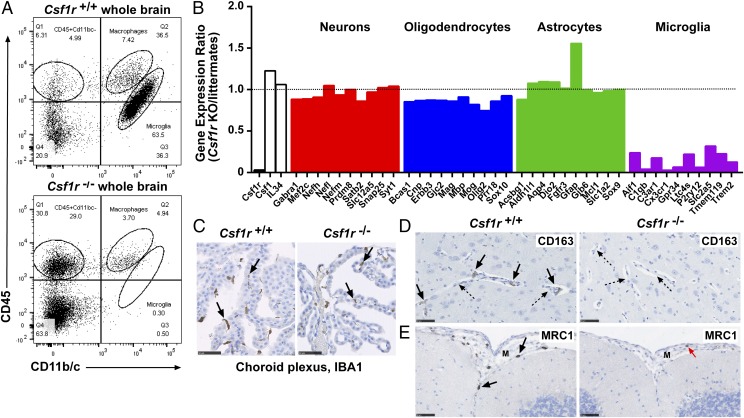
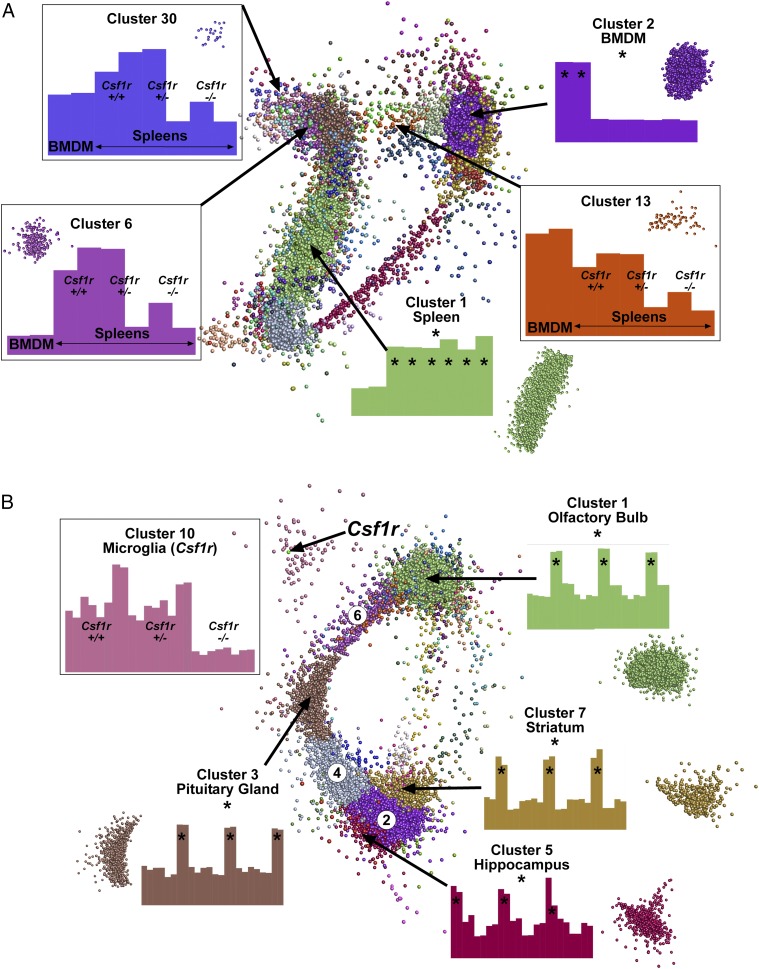
We have produced Csf1r-deficient rats by homologous recombination in embryonic stem cells. Consistent with the role of Csf1r in macrophage differentiation, there was a loss of peripheral blood monocytes, microglia in the brain, epidermal Langerhans cells, splenic marginal zone macrophages, bone-associated macrophages and osteoclasts, and peritoneal macrophages. Macrophages of splenic red pulp, liver, lung, and gut were less affected. The pleiotropic impacts of the loss of macrophages on development of multiple organ systems in rats were distinct from those reported in mice. Csf1r-/- rats survived well into adulthood with postnatal growth retardation, distinct skeletal and bone marrow abnormalities, infertility, and loss of visceral adipose tissue. Gene expression analysis in spleen revealed selective loss of transcripts associated with the marginal zone and, in brain regions, the loss of known and candidate novel microglia-associated transcripts. Despite the complete absence of microglia, there was little overt phenotype in brain, aside from reduced myelination and increased expression of dopamine receptor-associated transcripts in striatum. The results highlight the redundant and nonredundant functions of CSF1R signaling and of macrophages in development, organogenesis, and homeostasis.


Figures

FIGURE 1.
FIGURE 1.
Expression of Csf1r and Csf1 in rats. (A) cDNA was prepared from total splenic RNA and Csf1r expression analyzed by qRT-PCR (n = 7+/+, 7+/−, and 3−/−). (B) Whole EDTA blood was used to analyze SIRPα expression and binding of CSF1R to its ligand (CSF1-Fc) by flow cytometry. Regions R1–R3 highlighted in Csf1r+/+ rat blood were back-gated onto a forward versus side scatter (FSC/SSC) dot plot to highlight the three main cell populations in blood. (C) Combined mean fluorescent intensity of CSF1-Fc binding in SIRPα+ monocytes (n = 6+/+, 8+/−, and 5−/−). (D) Protein lysates were prepared from EDTA plasma (female adults) and assessed for CSF1 expression by Western blot. An anti-transferrin (TRF) Ab was used as the loading control. (E) cDNA was prepared from total spleen RNA and Csf1 expression analyzed by qRT-PCR (n = 7+/+, 7+/−, and 3−/−). Graphs show the mean + SEM. Significance compared with wild type is indicated by *p = 0.015 and ****p < 0.0001 using a t test.
FIGURE 2.
FIGURE 2.
Gross phenotype of Csf1r−/− rats. (A) Two Csf1r−/− rat pups and a littermate control at postnatal day 11. (B) Rats were weighed weekly following weaning at P21. For males, n = 5+/+, 8+/−, and 3−/−. For females, n = 7+/+, 4+/−, and 8−/−. Animals culled prior to 11 wk of age were included in the analysis. Graph shows the mean + SEM. (C) Total RNA was isolated from livers of wild type (+/+) and Csf1r−/− rats (n = 6) for analysis of Ghr and total Igf1 expression via qRT-PCR. There were equal numbers of males and females, four animals were adults, and two were 18 d old in each group. Graph shows the mean + SEM for pairwise comparison with age- and sex-matched littermate controls. Absolute values did not differ markedly between males and females or ages. Significance compared with wild type is indicated by ****p < 0.0001 using a t test. (D) Lower limbs from 7-wk males were fixed in 10% buffered formalin and analyzed for bone density by μCT. Dotted arrow indicates growth plate. (E) Skulls from 7-wk males were scanned by μCT. (F) Rats were analyzed by radiography at 6 mo of age. μCT images are from females, which are representative of both sexes. (G) An adult female Csf1r−/− rat with bulging eyes. Representative photograph of the abdominal cavities of 4.5-wk-old (H) and 11-wk-old (I) females. Arrow points to visceral fat in the wild type (left) and absence or reduction of visceral fat in Csf1r−/− rat (right). Images are also representative of males. B, bladder.
FIGURE 3.
FIGURE 3.
Analysis of whole blood. (A) Whole EDTA blood from adult rats was used to analyze forward versus side scatter (FSC/SSC) profiles by flow cytometry. SIRPα+ monocytes are colored red. (B) The percentages of PBMCs, granulocytes, and erythroblasts were determined by FSC/SSC profiles (n = 5 per genotype). (C) Cells were gated on SIRPα+ PBMC to determine the percentage of monocytes (n = 5 per genotype). (D) SIRPα expression was analyzed in whole EDTA blood gating on total live cells and live PBMC. Solid arrow highlights SIRPαlow granulocytes. Dotted arrow highlights SIRPαhigh monocytes (n = 5 per genotype). (E) Whole EDTA blood was analyzed on an automated counter to determine the percentage of neutrophils and lymphocytes in WBCs (n = 6+/+, 10+/−, and 8−/−). Graphs show the mean + SEM. Significance compared with wild type is indicated by *p = 0.046 (erythroblasts) and 0.015 (monocytes), ***p < 0.0003, and ****p < 0.0001 using a t test.
FIGURE 4.
FIGURE 4.
Further analysis of Csf1r-deficient rat blood. (A) Whole EDTA blood was used to determine the total number of WBCs, RBCs, and platelets from male and female rats aged between 6 and 12 wk (n = 6+/+, 11+/−, and 8−/−). (B) Whole EDTA blood was analyzed by flow cytometry to identify B, T, and NK cells. Dot plots show gating strategy for each cell type using Csf1r +/+ blood. Cells were gated on the PBMC population by forward versus side scatter (FSC/SSC). Quadrants were determined with isotype controls (n = 5+/+ and 6−/−). (C) Graphs shows the mean + SEM. p = 0.09, 0.23, and 0.63 for B, T, and NK cells, respectively. (D and E) Serum from male and female rats aged 2–4 wk was analyzed (n = 5 per genotype). Graphs shows the mean + SEM. **p = 0.0018, ***p = 0.0010 (inorganic phosphate) and 0.0007 (ALT). ALT, alanine aminotransferase; AP, alkaline phosphatase, K+, potassium.
FIGURE 5.
FIGURE 5.
Histology of reproductive organs. Formalin-fixed and paraffin-embedded epididymides, testes, and ovaries were stained with H&E or an Ab against CD68. (A) Longitudinal sections of epididymides and (B) testes. Images are representative of six rats aged between 7 and 11 wk. Arrows point to atypical residual bodies. Scale bar, 250 μm. (C and D) Longitudinal sections of ovaries stained with H&E and CD68. Images are representative of seven rats aged 11–12 wk. Scale bar, 1.5 mm (C) and 250 μm (D). In wild type and Csf1r+/− rats, an average of 5.8 (range 3–11) corpora lutea were observed per ovary in H&E-stained sections (n = 10) compared with only 0.7 (range 0–3) in Csf1r−/− rats (n = 7). Whole slide images were produced with a NanoZoomer slide scanner and images were exported with NDP.view2 software (Hamamatsu Photonics). CL, corpus luteum, S, sperm.
FIGURE 6.
FIGURE 6.
Analysis of spleens in Csf1r−/− rats. (A) Formalin-fixed and paraffin-embedded spleens were stained with an Ab against CD68. Scale bar, 500 μm. Inset shows an area of red pulp. Scale bar, 50 μm. Arrow points to infiltration of lymphocytes in Csf1r−/− inset. Whole slide images were produced with a NanoZoomer slide scanner and jpeg files exported with NDP.view2 software. PAL, periarteriolar lymphoid sheath. (B) The area of CD68+ cells in the red pulp was determined from 10 images per spleen (at original magnification ×80) using ImageJ (Fiji) (n = 10+/+, 8+/−, and 13−/−). Graph shows mean + SEM. Significance compared with wild type is indicated by ***p = 0.0002 using a t test. (C) Microarray data from spleens were used to determine expression ratios for genes associated with red pulp macrophages and T and B cells. Graph shows mean + SEM for genes with multiple probes. (D) Gene expression plot generated in Graphia Pro highlighting splenic macrophage-specific genes which were downregulated in Csf1r−/− rats. (E) Formalin-fixed and paraffin-embedded adult spleens were stained with an Ab against SIGLEC1. Scale bar, 100 μm. Images are representative of 2+/+ and 3−/− rats and two repeat experiments. (F) Total RNA was isolated from spleens of adult wild type (+/+) and Csf1r−/− rats (n = 3) for analysis of candidate marginal zone macrophage-associated gene expression identified in (D) via quantitative PCR. Graph shows mean + SEM. Significance compared with wild type is indicated by ***p = 0.003 and ****p < 0.0001 using a t test.
FIGURE 7.
FIGURE 7.
Analysis of tissue macrophages in Csf1r-deficient rats. (A) Formalin-fixed and paraffin-embedded livers were stained with an Ab against CD68. Whole slide images were produced with a NanoZoomer slide scanner and exported as jpeg files with NDP.view2 software. Scale bar, 100 μm. (B) The area of CD68+ cells was determined from 10 images per liver (at original magnification ×20) using ImageJ (n = 7+/+, 4+/−, and 9−/−). Graph shows mean + SEM. Significance compared with wild type is indicated by **p = 0.0035 using a t test. (C) Peritoneal cavity cells were analyzed by flow cytometry for expression of SIRPα and CD11b/c. Dead cells were excluded with propidium iodide, and quadrants were set with isotype controls. (D) Graph shows mean + SEM of CD11b/c+SIRPα+ peritoneal macrophages. Significance compared with wild type/heterozygotes is indicated by ****p < 0.0001 using a t test (n = 3). Decalcified femurs from adult rats were either stained with (E) H&E or stained for expression of (F) TRAP and (G) CD68. The boxed growth plate in (E) shows the area of TRAP staining. Images are representative of five rats per genotype. Scale bar, 200 μm (H&E), 500 μm (CD68), or 50 μm (TRAP). Whole slide images were produced with a NanoZoomer slide scanner and images exported with NDP.view2 software. (H) Epidermal sheets were prepared from the ears of adult rats and immunostained for MHC-II (red). Nuclear staining was performed using Hoechst 33258 (blue). Epidermal sheets were imaged as z-stacks (25 μm) using a Zeiss LSM710 confocal microscope. MHC-II and nuclei signals were acquired with 633 and 405 nm lasers, respectively. (I) Maximum intensity projections were produced from the z-stacks and MHC-II+ cells were quantified as per (102). Graph shows mean +SEM. Significance compared with wild type/heterozygotes is indicated by ****p < 0.0001 using a t test. Images are representative of four rats per genotype, two z-stacks analyzed per rat. Scale bar, 50 μm. (J) Formalin-fixed and paraffin-embedded dorsal skin was immunostained for MRC1 expression. Image is representative of 2+/+ and 3−/− adult rats per genotype and two repeat experiments. Arrows point to MRC1+ dermal macrophages. Whole slide images were produced with a NanoZoomer slide scanner and images exported with NDP.view2 software. Scale bar, 50 μm. E, epidermis.
FIGURE 8.
FIGURE 8.
Analysis of brains from Csf1r−/− rats. All brains were formalin fixed and paraffin embedded for histology and immunohistochemistry. (A) Brains from 11-wk-old rats were stained with H&E. Images are representative of seven rats per genotype. Scale bar, 5 mm. (B) Adult heads were fixed in formalin and stained with H&E following EDTA decalcification. Image shows olfactory bulbs in situ. Scale bar, 1 mm. Image representative of seven rats per genotype. EPL, external plexiform layer; GL, glomerular layer; IGC, internal granular cell layer of the olfactory bulbs; MCL, mitral cell layer. (C) Formalin-fixed brains from 3-wk-old rats were stained with Luxol fast blue. Arrows point to myelin preservation and myelin pallor in wild type and mutant rats, respectively. Image of three rats per genotype. (D) Adult brains (8–14 wk) were stained with an Ab against IBA1. Scale bar, 1 mm (left) or 100 μm (right). (E) For each rat, 10 20× images of the cortex were analyzed for the percentage of IBA1+ staining using ImageJ (n = 7 per genotype). Graphs show mean + SEM. Significance compared with wild type is indicated by ****p < 0.0001 using a t test. (F and G) Formalin-fixed eyes were stained with an Ab against IBA1. Arrows point to IBA1+ microglia in the inner plexiform layer of the retina. Images are representative of two rats per genotype, two repeat experiments. Scale bar, 250 μm (F) and 50 μm (G).
FIGURE 9.
FIGURE 9.
Further analysis of brains from Csf1r−/− rats. (A) Single-cell suspensions of brain were depleted of myelin and analyzed by flow cytometry for CD11b/c and CD45 expression. Dead cells were excluded with propidium iodide, and blood granulocytes were excluded from Csf1r−/− samples via forward versus side scatter (FSC/SSC). Quadrants were determined using isotype controls. Image is representative of six rats per genotype. (B) Microarray data from dissected striatum, hippocampus, olfactory bulbs, and pituitary gland were used to determine expression ratios for genes associated with the major cell populations of the brain. (C) Choroid plexuses from adult brains stained with an Ab against IBA1. Images are representative of seven rats per genotype. Arrows point to IBA1+ choroid plexus macrophages. Sclae bar, 50 μm (D) Adult brains were stained with an Ab against CD163. Images are representative of seven rats per genotype. Solid arrows point to CD163+ perivascular macrophages. Dotted arrows point to blood vessels. Scale bar, 50 μm. (E) Adult brains were stained with an Ab against MRC1. Images are representative of seven rats per genotype. Solid arrows point to MRC1+ meningeal macrophages in the Csf1r+/+ rat brain. Red arrow points to a monocyte in the Csf1r−/− meninges (M). Scale bar, 50 μm. Whole slide images were produced with a NanoZoomer slide scanner and analyzed with NDP.view2 software (Hamamatsu Photonics).
FIGURE 10.
FIGURE 10.
Network analysis of gene expression in the spleen and brains of Csf1r deficient rats. RMA-normalized microarray data from Supplemental Table I was analyzed with Graphia Pro. Edges have been removed for ease of visualization. Nodes allocated to the same cluster are the same color. Histograms show the averaged expression patterns of all genes in the cluster. Boxed clusters refer to genes affected by loss of Csf1r. Unboxed clusters refer to genes that are tissue specific (*). (A) Key clusters from spleen. All known genes in which no sample reached an intensity of 20 were excluded. Analysis was performed at a Pearson correlation coefficient ≥0.95 (12,305 nodes making 1,746,925 edges). Clustering was performed at an inflation of 2.0 with a minimum cluster size of 10. (B) Key clusters from brain. All known genes in which no sample reached an intensity of 20 were excluded. Analysis was performed at a Pearson correlation coefficient ≥0.85 (11,833 nodes making 3,617,804 edges). Clustering was performed at an inflation of 2.0 with a minimum cluster size of 10. Three clusters (circled numbers) shared gene expression with multiple brain regions: cluster 2 (striatum and hippocampus), cluster 4 (pituitary gland, striatum, and hippocampus), and cluster 6 (olfactory bulb and pituitary gland). Histograms for these clusters are shown in Supplemental Table I.

References

    1. Hoeffel G., Ginhoux F. 2015. Ontogeny of tissue-resident macrophages. Front. Immunol. 6: 486. - PMC - PubMed
    1. Okabe Y., Medzhitov R. 2016. Tissue biology perspective on macrophages. Nat. Immunol. 17: 9–17. - PubMed
    1. Garceau V., Smith J., Paton I. R., Davey M., Fares M. A., Sester D. P., Burt D. W., Hume D. A. 2010. Pivotal advance: avian colony-stimulating factor 1 (CSF-1), interleukin-34 (IL-34), and CSF-1 receptor genes and gene products. J. Leukoc. Biol. 87: 753–764. - PubMed
    1. Sasmono R. T., Oceandy D., Pollard J. W., Tong W., Pavli P., Wainwright B. J., Ostrowski M. C., Himes S. R., Hume D. A. 2003. A macrophage colony-stimulating factor receptor-green fluorescent protein transgene is expressed throughout the mononuclear phagocyte system of the mouse. Blood 101: 1155–1163. - PubMed
    1. Balic A., Garcia-Morales C., Vervelde L., Gilhooley H., Sherman A., Garceau V., Gutowska M. W., Burt D. W., Kaiser P., Hume D. A., Sang H. M. 2014. Visualisation of chicken macrophages using transgenic reporter genes: insights into the development of the avian macrophage lineage. Development 141: 3255–3265. - PMC - PubMed

Publication types

Substances