. 2018 Sep 24;19(10):2898.
doi: 10.3390/ijms19102898.

Pioglitazone Protects Mesenchymal Stem Cells against P-Cresol-Induced Mitochondrial Dysfunction via Up-Regulation of PINK-1

Affiliations

Pioglitazone Protects Mesenchymal Stem Cells against P-Cresol-Induced Mitochondrial Dysfunction via Up-Regulation of PINK-1

Yeo Min Yoon et al. Int J Mol Sci. .

Abstract

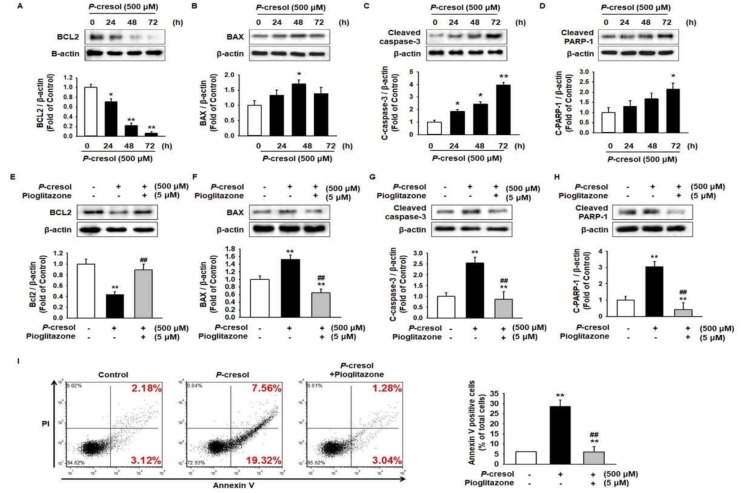
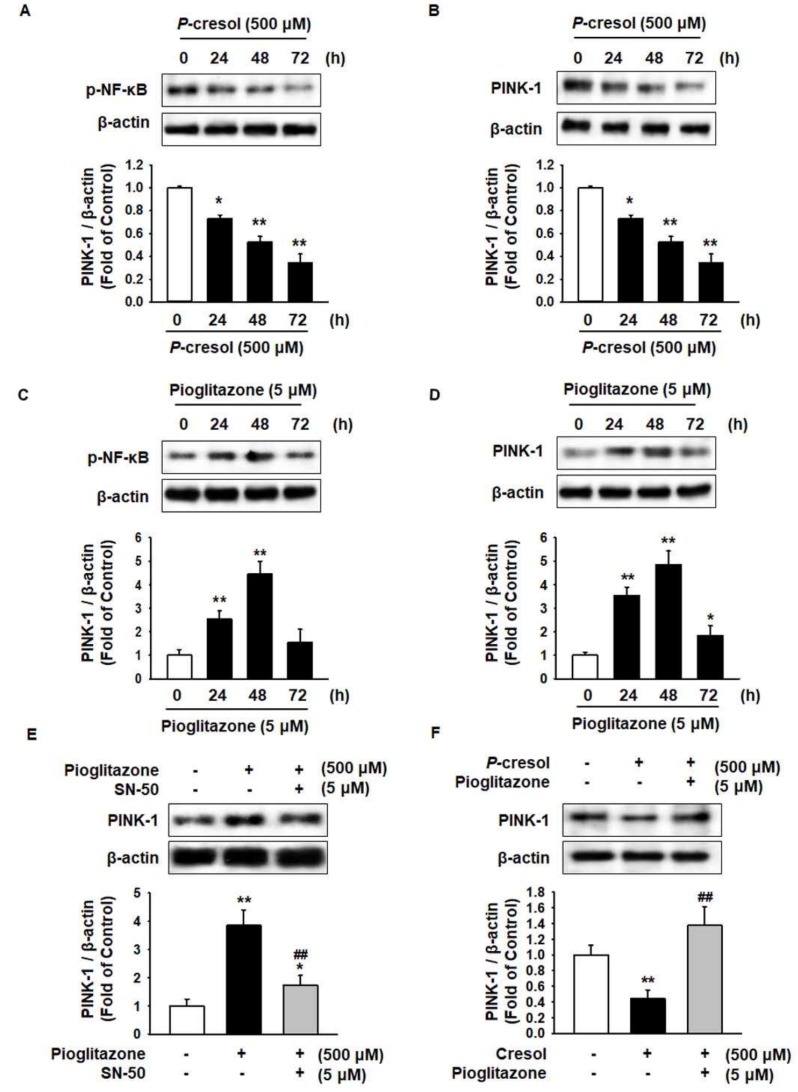
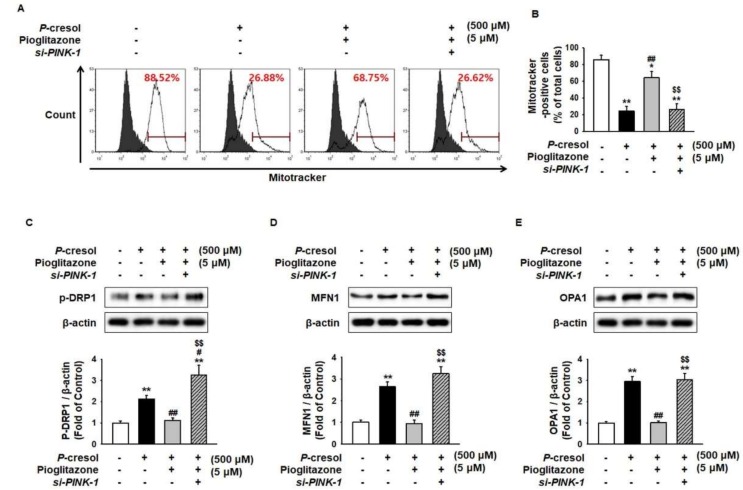
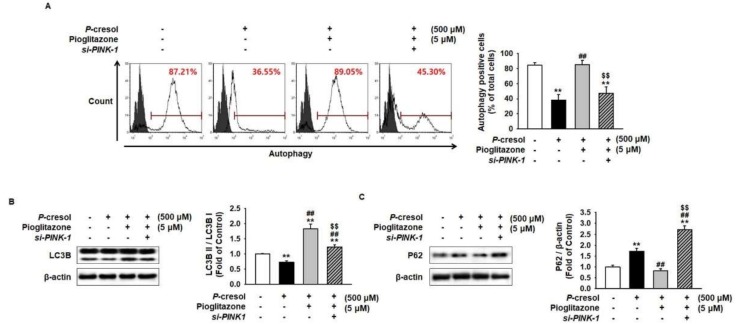
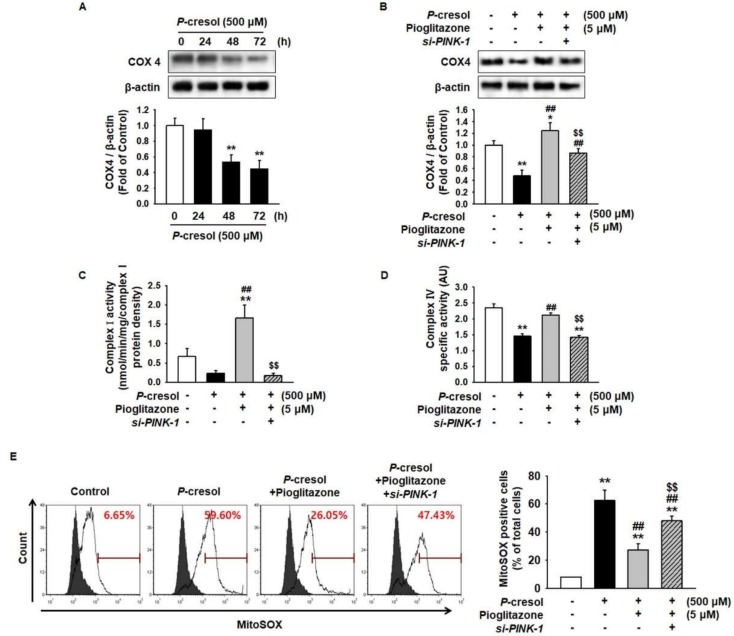
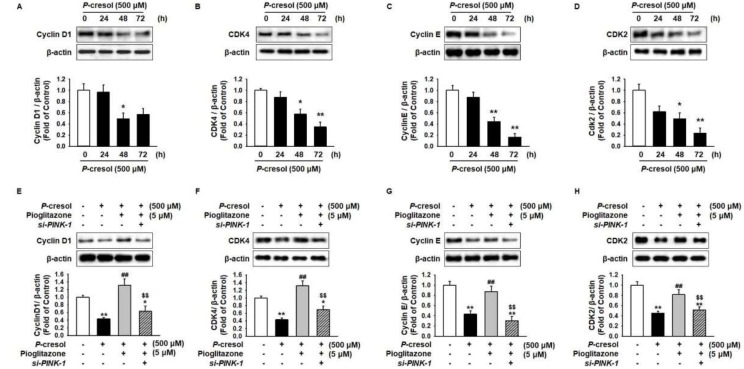
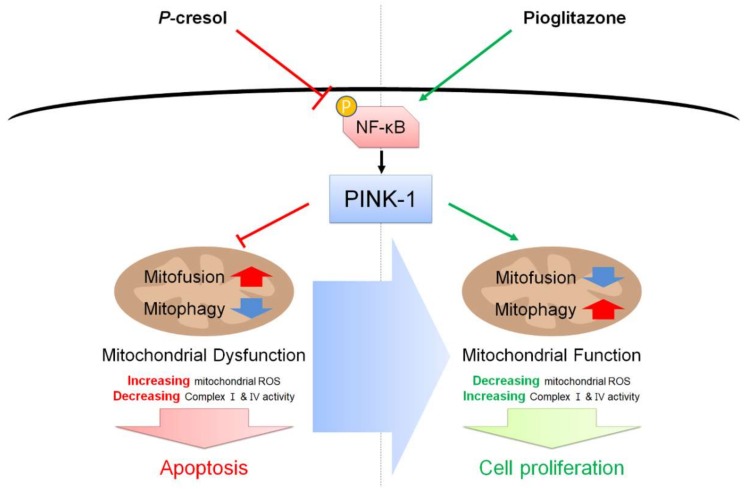
Mesenchymal stem cells (MSC) could be a candidate for cell-based therapy in chronic kidney disease (CKD); however, the uremic toxin in patients with CKD restricts the therapeutic efficacy of MSCs. To address this problem, we explored the effect of pioglitazone as a measure against exposure to the uremic toxin P-cresol (PC) in MSCs. Under PC exposure conditions, apoptosis of MSCs was induced, as well as PC-induced dysfunction of mitochondria by augmentation of mitofusion, reduction of mitophagy, and inactivation of mitochondrial complexes I and IV. Treatment of MSCs with pioglitazone significantly inhibited PC-induced apoptosis. Pioglitazone also prevented PC-induced mitofusion and increased mitophagy against PC exposure through up-regulation of phosphatase and tensin homolog (PTEN)-induced putative kinase 1 (PINK-1). Furthermore, pioglitazone protected against PC-induced mitochondrial dysfunction by increasing the cytochrome c oxidase subunit 4 (COX4) level and activating complexes I and IV, resulting in enhancement of proliferation. In particular, activation of nuclear factor κ-light-chain-enhancer of activated B cells (NF-κB) regulated the pioglitazone-mediated up-regulation of PINK-1. These results indicate that pioglitazone protects MSCs against PC-induced accumulated mitochondrial dysfunction via the NF-κB⁻PINK-1 axis under P-cresol exposure conditions. Our study suggests that pioglitazone-treated MSCs could be a candidate for MSC-based therapy in patients with CKD.

Keywords: PTEN-induced putative kinase 1; cell proliferation; chronic kidney disease; mesenchymal stem cell; pioglitazone.


Conflict of interest statement

The authors declare no conflict of interest.

Figures

Figure 1
Figure 1
Pioglitazone-treated mesenchymal stem cells (MSCs) and induced apoptosis on exposure to P-cresol (PC). (AD) Western blot was used to analyze the expression of apoptosis-associated proteins BCL2, BAX, cleaved caspase-3, and cleaved PARP-1 in MSCs exposed to PC (500 μM) for 0, 24, 48, and 72 h. The expression levels were determined by densitometry relative to β-actin. Values represent the mean ± standard error of the mean (SEM). * p < 0.05, and ** p < 0.01 vs untreated MSCs. (EH) Western blot was used to analyze MSCs pretreated with pioglitazone (5 μM; 24 h) for the expression of apoptosis-associated proteins BCL2, BAX, cleaved caspase-3, and cleaved PARP-1 on exposure to PC. The expression levels were determined by densitometry relative to β-actin. Values represent the mean ± SEM. ** p < 0.01 vs untreated MSCs, ## p < 0.01 vs MSCs exposed to PC. (I) Annexin V and PI positive cells were detected using fluorescence-activated cell sorting (FACS) analysis. Values represent the mean ± SEM. ** p < 0.01 vs untreated MSCs, ## p < 0.01 vs MSCs exposed to PC.
Figure 2
Figure 2
Pioglitazone-treated MSCs increased the expression of PINK-1 through activation of NF-κB. (A,B) Western blot was used to analyze the activation of p-NF-κB and the expression of PINK-1 in MSCs on exposure to PC (500 μM) for 0, 24, 48, and 72 h. The expression levels were determined by densitometry relative to β-actin. Values represent the mean ± SEM. * p < 0.05 and ** p < 0.01 vs untreated MSCs. (C,D) Western blot was used to analyze the activation of p-NF-κB and the expression of PINK-1 in MSCs treated with pioglitazone (5 μM) for 0, 24, 48, and 72 h. The expression levels were determined by densitometry relative to β-actin. Values represent the mean ± SEM. * p < 0.05 and ** p < 0.01 vs untreated MSCs. (E) Pretreated MSCs with or without NF-κB SN50 cell permeable inhibitory peptide trifluoroacetate salt (SN-50) for 24 h were analyzed via Western blot for the expression of PINK-1 in the treatment with pioglitazone (5 μM; 48 h). The expression levels were determined by densitometry relative to β-actin. Values represent the mean ± SEM. * p < 0.05 and ** p < 0.01 vs untreated MSCs, ## p < 0.01 vs MSCs treated with pioglitazone. (F) MSCs pretreated with or without pioglitazone (5 μM; 48 h) were analyzed via Western blot for the expression of PINK-1 on exposure to PC (500 μM; 48 h). The expression levels were determined by densitometry relative to β-actin. Values represent the mean ± SEM. ** p < 0.01 vs untreated MSCs, ## p < 0.01 vs MSCs exposed to PC.
Figure 3
Figure 3
Pioglitazone-treated MSCs increased mitochondrial fission by increasing expression of PINK-1 on exposure to PC. (A,B) After PC (500 μM) exposure for 72 h, mitochondria were measured using Mitotracker in si-PRNP-transfected MSCs after treatment with pioglitazone (5 μM) for 24 h. Values represent the mean ± SEM. * p < 0.05 and ** p < 0.01 vs untreated MSCs, ## p < 0.01 vs MSCs exposed to PC, $$ p < 0.01 vs MSCs treated with pioglitazone. (CE) After the 72 h PC (500 μM) exposure, Western blot was used to analyze the activation of phosphorylated dynamin-related protein 1 (p-DRP1) and the expression of mitofusin-1 (MFN1) and dynamin-like 120 kDa protein (OPA1) in MSCs after 24 h of treatment of small interfering-RNA PRioN Protein (si-PRNP)-transfected MSCs with pioglitazone (5 μM; 24 h). The expression levels were determined by densitometry relative to β-actin. Values represent the mean ± SEM. ** p < 0.01 vs untreated MSCs, # p < 0.05 and ## p < 0.01 vs MSCs exposed to PC, $$ p < 0.01 vs MSCs treated with pioglitazone.
Figure 4
Figure 4
Pioglitazone-treated MSCs increased mitophagy by increasing PINK-1 on exposure to PC. (A) Autophagy was measured by lysosomal/autophagic vacuole fluorescent staining. Values represent the mean ± SEM. ** p < 0.01 vs untreated MSCs, ## p < 0.01 vs MSCs exposed to PC, $$ p < 0.01 vs MSCs treated with pioglitazone. (B,C) After the 72 h PC (500 μM) exposure, Western blot was used to analyze the expression of LC3B and P62 in MSCs after 24 h treatment of si-PRNP-transfected MSCs with pioglitazone (5 μM; 24 h). The expression levels were determined by densitometry relative to β-actin. Values represent the mean ± SEM. ** p < 0.01 vs untreated MSCs, ## p < 0.01 vs MSCs exposed to PC, $$ p < 0.01 vs MSCs treated with pioglitazone.
Figure 5
Figure 5
Pioglitazone-treated MSCs restored mitochondrial function by increasing PINK-1. (A) Western blot was used to analyze the expression of cytochrome c oxidase subunit 4 (COX4) in MSCs on exposure to PC (500 μM) for 0, 24, 48, and 72 h. The expression levels were determined by densitometry relative to β-actin. Values represent the mean ± SEM. ** p < 0.01 vs untreated MSCs. (B) After the 72 h PC (500 μM) exposure, Western blot was used to analyze the expression of COX4 in MSCs after the 24 h treatment in si-PRNP-transfected MSCs with pioglitazone (5 μM; 24 h). The expression levels were determined by densitometry relative to β-actin. Values represent the mean ± SEM. * p < 0.05 and ** p < 0.01 vs untreated MSCs, ## p < 0.01 vs MSCs exposed to PC, $$ p < 0.01 vs MSCs treated with pioglitazone. (C,D) After exposure to PC (500 μM; 72 h), complex I and IV activity was measured in the MSCs treated with pioglitazone (5 μM; 24 h) by evaluating the expression of PINK-1. Values represent the mean ± SEM. ** p < 0.01 vs untreated MSCs, ## p < 0.01 vs MSCs exposed to PC, $$ p < 0.01 vs MSCs treated with pioglitazone. (E) Mitochondrial ROS was detected by MitoSOX™. The positive MitoSOX™ of MSCs was measured using a flow cytometer. Values represent the mean ± SEM. ** p < 0.01 vs untreated MSCs, ## p < 0.01 vs MSCs exposed to PC, $$ p < 0.01 vs MSCs treated with pioglitazone.
Figure 6
Figure 6
Pioglitazone-treated MSCs increased cell proliferation by regulation of PINK-1. (AD) Western blot was used to analyze the expression of cell-cycle-associated proteins cyclin D1, cyclin-dependent kinase 4 (CDK4), cyclin E, and CDK2 in MSCs on exposure to PC (500 μM) for 0, 24, 48, and 72 h. The expression levels were determined by densitometry relative to β-actin. Values represent the mean ± SEM * p < 0.05 and ** p < 0.01 vs untreated MSCs. (EH) After the 72 h PC (500 μM) exposure, Western blot was used to analyze the expression of COX4 in MSCs after the 24 h treatment of si-PRNP-transfected MSCs with pioglitazone (5 μM; 24 h). The expression levels were determined by densitometry relative to β-actin. Values represent the mean ± SEM. * p < 0.05 and ** p < 0.01 vs untreated MSCs, ## p < 0.01 vs MSCs exposed to PC, $$ p < 0.01 vs MSCs treated with pioglitazone.
Figure 7
Figure 7
Schematic representation of possible mechanisms by which pioglitazone prevents PC-induced dysfunction of mitochondria in MSCs through the NF-κB–PINK-1 signal pathway. Under the PC exposure condition, the activation of NF-κB and the expression of PINK-1 are decreased, resulting in apoptosis induced by dysfunction of mitochondria. Treatment with pioglitazone activates NF-κB and increases the expression of PINK-1 under the PC exposure condition, leading to the reinstatement of function of mitochondria and the augmentation of MSC proliferation. Red thick arrow means up-regulation, and blue thick arrow means down-regulation.

Similar articles

Cited by

References

    1. Lv F.J., Tuan R.S., Cheung K.M., Leung V.Y. Concise review: The surface markers and identity of human mesenchymal stem cells. Stem Cells. 2014;32:1408–1419. doi: 10.1002/stem.1681. - DOI - PubMed
    1. Caplan A.I., Correa D. The MSC: An injury drugstore. Cell Stem Cell. 2011;9:11–15. doi: 10.1016/j.stem.2011.06.008. - DOI - PMC - PubMed
    1. Wu J., Li J., Zhang N., Zhang C. Stem cell-based therapies in ischemic heart diseases: A focus on aspects of microcirculation and inflammation. Basic Res. Cardiol. 2011;106:317–324. doi: 10.1007/s00395-011-0168-x. - DOI - PMC - PubMed
    1. Monsel A., Zhu Y.G., Gennai S., Hao Q., Liu J., Lee J.W. Cell-based therapy for acute organ injury: Preclinical evidence and ongoing clinical trials using mesenchymal stem cells. Anesthesiology. 2014;121:1099–1121. doi: 10.1097/ALN.0000000000000446. - DOI - PMC - PubMed
    1. Lisowska-Myjak B. Uremic toxins and their effects on multiple organ systems. Nephron Clin. Pract. 2014;128:303–311. doi: 10.1159/000369817. - DOI - PubMed