. 2018 Sep 24;9(10):981.
doi: 10.1038/s41419-018-1044-5.

Rapamycin and fasting sustain autophagy response activated by ischemia/reperfusion injury and promote retinal ganglion cell survival

Affiliations

Rapamycin and fasting sustain autophagy response activated by ischemia/reperfusion injury and promote retinal ganglion cell survival

Rossella Russo et al. Cell Death Dis. .

Abstract

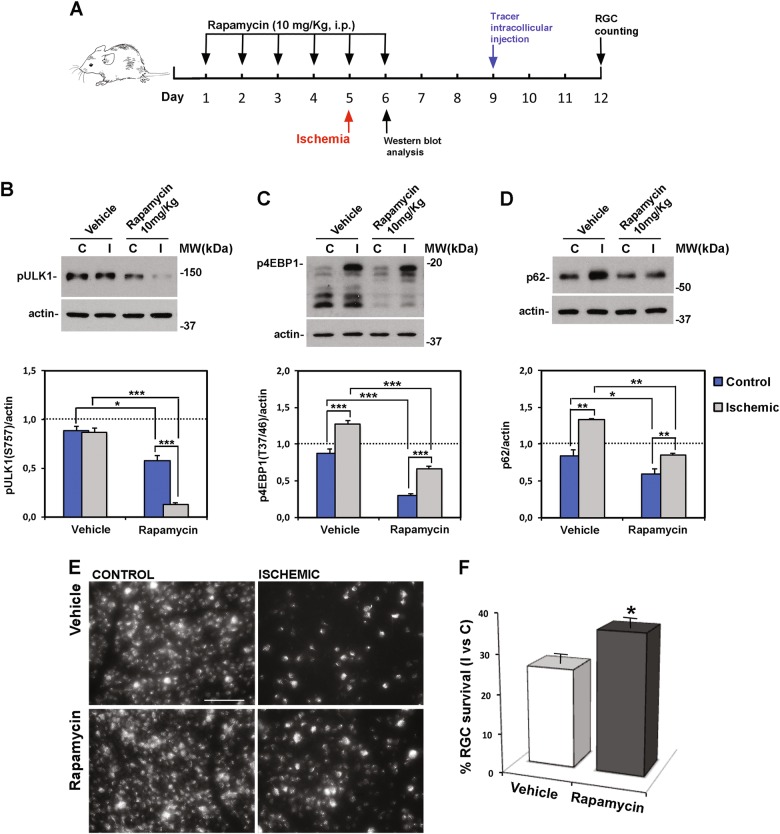
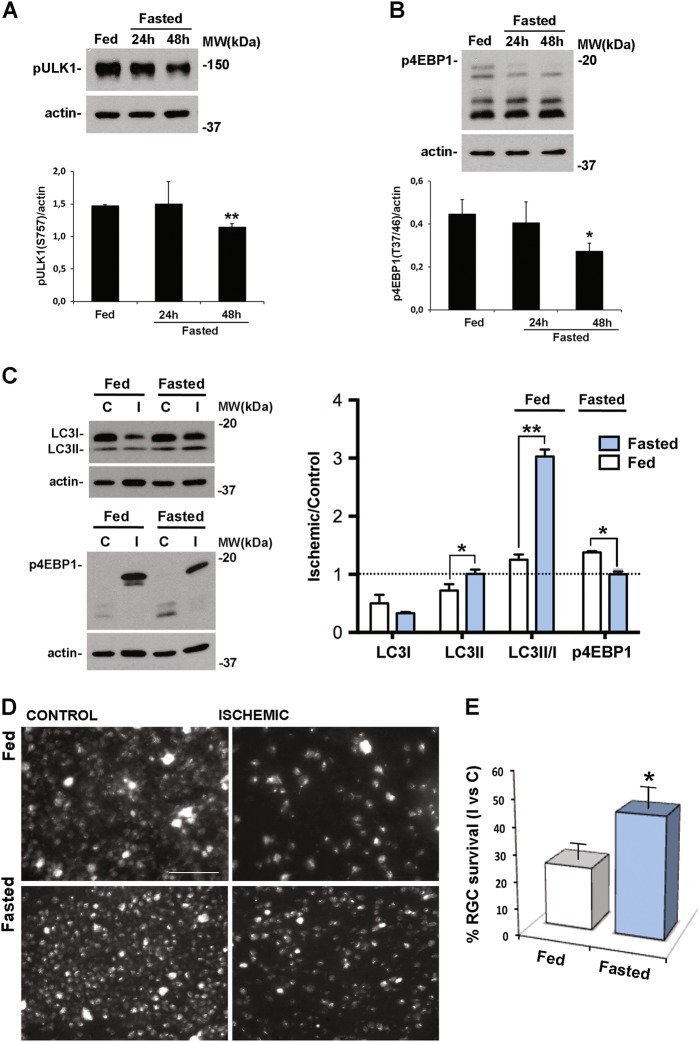
Autophagy, the cellular process responsible for degradation and recycling of cytoplasmic components through the autophagosomal-lysosomal pathway, is fundamental for neuronal homeostasis and its deregulation has been identified as a hallmark of neurodegeneration. Retinal hypoxic-ischemic events occur in several sight-treating disorders, such as central retinal artery occlusion, diabetic retinopathy, and glaucoma, leading to degeneration and loss of retinal ganglion cells. Here we analyzed the autophagic response in the retinas of mice subjected to ischemia induced by transient elevation of intraocular pressure, reporting a biphasic and reperfusion time-dependent modulation of the process. Ischemic insult triggered in the retina an acute induction of autophagy that lasted during the first hours of reperfusion. This early upregulation of the autophagic flux limited RGC death, as demonstrated by the increased neuronal loss observed in mice with genetic impairment of basal autophagy owing to heterozygous ablation of the autophagy-positive modulator Ambra1 (Ambra1+/gt). Upregulation of autophagy was exhausted 24 h after the ischemic event and reduced autophagosomal turnover was associated with build up of the autophagic substrate SQSTM-1/p62, decreased ATG12-ATG5 conjugate, ATG4 and BECN1/Beclin1 expression. Animal fasting or subchronic systemic treatment with rapamycin sustained and prolonged autophagy activation and improved RGC survival, providing proof of principle for autophagy induction as a potential therapeutic strategy in retinal neurodegenerative conditions associated with hypoxic/ischemic stresses.


Conflict of interest statement

The authors declare that they have no conflict of interest.

Figures

Fig. 1
Fig. 1. Modulation and distribution of LC3 following retinal ischemia/reperfusion injury.
Mice were subjected to retinal ischemia in the right eye (I) for 60 min and killed after 0, 1, 6, or 24 h. For each animal, retina from contralateral eye was used as control. A Immunoblot showing the time-dependent modulation of LC3 expression in whole retinal lysates at the indicated time of reperfusion (Rep time). Histograms represent the densitometric analysis of the bands expressed as B LC3I and C LC3II normalized to loading control (actin). Dashed lines indicate the baseline expression of the protein in non-ischemic retinas set to 1. Data are reported as mean ± s.e.m. (4–6 independent experiments for each group). #P < 0.05 vs control non-ischemic retina (Student’s t test); *P < 0.05 vs 1 and 24 h of reperfusion (ANOVA followed by Tukey–Kramer multiple comparisons test); ***P < 0.001 vs 0 h of reperfusion (Student’s t test). C, control non-ischemic retina; I, ischemic retina; MW, molecular weight; Short Exp, short exposure; Long Exp, longer exposure. D Confocal images showing the upregulation of endogenous fluorescence in retinas of GFP-LC3 transgenic mice subjected to ischemia and killed after 6 h of reperfusion. The inserts are higher magnification photomicrographs showing the signal distribution in GCL and IPL. E colocalization of GFP-LC3 signal with the RGC marker TUJ1 (red) in ischemic retinas reperfused for 6 h. F Representative retinal tissue sections from GFP-LC3 transgenic mice showing the partial colocalization of lysosomal marker LAMP-2 (red) with GFP-LC3-positive round-shaped vesicles (white arrowhead) at the ganglion cell layer (GCL) of the ischemic retina. Images are representative of three animals per experimental conditions. Frozen tissue sections were prepared as described in the methods and nuclei counterstained with DAPI (blue). GCL, ganglion cell layer; IPL, inner plexiform layer; INL, inner nuclear layer; ONL, outer nuclear layer. Scale bars D 50 μm, E 47.62 μm F 50 μm. G Immunoblot showing the ex vivo analysis of autophagic flux in retinas subjected to ischemia (I, Isch) followed by 6 h of reperfusion as compared with non-ischemic retinas (C, Ctr). Samples from individual retinas were split in half and incubated for 2 h in medium with (NH4Cl/Leu) or without (vehicle) ammonium chloride (NH4Cl, 20 mM) and leupeptin (Leu, 200 μM) to inhibit lysosomal enzymatic activity. Histograms show the densitometric analysis of the bands normalized on internal control (actin). Data are reported as mean ± s.e.m. of three independent experiments. *P < 0.05, **P < 0.01 (Student’s t test)
Fig. 2
Fig. 2. Changes of SQSTM-1/p62 levels following retinal ischemia reperfusion.
A Western blotting analysis reporting the reperfusion time-dependent modulation of SQSTM-1/p62. SQSTM-1/p62 expression decreased in the ischemic retina as compared with contralateral after 6 h of reperfusion, whereas accumulated at 24 h. Histograms show the densitometric analysis of the bands normalized to loading control (actin) and reported as mean ± s.e.m. (3–6 independent experiments for each group). Dashed line indicates the baseline expression of the protein of interest in control non-ischemic retinas set to 1. #P < 0.05 vs C (Student’s t test); *P < 0.05, **P < 0.01 (ANOVA followed by Tukey–Kramer for multiple comparisons test). C, control non-ischemic retina; I, ischemic retina; MW, molecular weight; Rep time, reperfusion time. B Representative retinal tissue sections showing SQSTM-1/p62 immunoreactivity in control and ischemic retinas after 24 h of reperfusion. C Colabeling of ischemic retina at 24 h reperfusion with anti-p62 (green) and anti-TUJ1 (red), a RGC-specific marker, demonstrating p62 upregulation in RGC soma (GCL) and dendrites (IPL). Nuclei were counterstained with DAPI (blue). Images are representative of three animals per experimental conditions ONL, outer nuclear layer; OPL, outer plexiform layer; INL, inner nuclear layer; IPL, inner plexiform layer; GCL, ganglion cell layer. Scale bars B 50 μm; C 47.62 μm
Fig. 3
Fig. 3. Ultrastructural analysis of retinas after ischemia/reperfusion injury.
A, B TEM micrographs showing the cytoplasm of cells in GLC. C–E In retinas subjected to 6 h reperfusion, abundant autophagosomes (arrows), characterized by a double-limiting membrane, are detected in the cells. F–H After 24 h reperfusion, autophagic compartments (arrowheads) accumulating in the cytoplasm are visible. Asterisk: phagophore; m: mitochondria; n: nucleus. Boxed area in c is shown at higher magnification in c’. Scale bars 500 nm A, H; 200 nm B, D, C’, E, G; 1 μm C, F
Fig. 4
Fig. 4. Time-dependent changes of ATG proteins expression following ischemia/reperfusion injury.
Immunoblotting of A ATG12-ATG5 conjugate and B ATG4 showing a significant decrease of the indicated proteins in the ischemic retina after 24 h of reperfusion. C Reduced levels of BECN1 were reported in the retinas subjected to ischemia plus 6 h of reperfusion and associated with the accumulation of a 50 kDa proteolytic fragment (figure box). Note that fragment was detectable only by longer exposure time leading to the saturation of the full-length band (long exp, longer exposure). For each animal, retina from contralateral eye was used as control. Histograms represent the densitometric analysis of the bands normalized to loading control (actin). Dashed lines indicate the baseline expression of the protein in non-ischemic retinas set to 1. Data are reported as mean ± s.e.m. (3–4 independent experiments for each group). #P < 0.05, ##P < 0.01 vs. control non-ischemic retina (Student’s t test). C, control non-ischemic retina; I, ischemic eye; MW, molecular weight; Rep time, reperfusion time
Fig. 5
Fig. 5. Time-dependent modulation of mTOR signaling pathway upon retinal ischemia.
Retinal ischemia was induced in the right eye and mice were killed after 0, 1, 6, or 24 h of reperfusion. For each animal, contralateral non-ischemic retina was used as control. The phosphorylation level of A mTOR (p-mTOR), C AMPK (pAMPK), and D Akt (p-Akt) was studied in whole retinal lysates by western blotting. mTOR activity was indirectly checked by analyzing the state of phosphorylation of its downstream targets A ULK1 and B 4EBP1. Histograms represent the densitometric analysis of the bands normalized to loading control (actin). Dashed lines indicate the baseline expression of the protein in non-ischemic retinas set to 1. Data are reported as mean ± s.e.m. of 3–7 independent experiments for each group. #P < 0.05, ##P < 0.01, ###P < 0.001 vs control non-ischemic retina (Student’s t test). C, control non-ischemic retina; I, ischemic retina; MW, molecular weight; Rep time, reperfusion time
Fig. 6
Fig. 6. Rapamycin promotes autophagy and increases RGC survival following retinal ischemia/reperfusion.
A Rapamycin treatment schedule. Rapamycin (10 mg/Kg) or vehicle were injected i.p. once a day for 6 consecutive days; ischemia was induced the fifth day and mice killed after 24 h for the biochemical analysis B, C, D or 7 days for evaluation of RGC survival E, F. Western blotting analysis of B ULK and C 4EBP1 phosphorylation levels was performed to indirectly check the inhibition of mTOR activity in the retina of rapamycin-treated mice. p-ULK (S757) and p4EBP (T37/46) were reduced in control and ischemic retinas from rapamycin-treated mice as compared with both control and ischemic retinas of vehicle-treated mice. D Rapamycin reduced basal p62 expression in non-ischemic retina as compared with vehicle-treated control and prevented the accumulation of p62 in the ischemic retinas at 24 h of reperfusion. Histograms represent the densitometric analysis of the bands normalized by the internal loading control (actin). Data are reported as mean ± s.e.m. of three independent experiments for each group. *P < 0.05, **P < 0.01, ***P < 0.001 (ANOVA followed by Tukey–Kramer for multiple comparisons test). C, control non-ischemic retina; I, ischemic retina; MW, molecular weight. E Representative fluorescent photomicrographs of whole-mount ischemic and control retinas from vehicle and rapamycin-treated mice. Systemic treatment with rapamycin significantly increased the percentage of FluoroGold-labeled RGCs in the ischemic retinas as compared with vehicle-treated animals. Images are representative of three independent experiments. Scale bar 75 μm. F Histogram reports the result of RGC count. Twenty images per retina were acquired and the total number of labeled cells in the ischemic retina I was compared with contralateral, non-ischemic retina C and expressed as percentage of RGC survival. Results are reported as mean ± s.e.m. of three independent experiments. *P < 0.05 (Student’s t test)
Fig. 7
Fig. 7. Fasting downregulates mTOR activity and upregulates autophagy in the retina and prevents RGC loss induced by ischemia/reperfusion injury.
Representative western blotting showing the downregulation of A ULK1 and B 4EBP1 phosphorylation in naive retina from mice subjected to 48, but not 24, hours fasting as compared with retinas from fed animals. In C, D, and E animals fasted for 48 h were subjected to retinal ischemia and killed after 24 h C or 7 days D, E. C Western blot analysis showing a significant increase of LC3II in both control and ischemic retinas from fasted animals as compared with fed. Significant decrease of the phosphorylated form of 4EBP1 (p-4EBP1) in the ischemic retinas of fasted mice as compared with fed was also reported. The results of the densitometric analysis of the autoradiographic bands reported in the graph show the comparison between the relative levels of the protein of interest in fasted vs fed animals. Values were normalized to loading control (actin). Data are shown as mean ± s.e.m. of 3–4 independent experiments for each experimental group. *P < 0.05, **P < 0.01 vs Fed (Student’s t test). c, control eye; I, ischemic eye; MW, molecular weight D Representative fluorescent photomicrographs of whole-mount ischemic and control retinas from fasted and fed animals. Fasting significantly increased the percentage of FluoroGold-labeled RGCs in the ischemic retinas as compared with fed animals. Images are representative of three independent experiments. Histogram in E reports the quantification of RGC survival under the different diet regimens. Thirty-two images per retina were acquired and the total number of labeled cells in the ischemic retina I was compared with contralateral, non-ischemic retina C, and expressed as percentage of RGC survival. Results are reported as mean ± s.e.m. of three independent experiments. *P < 0.05 (Student’s t test). Scale bar 75 μm
Fig. 8
Fig. 8. Reduced basal autophagy in Ambra1+/gt mice increases RGC death induced by ischemia/reperfusion injury.
A murine embryonic fibroblasts (MEFs) dissected from Ambra1+/+; GFP-LC3 (n = 2), Ambra1+/gt; GFP-LC3 (n = 3) and Ambra1gt/gt; GFP-LC3 (n = 1) embryos were grown in control (CTR) or starvation medium (EBSS, for 30 min). Where indicated, 20 μM chloroquine was added to CTR/EBSS media. The number of cells positive for GFP-LC3 dots is reported in the graph (cells with more than 10 dots were considered positive for GFP-LC3 dots). Scale bar: 10 µM. Bars represent mean ± s.e.m. with 80 cells analyzed per sample. *P < 0.05; ***P < 0.0005 (Student’s t test). B Representative fluorescent photomicrograph of whole-mount retinas showing the reduction of FluoroGold-labeled RGCs in the ischemic retina of autophagy deficient Ambra1+/gt mice as compared with non-ischemic contralateral retina and ischemic retinas from wild-type mice (WT). Scale bar 75 μm. Histograms in C report the quantification (expressed as % of survival) of RGC 7 days after the injury in the ischemic retina I as compared with contralateral non-ischemic retina C. RGC survival was significantly decreased in autophagy deficient mice (Ambra1+/gt) as compared with WT. Results are reported as mean ± s.e.m. of three independent experiments. *P < 0.05 (Student’s t test). D Representative immunoblotting showing changes of LC3 expression in Ambra1+/gt transgenic mice subjected to retinal ischemia as compared with wild type. Animals were killed at 0, 6, or 24 h of reperfusion. D Histograms represent the densitometric analysis of the bands normalized to loading control (actin). Dashed lines indicate the baseline expression of the protein in non-ischemic retinas set to 1. Data are reported as mean ± s.e.m. (4–6 independent experiments for each group). *P < 0.05, **P < 0.01, ***P < 0.001 (ANOVA followed by Tukey–Kramer for multiple comparisons test). C, control non-ischemic eye; I, ischemic eye; MW, molecular weight; Rep time, reperfusion time

References

    1. Mizushima N, Yoshimori T, Ohsumi Y. The role of Atg proteins in autophagosome formation. Annu. Rev. Cell. Dev. Biol. 2011;27:107–132. doi: 10.1146/annurev-cellbio-092910-154005. - DOI - PubMed
    1. Ariosa AR, Klionsky DJ. Autophagy core machinery: overcoming spatial barriers in neurons. J. Mol. Med (Berl.) 2016;94:1217–1227. doi: 10.1007/s00109-016-1461-9. - DOI - PMC - PubMed
    1. Klionsky DJ, et al. Guidelines for the use and interpretation of assays for monitoring autophagy (3rd edition) Autophagy. 2016;12:1–222. doi: 10.1080/15548627.2015.1100356. - DOI - PMC - PubMed
    1. Bento CF, et al. Mammalian autophagy: how does it work? Annu. Rev. Biochem. 2016;85:685–713. doi: 10.1146/annurev-biochem-060815-014556. - DOI - PubMed
    1. Hu Z, Yang B, Mo X, Xiao H. Mechanism and regulation of autophagy and its role in neuronal diseases. Mol. Neurobiol. 2015;52:1190–1209. doi: 10.1007/s12035-014-8921-4. - DOI - PubMed

Publication types

MeSH terms