

Transcriptional Regulatory Networks in Hepatitis C Virus-induced Hepatocellular Carcinoma
- PMID: 30250040
- PMCID: PMC6155139
- DOI: 10.1038/s41598-018-32464-5
Transcriptional Regulatory Networks in Hepatitis C Virus-induced Hepatocellular Carcinoma
Abstract
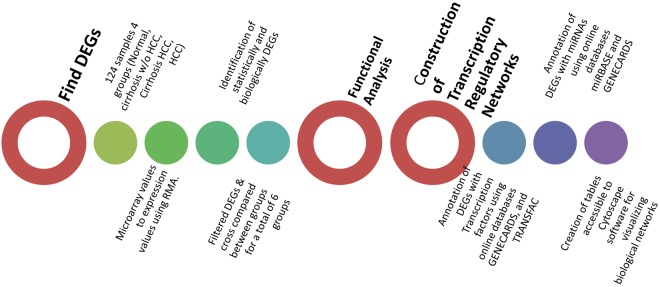
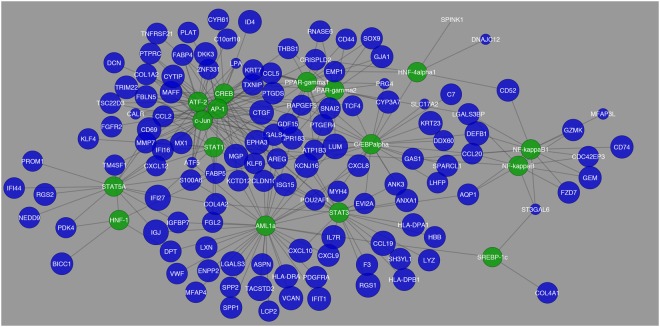
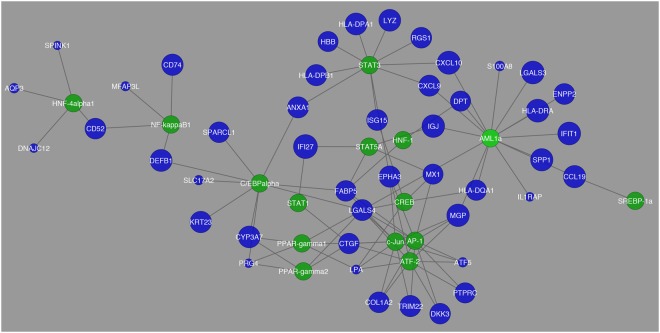
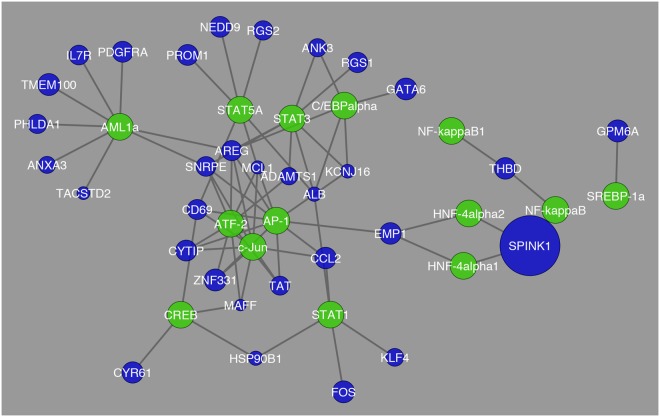
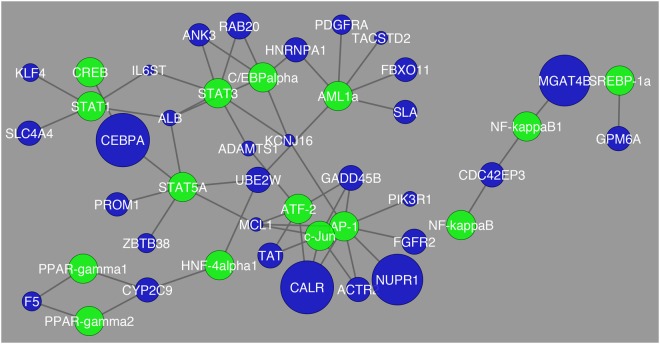
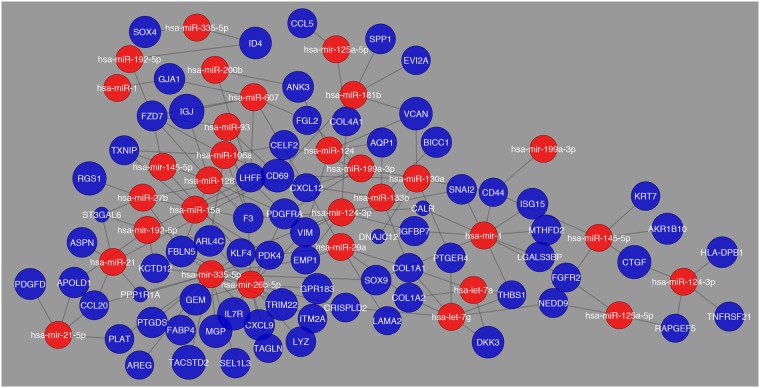
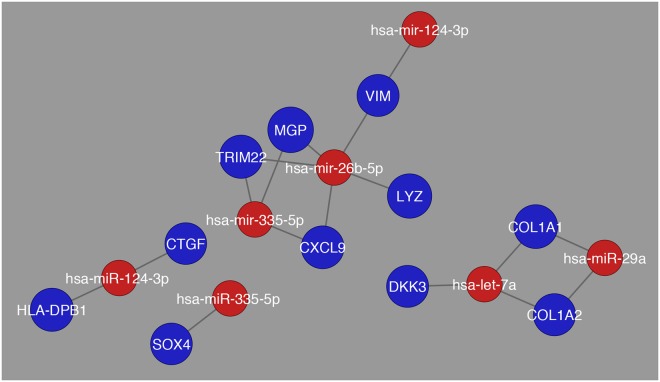
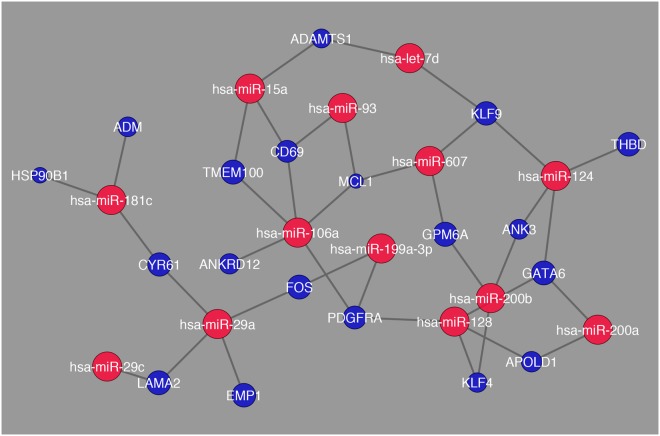
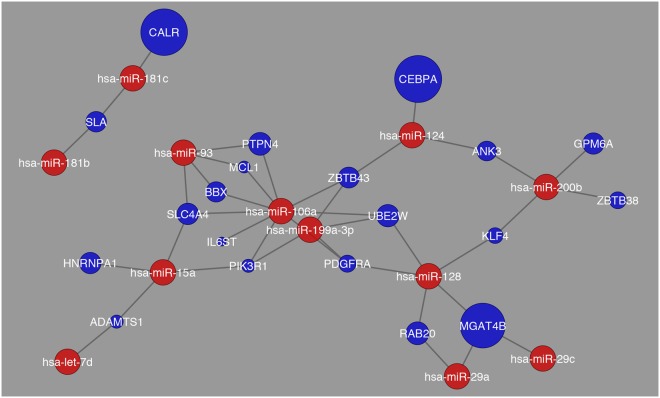
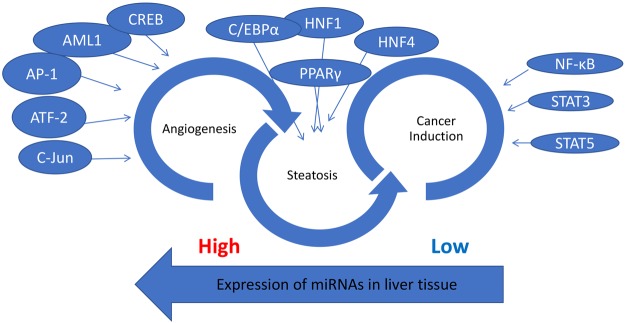
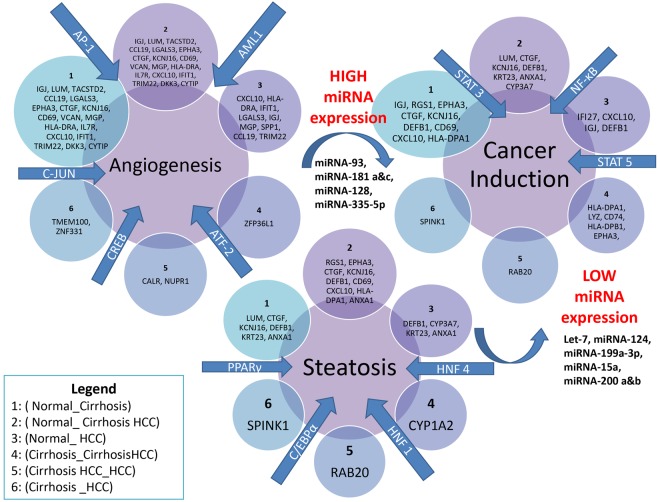
Understanding the transcriptional regulatory elements that influence the progression of liver disease in the presence of hepatitis C virus (HCV) infection is critical for the development of diagnostic and therapeutic approaches. Systems biology provides a roadmap by which these elements may be integrated. In this study, a previously published dataset of 124 microarray samples was analyzed in order to determine differentially expressed genes across four tissue types/conditions (normal, cirrhosis, cirrhosis HCC, and HCC). Differentially expressed genes were assessed for their functional clustering and those genes were annotated with their potential transcription factors and miRNAs. Transcriptional regulatory networks were constructed for each pairwise comparison between the 4 tissue types/conditions. Based on our analysis, it is predicted that the disruption in the regulation of transcription factors such as AP-1, PPARγ, and NF-κB could contribute to the liver progression from cirrhosis to steatosis and eventually to HCC. Whereas the condition of the liver digresses, the downregulation of miRNAs' (such as miR-27, Let-7, and miR-106a) expression makes the transition of the liver through each pathological stage more apparent. This preliminary data can be used to guide future experimental work. An understanding of the transcriptional regulatory attributes acts as a road map to help design interference strategies in order to target the key regulators of progression of HCV induced HCC.
Conflict of interest statement
The authors declare no competing interests.
Figures
Similar articles
-
Genes involved in viral carcinogenesis and tumor initiation in hepatitis C virus-induced hepatocellular carcinoma.Mol Med. 2009 Mar-Apr;15(3-4):85-94. doi: 10.2119/molmed.2008.00110. Epub 2008 Dec 15. Mol Med. 2009. PMID: 19098997 Free PMC article.
-
Identification of invasion-metastasis-associated microRNAs in hepatocellular carcinoma based on bioinformatic analysis and experimental validation.J Transl Med. 2018 Sep 29;16(1):266. doi: 10.1186/s12967-018-1639-8. J Transl Med. 2018. PMID: 30268144 Free PMC article.
-
Gene expression, regulation of DEN and HBx induced HCC mice models and comparisons of tumor, para-tumor and normal tissues.BMC Cancer. 2017 Dec 18;17(1):862. doi: 10.1186/s12885-017-3860-x. BMC Cancer. 2017. PMID: 29254483 Free PMC article.
-
Liver stem cells: implications for hepatocarcinogenesis.Stem Cell Rev. 2005;1(3):253-60. doi: 10.1385/SCR:1:3:253. Stem Cell Rev. 2005. PMID: 17142862 Review.
-
Hepatitis B virus and microRNAs: Complex interactions affecting hepatitis B virus replication and hepatitis B virus-associated diseases.World J Gastroenterol. 2015 Jun 28;21(24):7375-99. doi: 10.3748/wjg.v21.i24.7375. World J Gastroenterol. 2015. PMID: 26139985 Free PMC article. Review.
Cited by
-
Non-Coding RNAs: Regulating Disease Progression and Therapy Resistance in Hepatocellular Carcinoma.Cancers (Basel). 2020 May 15;12(5):1243. doi: 10.3390/cancers12051243. Cancers (Basel). 2020. PMID: 32429062 Free PMC article. Review.
-
Identification of CD206 as a potential biomarker of cancer stem-like cells and therapeutic agent in liver cancer.Oncol Lett. 2019 Sep;18(3):3218-3226. doi: 10.3892/ol.2019.10673. Epub 2019 Jul 26. Oncol Lett. 2019. PMID: 31452799 Free PMC article.
-
The Relevance of MicroRNAs in the Pathogenesis and Prognosis of HCV-Disease: The Emergent Role of miR-17-92 in Cryoglobulinemic Vasculitis.Viruses. 2020 Nov 29;12(12):1364. doi: 10.3390/v12121364. Viruses. 2020. PMID: 33260407 Free PMC article.
-
Fibrosis and Hepatocarcinogenesis: Role of Gene-Environment Interactions in Liver Disease Progression.Int J Mol Sci. 2024 Aug 8;25(16):8641. doi: 10.3390/ijms25168641. Int J Mol Sci. 2024. PMID: 39201329 Free PMC article. Review.
-
Hepatitis C virus core protein: Not just a nucleocapsid building block, but an immunity and inflammation modulator.Tzu Chi Med J. 2021 Sep 24;34(2):139-147. doi: 10.4103/tcmj.tcmj_97_21. eCollection 2022 Apr-Jun. Tzu Chi Med J. 2021. PMID: 35465281 Free PMC article. Review.
References
MeSH terms
Substances
LinkOut - more resources
Full Text Sources
Other Literature Sources
Medical
