. 2018 Sep 24;8(1):14268.
doi: 10.1038/s41598-018-32532-w.

Malic Enzyme 1 (ME1) is pro-oncogenic in ApcMin/+ mice

Affiliations

Malic Enzyme 1 (ME1) is pro-oncogenic in ApcMin/+ mice

Lorenzo M Fernandes et al. Sci Rep. .

Abstract

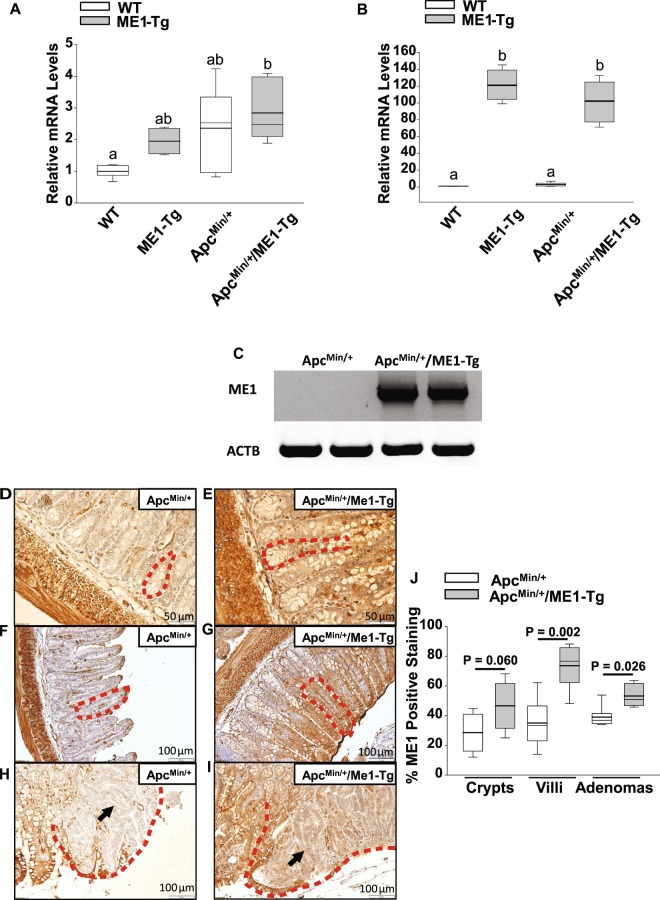
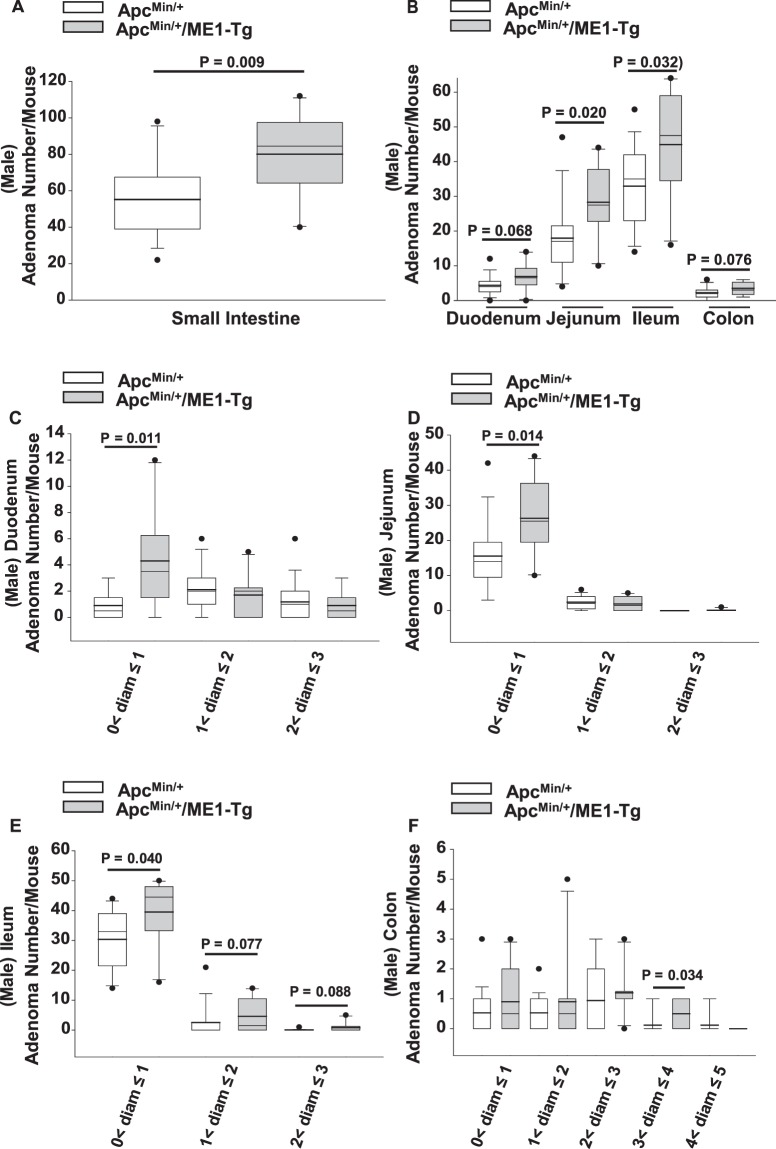
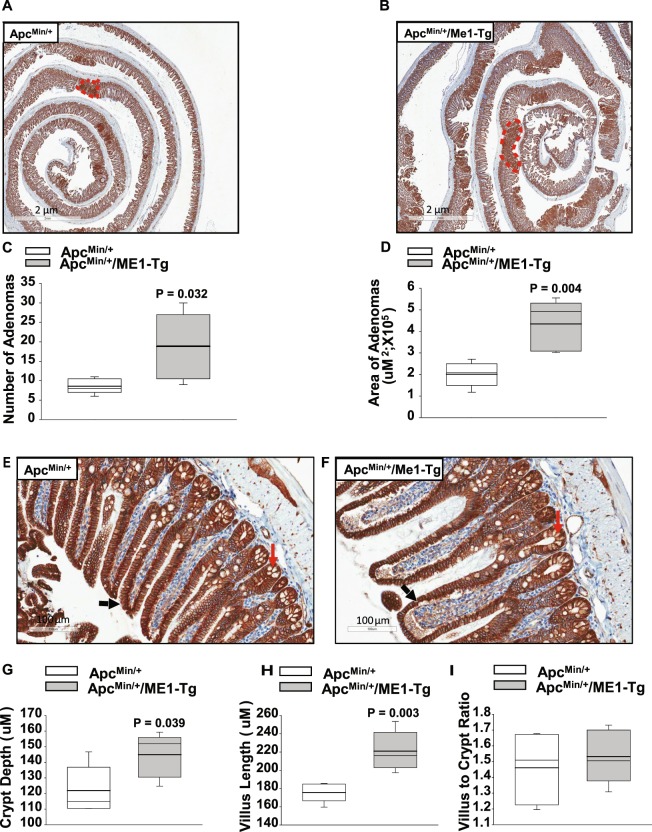
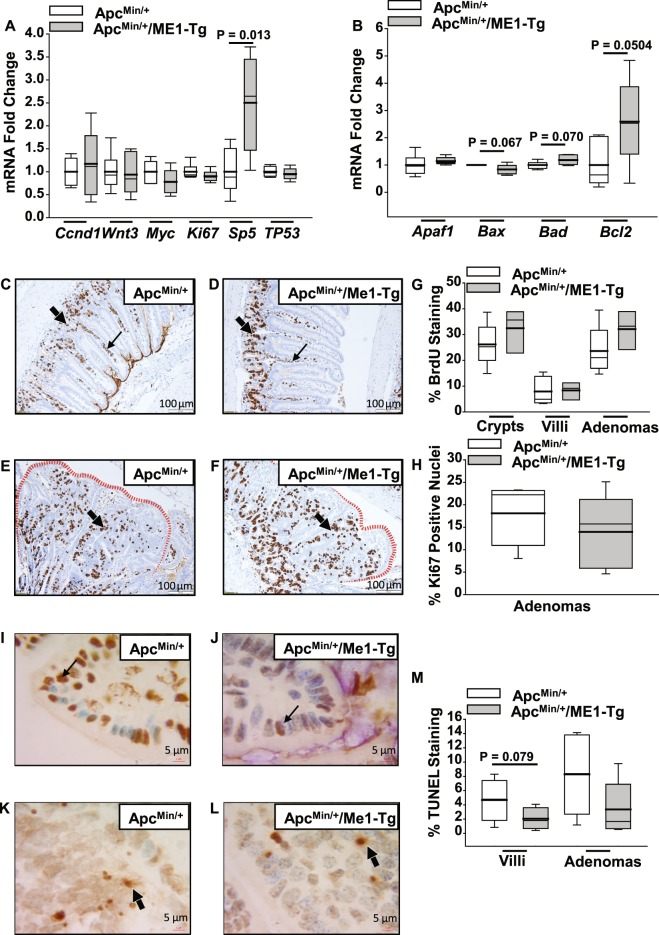
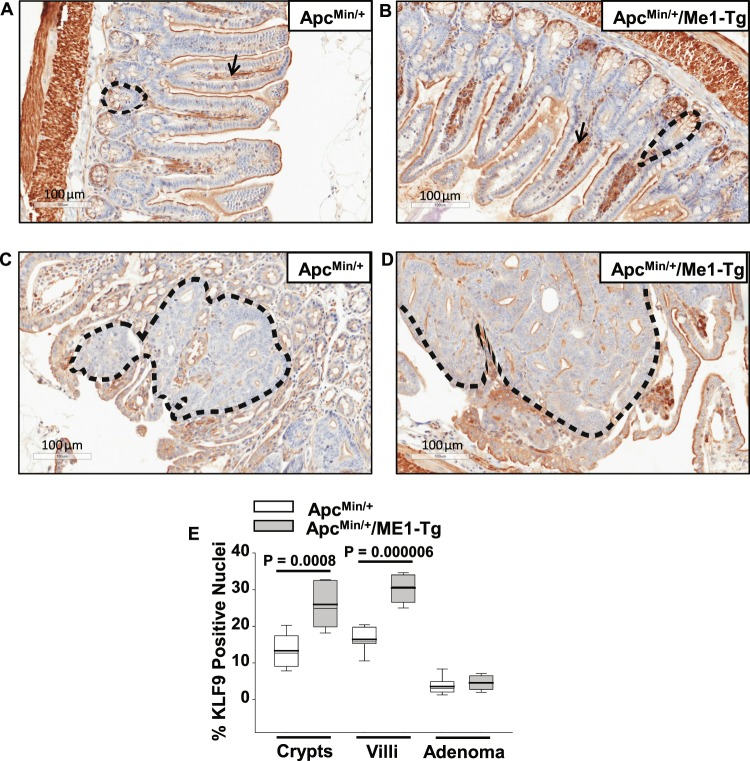
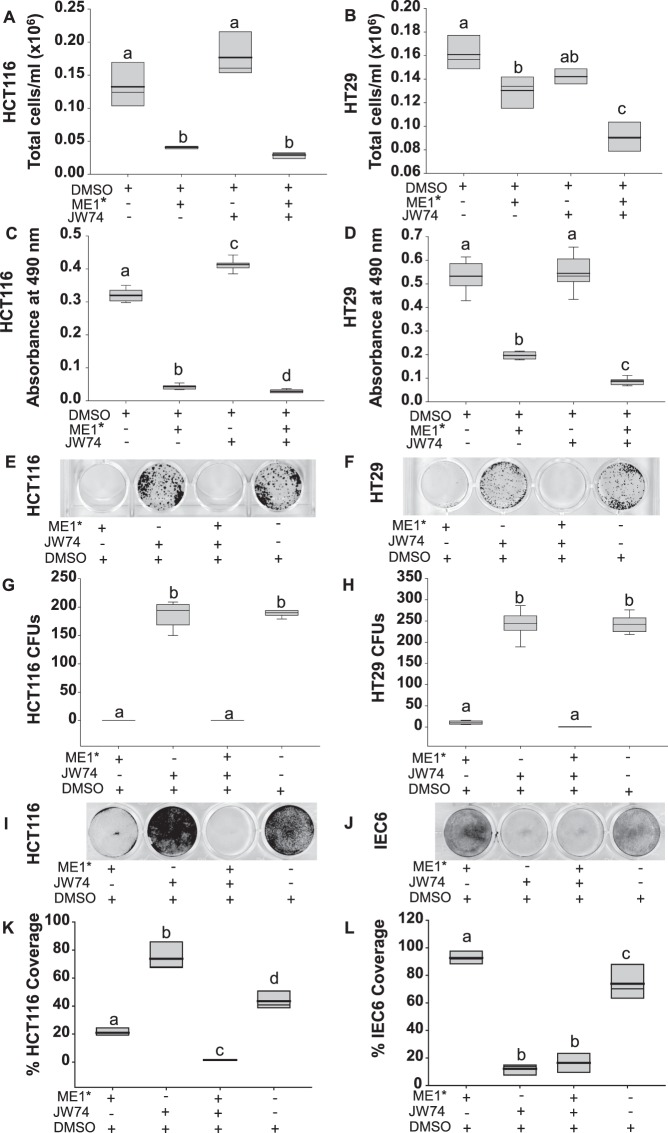
Cytosolic Malic Enzyme (ME1) provides reduced NADP for anabolism and maintenance of redox status. To examine the role of ME1 in tumor genesis of the gastrointestinal tract, we crossed mice having augmented intestinal epithelial expression of ME1 (ME1-Tg mice) with ApcMin/+ mice to obtain male ApcMin/+/ME1-Tg mice. ME1 protein levels were significantly greater within gut epithelium and adenomas of male ApcMin/+/ME1-Tg than ApcMin/+ mice. Male ApcMin/+/ME1-Tg mice had larger and greater numbers of adenomas in the small intestine (jejunum and ileum) than male ApcMin/+ mice. Male ApcMin/+/ME1-Tg mice exhibited greater small intestine crypt depth and villus length in non-adenoma regions, correspondent with increased KLF9 protein abundance in crypts and lamina propria. Small intestines of male ApcMin/+/ME1-Tg mice also had enhanced levels of Sp5 mRNA, suggesting Wnt/β-catenin pathway activation. A small molecule inhibitor of ME1 suppressed growth of human CRC cells in vitro, but had little effect on normal rat intestinal epithelial cells. Targeting of ME1 may add to the armentarium of therapies for cancers of the gastrointestinal tract.


Conflict of interest statement

The authors declare no competing interests.

Figures

Figure 1
Figure 1
ME1 expression in ApcMin/+/ME1-Tg mouse intestines. (A) qRT-PCR of mouse Me1 RNA in the jejunums of WT, ME1-Tg, ApcMin/+ and ApcMin/+/ME1-Tg male mice (n = 4–6/group). (B) qRT-PCR of total Me1 (endogenous + transgene-derived) mRNA in the jejunums of WT, ME1-Tg, ApcMin/+ and ApcMin/+/ME1-Tg male mice (n = 4–6/group). One-Way ANOVA was used to examine for differences between groups (All Pairwise Multiple Comparison Procedures; Holm-Sidak method). Different lowercase letters (a, b) designate groups that differ (P < 0.05); however, bars sharing the same letter are not different. (C) Conventional RT-PCR of transgene-expressed Me1 mRNA in ApcMin/+ and ApcMin/+/ME1-Tg male jejunums (n = 2/group). Gel lanes were cropped for purposes of space. The corresponding full-length gels are presented in Supplementary Fig. 7. (D to I) Representative ME1 IHC of Swiss-rolled ilea from ApcMin/+ and ApcMin/+/ME1-Tg male mice. (D,E) crypts (scale bar = 50 μm); (F, G) villi (scale bar = 100 μm); (H,I) adenomas (scale bar = 100 μm). Red dotted lines delineate crypts (D,E), villi (F,G) and adenomas (H,I). Black arrows point to centers of adenomas (H,I). (J) Percentage ME1-positive staining of crypts, villi (epithelium and lamina propria) and adenomas in ilea of male mice. Quantification was via Aperio Imagescope. Boxes demarcate the inter-quartile range of 25–75% with mean (thick line) and median (thin line); (n = 6/group). (J) Student’s t-tests were used to examine for differences in IHC staining intensity of ME1 protein between groups, and the Mann-Whitney Rank Sum Test was used for comparing non-normally distributed data. Significant differences were identified by P < 0.05. A tendency for a difference also is indicated (0.1 > P > 0.05).
Figure 2
Figure 2
Adenoma burden in male ApcMin/+/ME1-Tg mice. (A) Total number of adenomas/mouse in the small intestines of sixteen-week-old ApcMin/+ (n = 17) and ApcMin/+/ME1-Tg (n = 10) male mice. (B) Regional distribution of adenomas in male mice. (C–F) Size distribution of adenomas in the (C) duodenum, (D) jejunum, (E) ileum and (F) colon of sixteen-week-old male ApcMin/+ and ApcMin/+/ME1-Tg mice. Boxes indicate the inter-quartile range (25–75%) with mean (thick line) and median (thin line); whiskers: 10th and 90th percentiles; dots: outliers. Student’s t-tests were used to examine for differences between groups and the Mann-Whitney Rank Sum Test was used for comparing non-normally distributed data. Significant differences were identified by P < 0.05. Tendencies for differences also are indicated (0.1 > P > 0.05).
Figure 3
Figure 3
Increased numbers and sizes of ileal adenomas in sixteen-week-old male ApcMin/+/ME1-Tg mice. (A,B) Representative β-catenin IHC of ilea from ApcMin/+ and ApcMin/+/ME1-Tg male mice (scale bar = 2 μm). A representative adenoma is outlined in red in each panel. (C) Total number of ileal adenomas quantified after β-catenin IHC of male mice (n = 5/group). (D) Area of ileal adenomas (total adenoma area per mouse) quantified after β-catenin IHC (n = 5 male mice/group). (E,F) Representative images of β-catenin-stained ileum showing normal appearing crypts and villi (scale bar = 100 μm). Black and red arrows indicate villi and crypts, respectively. (G) Quantification of ileal crypt depth in ApcMin/+ and ApcMin/+/ME1-Tg male mice (n = 5/group). (H) Quantification of ileal villus length in male mice (n = 5/group). (I) Ratio of villus length to crypt depth in the ilea of male mice (n = 5/group). Boxes indicate the inter-quartile range of 25–75% with mean (thick line) and median (thin line); whiskers extend to the 10th and 90th percentiles. Student’s t-tests were used to examine for differences between genotypes (significant difference, P < 0.05).
Figure 4
Figure 4
Gene expression, proliferation and apoptosis in experimental mice. (A) Fold change of abundance of mRNAs encoding oncogenes and tumor suppressors in jejunums of ApcMin/+ and ApcMin/+/ME1-Tg male mice (n = 5–6/group). (B) Fold change of mRNAs encoding apoptosis-related proteins in mouse jejunums (n = 5–6 mice/group). (C,D) Representative images of BrdU-labeled crypts and villi in ilea of male mice. Thin and thick arrows indicate villus and crypt, respectively. (E,F) Representative BrdU-labeled/stained adenomas of male mice. Red dotted lines highlight adenoma borders. Arrows indicate adenoma centers (scale bar = 100 μm). (G) Quantification of percentage BrdU-positive cells in ileal crypts, villi, and adenomas of male mice (n = 3–5 mice/group). (H) % of cells with nuclear Ki67 IHC staining in ileal adenomas of male mice (n = 5 mice/group). (I,J) TUNEL-positive cells in villi of male ApcMin/+ and ApcMin/+/ME1-Tg mice, respectively (scale bar = 5 μm). Arrows identify representative TUNEL-positive cells. (K,L) TUNEL-positive cells in ileal adenomas of male ApcMin/+ and ApcMin/+/ME1-Tg mice (scale bar = 5 μm). Arrows indicate representative TUNEL-positive cells. (M) Quantification of percentage-positive ileal TUNEL staining (n = 5–6 mice/group). Boxes indicate the inter-quartile range of 25–75% with mean (thick line) and median (thin line); whiskers extend to 10th and 90th percentiles. Student’s t-tests were used to examine for differences between groups and the Mann-Whitney Rank Sum Test was used for non-normally distributed data. Significant differences were identified by P < 0.05. Tendencies for differences also are indicated (0.1 > P > 0.05).
Figure 5
Figure 5
Increased KLF9 immunoreactivity in ileal crypts and lamina propria of sixteen-week-old male ApcMin/+/ME1-Tg mice. (A,B) Representative images of KLF9-positive cells in crypts (black dotted line), villi (epithelium and lamina propria), and muscularis of ApcMin/+ and ApcMin/+/ME1-Tg male mice (scale bar = 100 μm). Black arrows indicate representative KLF9 staining in the lamina propria. (C,D) KLF9 IHC of ileal adenomas from male mice (scale bar = 100 μm). Representative adenomas are outlined. (E) Quantification of KLF9 IHC results (n = 7 mice/group). Quantification was via the Aperio Imagescope nuclear algorithm. Boxes demarcate the inter-quartile range of 25–75% with mean (thick line) and median (thin line); whiskers: 10th and 90th percentiles. Student’s t-tests were used to examine for differences between genotypes.
Figure 6
Figure 6
A small molecule inhibitor of ME1 suppressed colon cancer cell numbers in vitro. (A,B) Number of viable HCT116 and HT29 cells after treatment with 50 uM of ME1 inhibitor (ME1*), 15 uM of Wnt pathway inhibitor (JW74), 50 uM ME1* plus 15 uM JW74, or vehicle (DMSO). Twenty thousand cells/well were plated and 24 h later received inhibitor(s). Cells were evaluated after 72 h of treatment (n = 3 wells/treatment group, data are representative of 2 independent experiments). (C,D) Results of MTS cell proliferation/cytotoxicity assay. Cells were plated at a density of 1000 cells per/well and 24 h later received treatments (50 uM ME1*, 15 uM JW74, 50 uM ME1* plus 15 uM JW74, or vehicle (DMSO)). Absorbance (490 nm) was measured at 48 h after treatment addition; n = 8 wells/treatment group, data are representative of 2 independent experiments. (E,F) Results of clonogenic assay. HCT116 or HT29 cells were plated at a density of 1000 cells/well and after 24 h were treated with 50 uM ME1*, 15 uM JW74, 50 uM ME1* plus 15 uM JW74, or vehicle (DMSO). After incubation for six days, cells were stained with crystal violet. (G,H) Quantification of colony forming units (CFU) from (E,F) after treatment of cells (n = 6 wells/treatment group). (I,J) Results of modified clonogenic assay. HCT116 and IEC6 cells were plated at very high density (100,000 cells/well) and after 24 h were treated with 50 uM ME1*, 15 uM JW74, 50 uM ME1* plus 15 uM JW74, or vehicle (DMSO). After 3 days, cells were stained with crystal violet. (K,L) Quantification of remaining cells from (I,J) expressed as % area of stained cells per well. Boxes show the inter-quartile range of 25–75% with mean (thick line) and median (thin line); whiskers: 10th and 90th percentiles. One way ANOVA was used to examine for differences between treatment groups. Different lowercase letters (a-d) designate groups that differ (P < 0.05); bars sharing the same letter are not significantly different.

References

    1. Balsa-Martinez E, Puigserver P. Cancer cells hijack gluconeogenic enzymes to fuel cell growth. Molecular Cell. 2015;60:509–511. doi: 10.1016/j.molcel.2015.11.005. - DOI - PubMed
    1. Pavlova NN, Thompson CB. The emerging hallmarks of cancer metabolism. Cell Metabolism. 2016;23:27–47. doi: 10.1016/j.cmet.2015.12.006. - DOI - PMC - PubMed
    1. Hjelmeland A, Zhang J. Metabolic, autophagic, and mitophagic activities in cancer initiation and progression. Biomedical Journal. 2016;39:98–106. doi: 10.1016/j.bj.2015.10.002. - DOI - PMC - PubMed
    1. Vander Heiden MG, DeBerardinis RJ. Understanding the intersections between metabolism and cancer biology. Cell. 2017;168:657–669. doi: 10.1016/j.cell.2016.12.039. - DOI - PMC - PubMed
    1. Satoh K, et al. Global metabolic reprogramming of colorectal cancer occurs at adenoma stage and is induced by MYC. Proc. Natl. Acad. Sci. USA. 2017;114:E7697–E7706. doi: 10.1073/pnas.1710366114. - DOI - PMC - PubMed

Publication types

MeSH terms

Substances

LinkOut - more resources