. 2018 Oct;20(10):1172-1180.
doi: 10.1038/s41556-018-0199-8. Epub 2018 Sep 24.

Direct induction of microtubule branching by microtubule nucleation factor SSNA1

Affiliations

Direct induction of microtubule branching by microtubule nucleation factor SSNA1

Nirakar Basnet et al. Nat Cell Biol. 2018 Oct.

Abstract

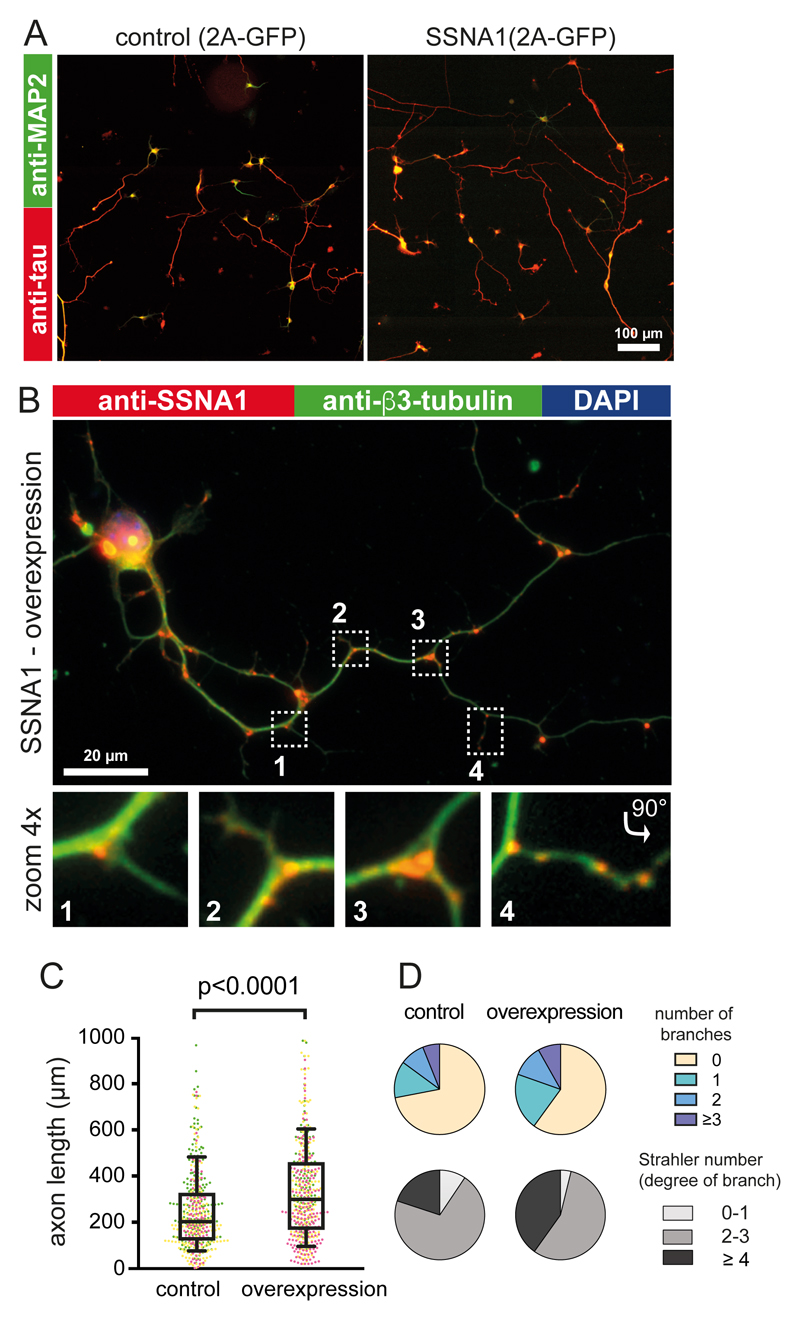
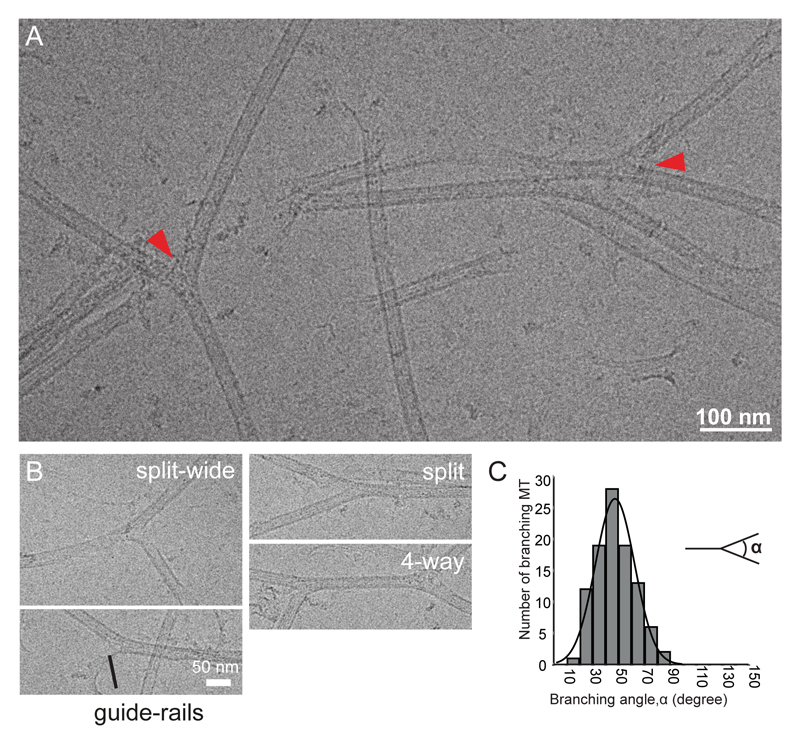
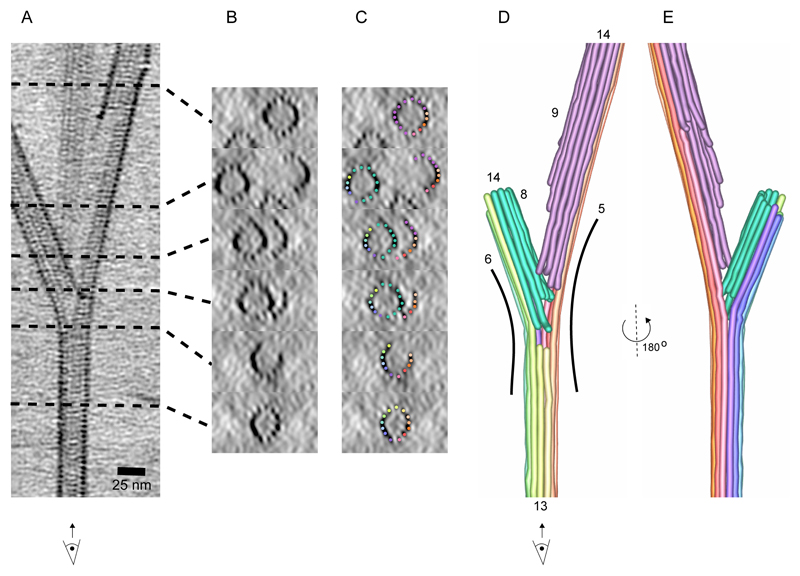
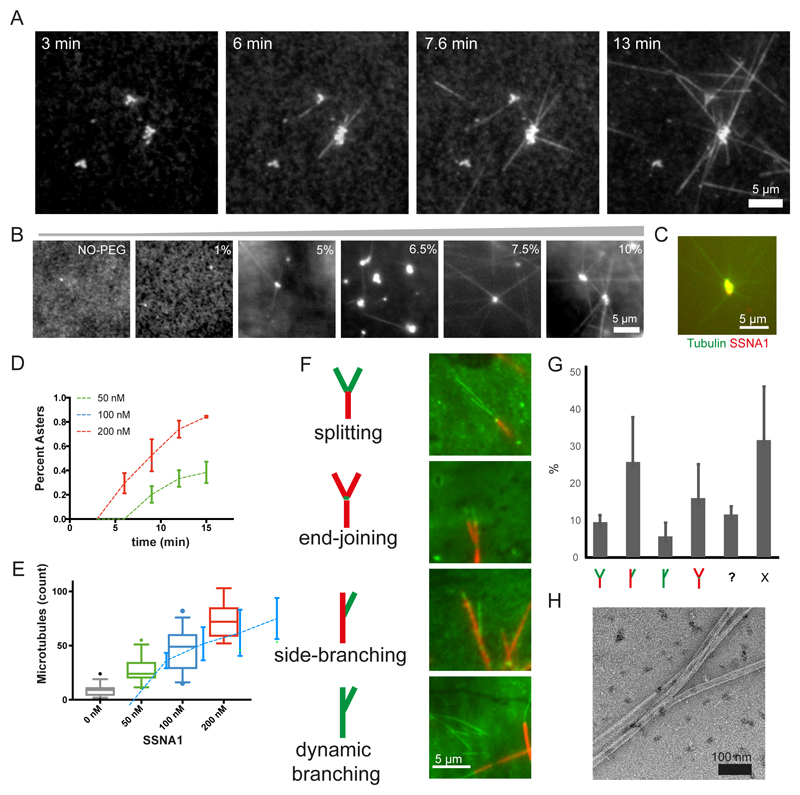
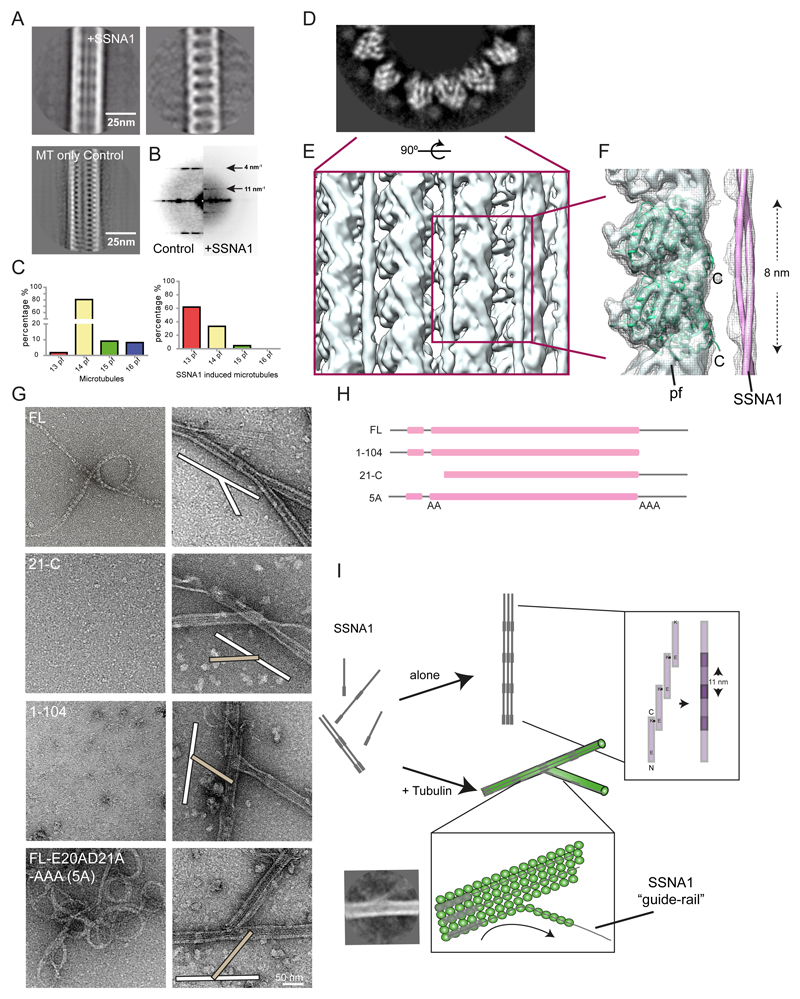
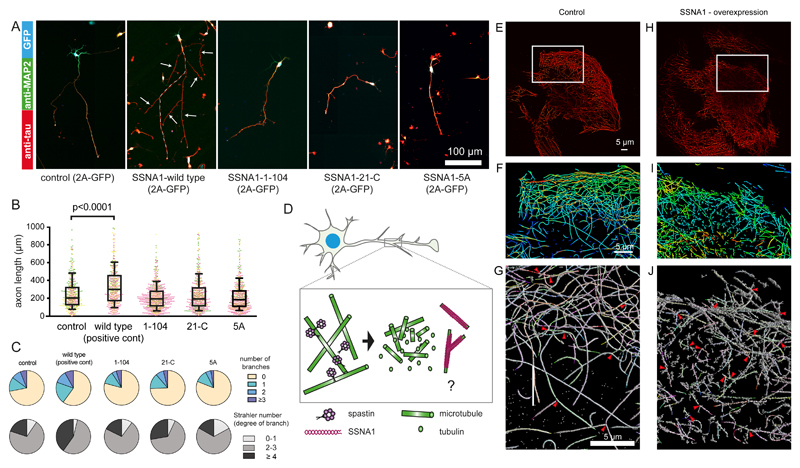
Microtubules are central elements of the eukaryotic cytoskeleton that often function as part of branched networks. Current models for branching include nucleation of new microtubules from severed microtubule seeds or from γ-tubulin recruited to the side of a pre-existing microtubule. Here, we found that microtubules can be directly remodelled into branched structures by the microtubule-remodelling factor SSNA1 (also known as NA14 or DIP13). The branching activity of SSNA1 relies on its ability to self-assemble into fibrils in a head-to-tail fashion. SSNA1 fibrils guide protofilaments of a microtubule to split apart to form daughter microtubules. We further found that SSNA1 localizes at axon branching sites and has a key role in neuronal development. SSNA1 mutants that abolish microtubule branching in vitro also fail to promote axon development and branching when overexpressed in neurons. We have, therefore, discovered a mechanism for microtubule branching and implicated its role in neuronal development.


Figures

Fig. 1
Fig. 1. The effect of SSNA1 overexpression on primary hippocampal neurons.
(A) Immunostaining of MAP2 (green) and Tau (red) in control (GFP over-expression) and mSSNA1 WT over-expression. (B) Immunostaining of SSNA1 (red) and β3-tubulin (green) in mSSNA1 WT overexpressing neurons shows the localization of SSNA1 at axon branch sites. (C) Scatter dot plots of axon length under over-expression of SSNA1. The longest protrusion from soma was defined as axon, and cells with very short protrusions were also included in the counting, so that under-developed neurons could be assessed as well. The promotion of axon development occurs only in over-expression of WT SSNA1. Experiments were performed in triplicates, shown in magenta, green and yellow. Every cell is represented by a single point: Control (n = 505 cells), wild type (n = 499 cells), pooled from 3 independent experiments, and the overlaid box-and-whisker plots cover 50% (boxes) and 90% (whiskers) of the entire population, with median values indicated as lines within the boxes. The results show statistical significance (p < 0.0001) as tested using the Kruskal-Wallis test, followed by Dunn’s multiple comparison post-hoc test. (D) Pie graphs showing the distribution of the number of branches under over-expression conditions (control (n=496 cells), wild type (n=490 cells) pooled from 3 independent experiments) and Strahler number (degree of sub-branch formations on the existing branches), control (n=266 cells), wild type (n=289 cells) pooled from 3 independent experiments. Distributions of the branches and the Strahler number in SSNA1 expressed neurons differ significantly from control (GFP over-expression) according to χ2 two-sample test (χ2= 20.7, p < 0.01 and 18.6, p < 0.005, respectively). See supplementary table 3 for source data.
Fig. 2
Fig. 2. Characterization of in vitro reconstituted microtubule branching.
(A) Cryo-EM image of branched microtubules. Arrowheads show examples of branching points. Microtubules were stabilized with 1mM GMPCPP. (B) Snapshots of branching microtubules. “Guide-rail” depicts thin lines of density often seen at the split of the branch point. (C) Distribution of branching angles (47±15°, n = 99 branch points). These experiments were performed three independent times.
Fig. 3
Fig. 3. The cryo-ET reconstruction of SSNA1-mediated microtubule branch.
(A) A 25-nm slice of a tomographic reconstruction highlighting branching point of a microtubule. With this view, individual protofilaments and tubulin units are visible, but the SSNA1 density is too thin to be visualized. (B) Cross-sections of the branched microtubules in A. (C) Individual protofilaments are overlaid with color represented in the segmentation in D. (D) Tracing of protofilaments of the 3D density map in A. Individual protofilaments are colored in rainbow-color coding. The newly formed protofilaments from the branched microtubules are colored in green (left) and in pink (right). Number of protofilaments in this particular branched microtubule are counted to be 13 (mother microtubule), 14 (left branched microtubule) and 14 (right, branched microtubule). 13 mother protofilaments are split to 6 to the left and 5 to the right side of branched microtubules. (E) 180° rotated segmentation of the branched microtubule.
Fig. 4
Fig. 4. Nucleation and branching of microtubules mediated by CrSSNA1 under various conditions.
(A) Aster-like formation of microtubules (20% HiLyte488 tubulin) occurs within 3 min after mixing tubulin with lower concentration (200 nM) of SSNA1 (upper) under conditions mimicking molecular crowding (7.5% PEG, typically used as a crowding agent), where tubulin alone does not form any polymers. Microtubules propagate out from tubulin concentrate, serving as a nucleation center. These experiments were performed three independent times with similar results. (B) 200 nM SSNA1 and 8 μM tubulin self-associate forming clusters in the presence of PEG with the concentration >~5%. (C) SSNA1 antibody recognizes the microtubule nucleation center. (D) Plot of the percentage of the concentrates growing into asters with microtubules as a function of time (min) in the presence of 50, 100 and 200 nM CrSSNA1. Error bars are mean +/- SD from n=3 independent experiments. As little as 50 nM of CrSSNA1 is sufficient to observe aster formation in the presence of 7.5% PEG. (E) Counts of microtubules observed per field of view, in the presence of different concentrations of CrSSNA1. Box plots cover 50% of the entire population (boxes) and 90% (whiskers) with median values indicated as lines within the boxes. Sample Size: 0 nM: n=42 fields of view, 50nM: n=29, 100nM: n=30, 200nM: n=25. Data were pooled from 3 independent experiments except for the first point (0 nM) for which data were pooled from 4 independent experiments. (F) Green colored dynamic microtubules on red-microtubule GMPCPP seeds in the presence of higher concentration of SSNA1 (30 μM) without molecular crowding agents to achieve globally concentrated conditions. ‘branch-like’ nucleation is observed. Branches were categorized as ‘splitting’, ‘end-joining’, ‘side-branching’ or ‘dynamic branching’ and their ratio (n = 895 branches, mean +/- S.D. pooled from 3 independent experiments) are shown in (G). “?” shows the bundled microtubules, making it difficult to categorize. “X” shows microtubules without branching. Branch-like nucleation can be seen from the locally concentrated SSNA1, condition described in (A-E), however observations of individual microtubules are challenging due to the high local protein concentrations. (H) A negative-stain EM image of SSNA1-mediated branched microtubules in the presence of 200 nM SSNA1 and 7.5% PEG, representative of three independent experiments. See supplementary table 3 for source data.
Fig. 5
Fig. 5. Molecular characterization of the branching action of SSNA1
(A) Left - Representative class average of the SSNA1-induced microtubules, Right – SSNA1 decoration emphasized by computationally subtracting microtubule densities and Left-bottom – Average of microtubules without decoration for comparison. (B) The power spectrum of microtubule class averages shows an additional 11 nm periodicity in the presence of SSNA1. (C) Distribution of protofilament numbers of microtubules reconstituted from brain tubulin in the absence (left) and in the presence of CrSSNA1 (right) shifting the majority from 14- to 13-protofilament microtubules. (D) Grey-scale density map of the plus-end-on view of the SSNA1-microtubule 3D reconstruction. SSNA1 decoration and the secondary structures of tubulin density are well resolved. (E) Rendering of the microtubule surface decorated with SSNA1. The resolution of the microtubule surface (~10 Å) is not as high as the core (< 8 Å) due to the SSNA1 decoration. (F) Tubulin atomic model (PDB ID: 3jal) fitted to the map. The SSNA1 coiled-coil fibril is indicated as a tube representation. Note that the periodical feature of SSNA1 is averaged out because of the symmetrical mismatch between tubulin dimers (8 nm) and SSNA1 fibrils (11 nm). (G) Morphological observation of SSNA1 and its branching activity. Left, observation of the purified protein at 0 h incubation (i.e. immediately after purification), and Right: a magnified view of the copolymerized microtubules. Microtubule branching was observed with FL, while other protein fragments do not facilitate branching. For the proteins that do not cause the branching, examples of typical crossing of microtubules (white and beige bars at the scheme within the image), instead of branching are shown. Detailed observations are available in Fig. S5A. (H) Graphical scheme of SSNA1 constructs used in (G). (I) Scheme of the SSNA1 self-assembly and microtubule nucleation mediated by SSNA1. While SSNA1 oligomers alone can also undergo a slow self-assembly process, the SSNA1 oligomers interact with tubulin dimers to promote their co-polymerization. The polymerized SSNA1 may further act as a guide-rail (bottom inlet) for protofilament splitting, resulting in microtubule branch formation. A class average indicating the guide-rail mechanism is shown. Other class averages are available in Fig. S2E.
Fig. 6
Fig. 6. Effect of various SSNA1 constructs on primary hippocampal neurons and fibroblast cells
(A) Immunostaining of MAP2 (green), Tau (red) and GFP (blue, expression control) in mSSNA1 over-expressing cells. For the SSNA1 WT, the axon is guided with a dotted line. (B) Scatter dot plots of axon length under over-expression of various SSNA1. Control and WT profiles shown in Fig. 1 are placed as a negative and positive control, respectively. The promotion of axon development occurs only in over-expression of WT SSNA1, while no apparent effect was observed for the constructs that fail to mediate microtubule branching. Every cell is represented by a single point, control (n=496 cells), wild type (n=490), 1-104 (n=788), 21-C (n=610), 5A (n=642) from 3 independent experiments, shown in magenta, green and yellow, and the overlaid box-and-whisker plots cover 50% (boxes) and 90% (whiskers) of the entire population, with median values indicated as lines within the boxes. (C) Pie graphs showing the distribution of the number of branches and Strahler number under different over-expression conditions. GFP expression control and SSNA1 WT overexpression profiles in Fig. 1 are placed as controls. (D) Schematic model describing how SSNA1-mediated microtubule nucleation could contribute to axon branch formation. Spastin has been shown to localize at axon branches and to interact with SSNA1. Taken together with our finding of SSNA1 localization at axon branches, it is possible that the two proteins work sequentially by spastin severing microtubules to provide tubulin oligomers, and SSNA1 nucleating microtubules at the branching site. (E) DNA-PAINT image of a 500-nm slice of the microtubule network in SSNA1 over-expressing cells. (F) Zoomed-in view from E - the object is colored in a rainbow code according to the depth. (G) Individually recognized microtubules are highlighted in various colors. 3-way intersections are indicated with red arrowheads. (H-J) Corresponding view of a 500-nm slice of the microtubule network in untreated cells (control). For analysis, 3 independent SSNA1 over-expressing and control cells were assessed each, containing the total microtubule lengths of 5700 μm, 7900 μm and 1900 μm and 7700 μm, 8500 μm, 7700 μm, respectively. See supplementary table 3 for source data.

References

    1. Ishihara K, Nguyen PA, Groen AC, Field CM, Mitchison TJ. Microtubule nucleation remote from centrosomes may explain how asters span large cells. Proc Natl Acad Sci USA. 2014;111:17715–17722. - PMC - PubMed
    1. Meunier S, Vernos I. Acentrosomal Microtubule Assembly in Mitosis: The Where, When, and How. Trends Cell Biol. 2016;26:80–87. - PubMed
    1. Petry S, Vale RD. Microtubule nucleation at the centrosome and beyond. Nat Cell Biol. 2015;17:1089–1093. - PubMed
    1. Kalil K, Dent EW. Branch management: mechanisms of axon branching in the developing vertebrate CNS. Nat Rev Neurosci. 2014;15:7–18. - PMC - PubMed
    1. Lewis TL, Courchet J, Polleux F. Cell biology in neuroscience: Cellular and molecular mechanisms underlying axon formation, growth, and branching. J Cell Biol. 2013;202:837–848. - PMC - PubMed

Publication types