. 2018 Oct;20(10):1159-1171.
doi: 10.1038/s41556-018-0198-9. Epub 2018 Sep 24.

Fam49/CYRI interacts with Rac1 and locally suppresses protrusions

Affiliations

Fam49/CYRI interacts with Rac1 and locally suppresses protrusions

Loic Fort et al. Nat Cell Biol. 2018 Oct.

Abstract

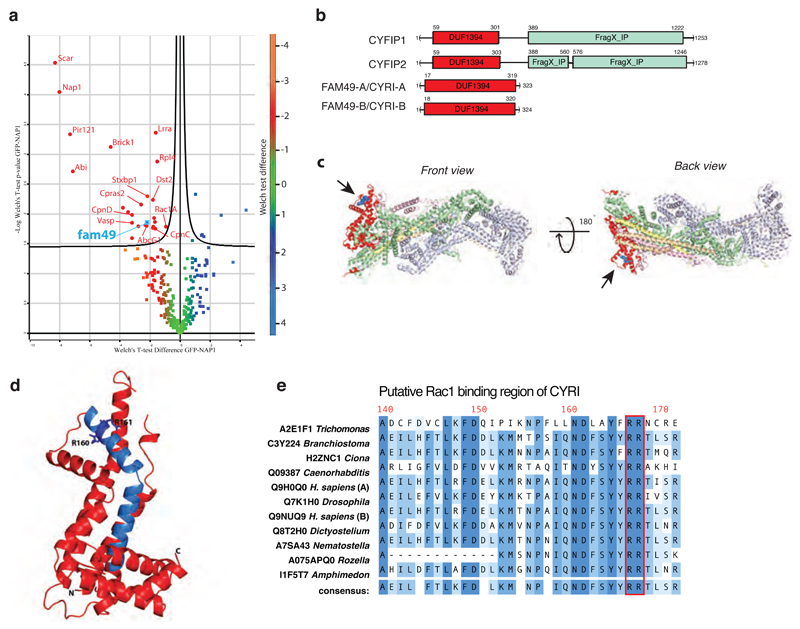
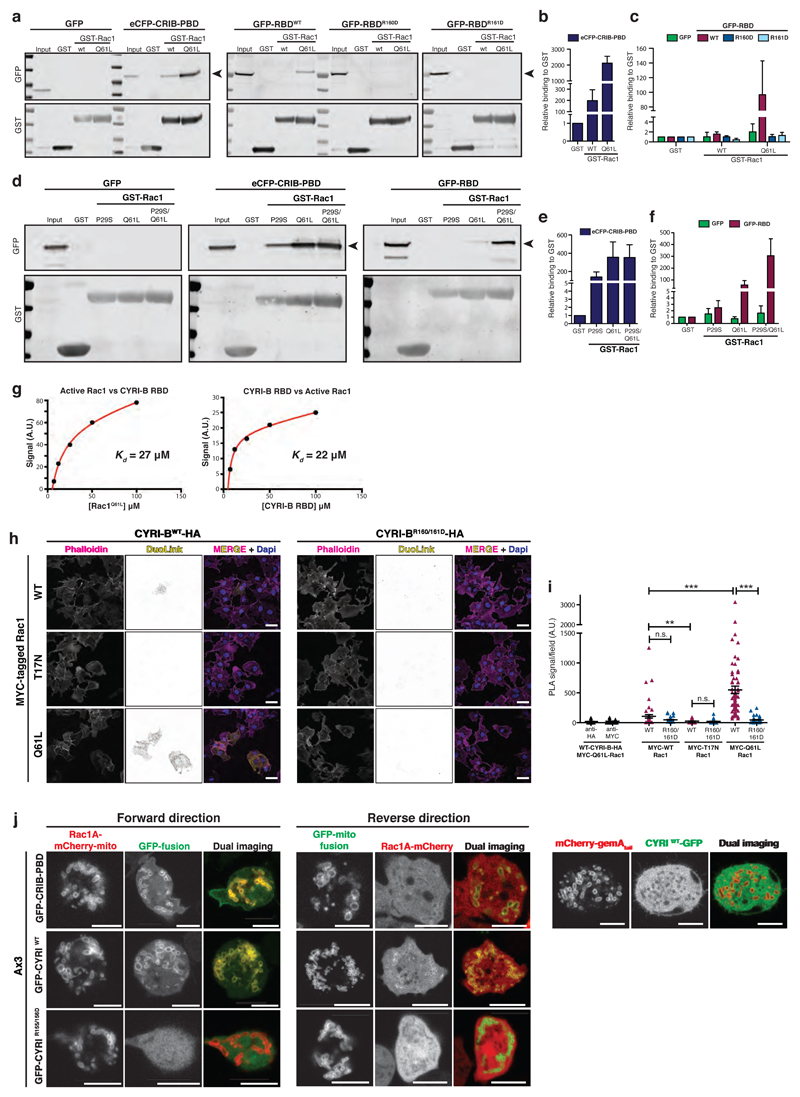
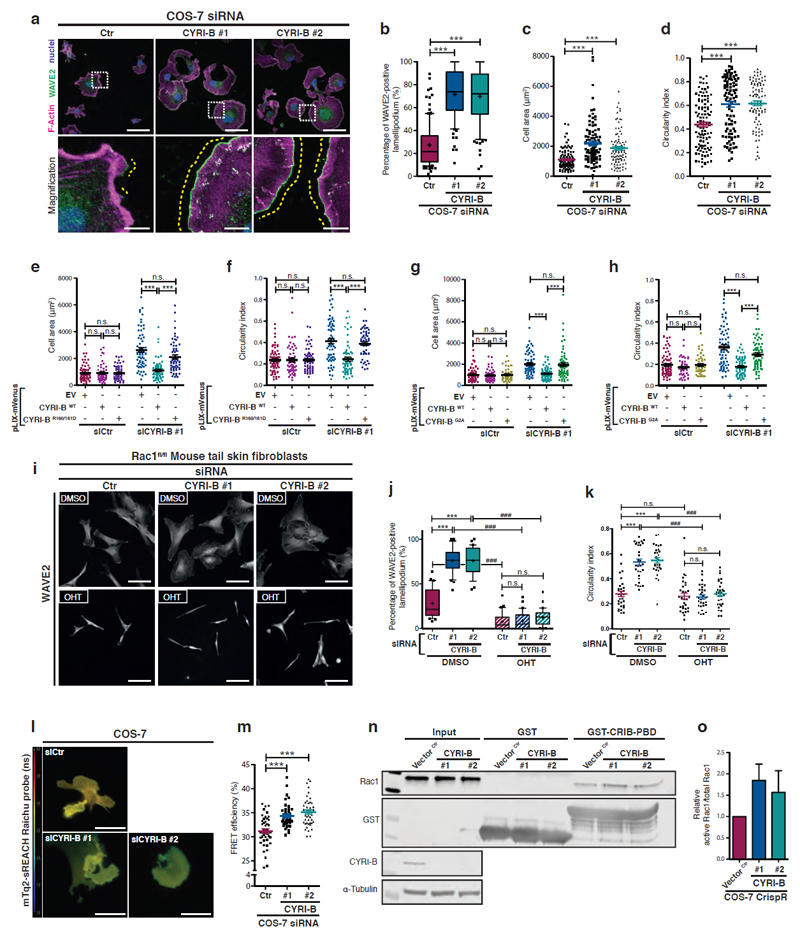
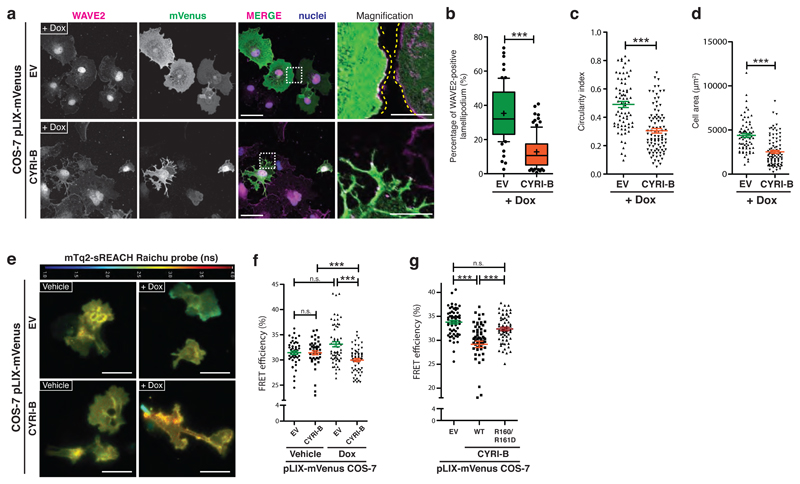
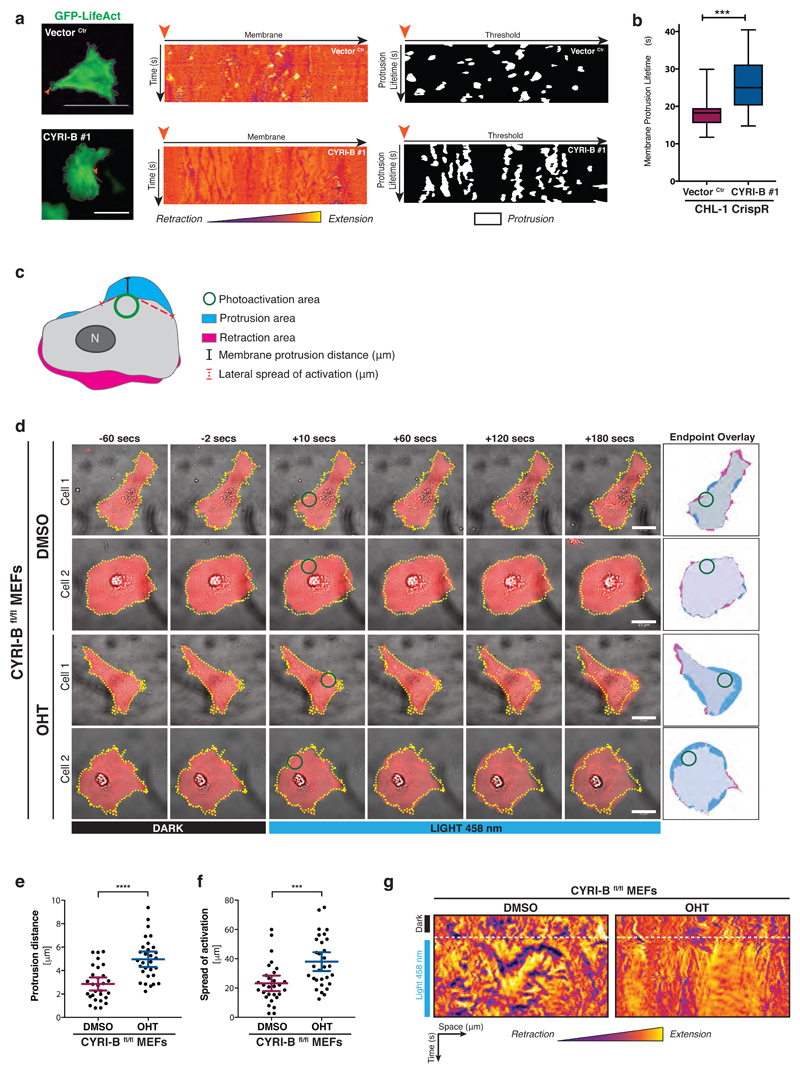
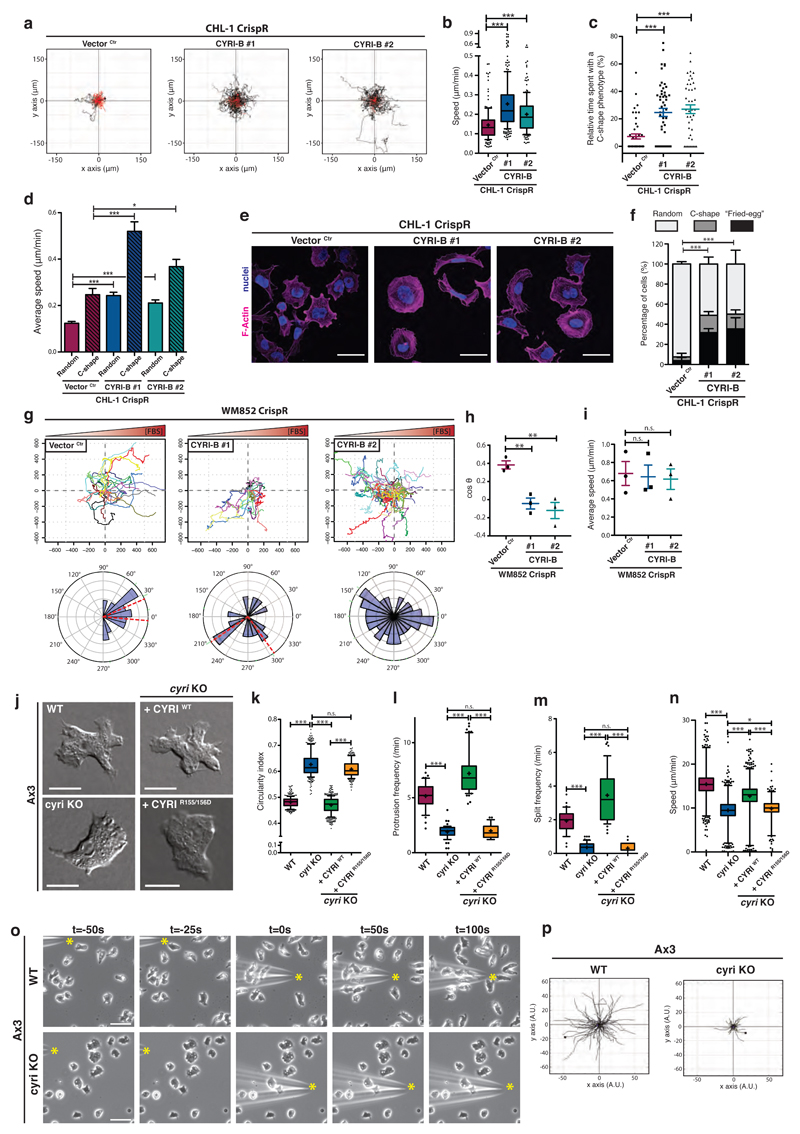
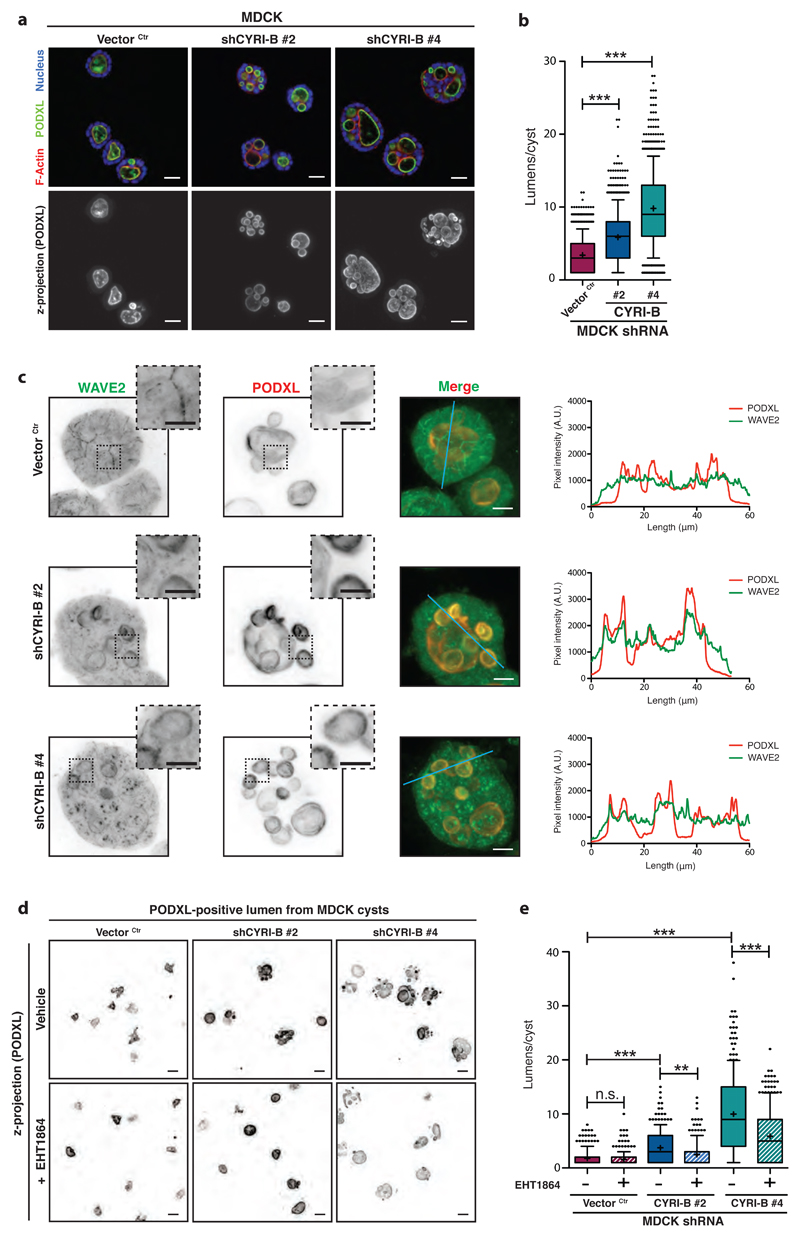
Actin-based protrusions are reinforced through positive feedback, but it is unclear what restricts their size, or limits positive signals when they retract or split. We identify an evolutionarily conserved regulator of actin-based protrusion: CYRI (CYFIP-related Rac interactor) also known as Fam49 (family of unknown function 49). CYRI binds activated Rac1 via a domain of unknown function (DUF1394) shared with CYFIP, defining DUF1394 as a Rac1-binding module. CYRI-depleted cells have broad lamellipodia enriched in Scar/WAVE, but reduced protrusion-retraction dynamics. Pseudopods induced by optogenetic Rac1 activation in CYRI-depleted cells are larger and longer lived. Conversely, CYRI overexpression suppresses recruitment of active Scar/WAVE to the cell edge, resulting in short-lived, unproductive protrusions. CYRI thus focuses protrusion signals and regulates pseudopod complexity by inhibiting Scar/WAVE-induced actin polymerization. It thus behaves like a 'local inhibitor' as predicted in widely accepted mathematical models, but not previously identified in cells. CYRI therefore regulates chemotaxis, cell migration and epithelial polarization by controlling the polarity and plasticity of protrusions.


Figures

Figure 1
Figure 1. CYRI (Fam49) proteins show homology to CYFIP and contain a putative Rac1 interaction motif
a – Volcano plot illustrating pooled results from four LC-MS/MS experiments showing comparison of formaldehyde crosslinked proteins co-immunoprecipitating with GFP or GFP-NAP1 in Dictyostelium napA knockout cells. Color-coding based on Welch test difference. Curved line is 5% false discovery rate. Identified interactors are labeled with gene symbols and presented in Table S2 with additional information. b – Schematic of human CYFIP1/2 and CYRI-A/B showing amino acid numbers and domains. Common DUF1394 domain (Pfam PF07159) in red and CYFIP1/2 C-terminal cytoplasmic Fragile X Mental Retardation FMR1-interacting domain (FragX-IP, Pfam PF05994) in light green. c - Two views of ribbon crystal structure of the Scar/WAVE complex (PDB 3P8C). NCKAP1 in lilac, CYFIP1 in light green and red, Scar/WAVE in peach, HSPC300 in yellow and ABI1 in orange. DUF1394 is red, with putative Rac1 interaction residues in blue and highlighted by arrows. d – Phyre prediction of structure of the DUF1394 domain of CYRI-B. The putative Rac1-binding domain of CYRI is blue with Arg160 and Arg161 indicated as a stick representation. e - Sequence alignment of the putative Rac1-binding domain of CYRI in different organisms. The CYFIP Lys189 and Arg190 equivalent residues are well conserved in CYRI (Arg160 and Arg161) and are highlighted in red.
Figure 2
Figure 2. CYRI proteins interact with active Rac1
a-c - Western blot images from pulldown of GST control, GST-Rac1WT or GST-Rac1Q61L immobilized on beads, mixed with cell lysate expressing either GFP alone, positive control PAK1 eCFP-CRIB-PBD, GFP-RBDWT, GFP-RBDR160D or GFP-RBDR161D (a). Binding relative to GST was quantified by densitometry (b-c). d-f - Western blot images from pulldown of GST control, GST-Rac1P29S or GST-Rac1Q61L or the double mutant GST-Rac1P29S/Q61L immobilized on beads, mixed with cell lysate expressing either GFP alone, eCFP-CRIB-PBD, GFP-RBDWT (d). Relative binding to GST was quantified by densitometry (e-f). g – Summary of steady state surface plasmon resonance (SPR) binding curves between Rac1Q61L and CYRI-B-RBD. Left: GST-CYRI-B was immobilized on anti-GST surface vs increasing concentrations of Rac1Q61L. Right: His-Rac1 was immobilized on NTA surface vs increasing concentrations of CYRI-B RBD. Biacore evaluation software 3.0 was used to fit a simple 1:1 binding model. Kd = equilibrium dissociation constant, A.U. = arbitrary units. h-i Proximity ligation assay was performed on COS-7 cells plated on laminin and co-expressing either CYRI-B-HA or CYRI-BR160/161D-HA and MYC-tagged Rac1 constructs as indicated. PLA signal (yellow), F-actin (magenta) and nuclei (blue). See Supplementary Fig. 2 for negative controls. Quantification in (i). One-way ANOVA with Dunn’s post-test was performed between CYRI-BWT and the different MYC-Rac1 constructs. Mann Whitney test was tested between CYRI-BWT and CYRI-BR160/161D for each MYC-Rac1 construct. n.s. p> 0.05, ** p≤0.01, *** p≤0.001. (Cell counts: anti-HA n=55 ; anti-Myc n=54 ; Myc-WT/WT-HA n=55 ; Myc-WT/R160/161D-HA n=55 ; Myc-T17N/WT-HA n=63 ; Myc-T17N/R160/161D-HA n=84 ; Myc-Q61L/WT-HA n=69 ; Myc-Q61L/R160/161D-HA n=65) Scale bar = 50 μm. j - Still pictures from mitochondrial recruitment of CYRI (Forward) or Rac1AP29S/Q61L (Reverse) in Ax3 D. discoideum. Quantification was performed using the co-localisation tool of Imaris. The Pearson’s coefficient of correlation for co-localisation (and standard deviation SD) at the mitochondria for Rac1A-mCherry-mito and the GFP-fusions were: CRIB-PBD 0.80 (SD: 0.20) ; CYRIWT 0.77 (SD: 0.21) ; CYRIR155/156D 0.05 (SD: 0.12). The correlation coefficients for Rac1A-mCherry and the GFP-CYRI-mito fusions were: CRIB-PBD 0.33 (SD: 0.12) ; CYRIWT 0.44 (SD: 0.19) ; CYRIR155/156D -0.23 (SD: 0.05). Cells co-expressing a mitochondrial reporter (mCherry-gemA tail) and CYRI-GFP were also imaged (right panel), confirming the absence of mitochondrial localisation of CYRI. The correlation coefficient was -0.06 (SD: 0.15). (n=4-5 cells containing >300 mitochondria/cell). Scale bar = 5 μm All data presented are representative of at least 3 biologically independent experiments. Bar and scatter plots show data points with mean and S.E.M. except if stated otherwise.
Figure 3
Figure 3. Loss of CYRI-B increases Rac1-mediated Scar/WAVE localisation to lamellipodia
a-d - Immunofluorescence of control (Ctr) or cyri-b knockdown (siRNA #1 and 2) COS-7 cells plated on laminin for only 1h and stained for WAVE2 (green), nuclei (blue) and F-actin (magenta). Scale bar = 50 μm. Box insets show zoom, Scale bar = 10 μm. The ratio of extension of WAVE2 staining (yellow dotted line) vs the total cell perimeter shown in (b) is a read-out of the extent of the cell edge devoted to lamellipodium. Manual quantification of cell area in (c) and circularity (d). One-way ANOVA with Dunn’s post-test n.s. p> 0.05, *** p≤0.001. (a-c: Scramble n=111 ; #1 n=95 ; #2 n=96 – d: Scramble n=115 ; #1 n=92 ; #2 n=98 cells) e-f – Rescue experiments showing COS-7 cells on laminin treated with siRNA as above and transfected with pLIX-mVenus plasmid co-expressing an siRNA resistant untagged CYRI-B (WT or R160/161D mutant) or control empty vector (EV). (see Supplementary Fig. 3l). Quantification of the cell area (e) and circularity (f) is shown. One-way ANOVA with Dunn’s post-test n.s. p> 0.05, *** p≤0.001. (Scramble/EV n=78 ; Scramble/WT n=58 ; Scramble/R160/161D n=66 ; #1/EV n=66 ; #1/WT n=64 ; #1/R160/161D n=60 cells). g-h – Control or cyri-b knockdown COS-7 cells obtained by siRNA were transfected with the mVenus reporter plasmid (pLIX-mVenus) co-expressing a siRNA resistant untagged CYRI-B (WT or G2A mutant) or control empty vector (EV). Quantification of the cell area (g) and circularity (h). One-way ANOVA with Dunn’s post-test n.s. p> 0.05, *** p≤0.001. (Scramble/EV n=70 ; Scramble/WT n=52 ; Scramble/G2A n=46 ; #1/EV n=63 ; #1/WT n=64 ; #1/G2A n=65 cells) i-k - Control (DMSO) or rac1 knockout (OHT) mouse tail fibroblasts treated with Scramble (siCtr) or mouse specific Cyri-B siRNA, plated on laminin and stained for WAVE2 (i). Scale bar = 50 μm. Quantification of the WAVE2 staining at the lamellipodium (j) and circularity (k) are displayed. One-way ANOVA with Dunn’s post-test *** p≤0.001. Mann Whitney test was performed between same sample treated or not with OHT. ### p≤0.001. (30 cells/conditions). l-m - FLIM/FRET experiment with control (siCtr) or cyri-b knockdown (siCYRI-B #1 and #2) COS-7 cells transfected with mTq2-sREACH and plated on laminin. The jet2 color code (left colour bar) shows average lifetime of the probe, spanning 1-4 ns (blue to red) (l). Quantification of the FRET efficiency shown in (m). One-way ANOVA with Dunn’s post-test. *** p≤0.001. (Scramble n=61 ; #1 n=61, #2 n=63 cells) Scale bar = 50 μm n-o - Active Rac1 pulldown comparing control CrispR (Vector Ctr) or 2 independent cyri-b CrispR knockout (#1 and #2) COS-7 cell lines. Lysate was incubated with GST or GST-CRIB-PBD beads and western blot probed as indicated. Relative active Rac1 was quantified by densitometry (o). All data presented are representative of at least 3 biologically independent experiments. Bar and scatter plots show data points with mean and S.E.M. Whisker plots show 10-90 percentile, median (bar) and mean (cross).
Figure 4
Figure 4. Overexpression of CYRI-B opposes Rac1-mediated Scar/WAVE recruitment to the leading edge
a-d - Immunofluorescence of doxycycline-induced control empty vector (EV) or CYRI-B overexpression in COS-7 cells and fixed after a longer time (4h of spreading) and stained for WAVE2 (magenta), nuclei (blue) and GFP (green). Scale bar = 50 μm. Insets show zoom of white dashed field. Scale bar = 10 μm (a). WAVE2 ratio and circularity were measured and reported in (b) and (c) respectively. Cell area quantification was based on phalloidin staining (d). Mann-Whitney test *** p≤0.001. (Dox/EV n=73 ; Dox/CYRI-B n=93 cells) e-f - FLIM/FRET experiment with mTq2-sREACH Raichu Rac1 showing vehicle or doxycycline-treated COS-7 cells expressing a control empty vector (EV) or CYRI-B. The jet2 color code (bar at top) shows the average lifetime of the probe, spanning 1-4 ns (blue to red) (e). Quantification of the FRET efficiency (f) Mann-Whitney test n.s. p> 0.05, *** p≤0.001. (Veh/EV n=47 ; Veh/CYRI-B n=46 ; Dox/EV n=62 ; Dox/CYRI-B n=62 cells) Scale bar = 50 μm. g - FRET efficiency obtained from control (EV) or COS-7 cells overexpressing CYRIWT or CYRI-BR160/161D after doxycycline induction. One-way ANOVA with Dunn’s post-test was performed. n.s. p> 0.05, *** p≤0.001. (EV n=59 ; WT n=62 ; R160/161D n=63 cells). Data represent at least 3 biologically independent experiments. Bar and scatter plots show data points with mean and S.E.M. Whisker plots show 10-90 percentile, median (bar) and mean (cross).
Figure 5
Figure 5. CYRI-B controls the duration and extent of Rac1-mediated protrusions
a - Control (Vector Ctr) and cyri-b CrispR knockout CHL-1 cells on laminin expressing GFP-LifeAct, recorded for 3 minutes at 1 frame/sec. The cell periphery (magenta) is tracked using the GFP-LifeAct signal (green) (Left panel). The membrane is unravelled from the orange arrow and a representative polar kymograph of the changes in membrane dynamics over time between control (Vector Ctr - Top) and cyri-b CrispR knockout (Bottom) CHL-1 cells is shown. Membrane extensions (positive values) are visualised in yellow through to orange, while retractions (negative values) are purple-blue (Middle panel). Thresholding of the kymograph to remove noise (values ≥ + 0.6) reveals protrusions over time (white signal – Right panel) Still from movie S2. Scale bar = 25 μm. b - Box plot representing the distribution of the average protrusion lifetime for each individual cell. Error bars represent S.D. Mann Whitney test was performed. *** p≤0.001. (20 cells/condition) c - Schematic representation showing protruding (blue) and retracting (magenta) area following photoactivation of Rac1-LOV probe. Photo activation area (green circle) was used as the origin to measure the maximal protrusion distance (outward - black line) and the longest uninterrupted lateral spread of the protrusion (red dotted line) d - Still pictures from videos of photoactivation time course showing selected cells from DMSO (Control) or OHT-treated (knockout) immortalized CRE-ERT2+ Cyri-Bfl/fl MEFs on fibronectin. Endpoint overlay as from schematic (c). Scale bar = 25 μm. e-f - Quantification of the protrusion distance (e) and the spread of activation (f) between control (DMSO) or cyri-b knockout (OHT) MEFs. Error bars represent 95% CI. Unpaired two-tailed t-test (e) and Mann-Whitney test (f). *** p≤0.001, **** p≤0.0001. (DMSO n=29 ; OHT n=30 cells). g - Kymograph representation before and after photo activation. Membrane extensions are visualised in yellow through to orange, while retractions are observed in purple-blue. Time of photoactivation is highlighted by a white dotted line. All data presented are representative of at least 3 biologically independent experiments.
Figure 6
Figure 6. CYRI proteins mediate plasticity of protrusions needed for directional migration
a-b - Spider plots of control (Vector Ctr) or cyri-b CrispR knockout (#1 and #2) CHL-1 cells on collagen-I-coated dishes and recorded for 17h (a) (See movie S4). Black and red lines represent tracks with a travelled distance greater or shorter than 100 μm respectively. Average speed is plotted in (b). Whisker plots show 10-90 percentile and mean (cross). One-way ANOVA with Dunn’s post-test *** p≤0.001. (Ctr n=161 ; #1 n=228, #2 n=178 cells). c - Relative time spent with a fast moving C-shape phenotype between control (Vector Ctr) and cyri-b CrispR knockout (#1 and #2) CHL-1 cells. One-way ANOVA with Dunn’s post-test *** p≤0.001. (Ctr n=45 ; #1 n=53, #2 n=42 cells). d - Speed of control (Vector Ctr) or cyri-b CrispR knockout (#1 and #2) CHL-1 cells displaying a random or a C-shape. One-way ANOVA with Dunn’s post-test n.s. p>0.05, * p≤0.05, *** p≤0.001. (Ctr n=45 ; #1 n=53, #2 n=42 cells) e-f - Immunofluorescence of control (Vector Ctr) or cyri-b CrispR knockout (#1 and #2) CHL-1 cells on collagen and stained for F-actin (magenta) and nuclei (blue) (e). Scale bar = 50 μm. Cells were classified into 3 categories according to their morphology (Fried-egg, C-shape, Random) and the percentage of each population is shown in (f). Two-tailed Chi-square test (95% confidence). *** p≤0.001. (Ctr n=276 ; #1 n=216, #2 n=210 cells) g-i - Spider plots and rose plots representing the chemotactic ability of control (Vector Ctr) or cyri-b knockout WM852 cells migrating toward 10% FBS (g) (see movie S5). Red-dashed lines represent a 95% confidence interval for the mean direction. Cosθ (chemotactic index) (h) and average speed (i). Two-tailed unpaired t-test. n.s. p>0.05, ** p≤0.01. (Ctr n=129 ; #1 n=132, #2 n=151 cells). j-n - Representative DIC pictures from an under agarose chemotaxis assay of Ax3 (WT) and Ax3-derived cell lines (j) (see movie S6). Scale bar = 10 μm. Automatic cell segmentation and tracking used to quantify cell circularity (k), protrusions and split frequency (l and m respectively), and speed (n). Whisker plots show 10-90 percentile (k-m) and 1-99 percentile (n) with median (bar) and mean (cross). One-way ANOVA with Dunn’s post-test was performed. n.s. p>0.05, * p≤0.05, *** p≤0.001. (Cell counts: k: WT n=360 ; cyri KO n=352 ; cyri KO + CYRI WT n=480 ; cyri KO + CYRI R155/156 n=240 - l: WT n=45 ; cyri KO n=57 ; cyri KO + CYRI WT n=53 ; cyri KO + CYRI R155/156 n=31 - m: WT n=42 ; cyri KO n=62 ; cyri KO + CYRI WT n=46 ; cyri KO + CYRI R155/156 n=33 - n: WT n=2389 ; cyri KO n=2460 ; cyri KO + CYRI WT n=3024 ; cyri KO + CYRI R155/156 n=1169) o-p - Needle assay using WT or cyri knockout Ax3 cells migrating toward cAMP. Time-lapse phase contrast movies (see movie S8) of cells responding to cAMP (yellow start). Scale bar = 25 μm (o). Spider plots obtained from manual tracking of the first 100 seconds following needle re-orientation (p). (WT n=86 ; cyri KO n=79 cells) All data presented are representative of at least 3 biologically independent experiments. Bar and scatter plots show data points with mean and S.E.M.
Figure 7
Figure 7. CYRI-B regulates Rac1-dependent recruitment of Scar/WAVE complex during epithelial cystogenesis
a-b – Immunofluorescence of control (Vector Ctr) or cyri-b shRNA knockdown (#1 and #2) MDCK cysts fixed after 5 days of culture and stained for Podocalyxin (PODXL) (green), F-actin (red) and nuclei (blue). Top row is a confocal section and bottom row represents Z-maximal projection intensity of PODXL staining. Scale bar = 50 μm (a). Quantification of lumens in (b). One-way ANOVA with Dunn’s post-test. *** p<0.001. (Ctr n=1000, #1 n=1000, #2 n=800 cysts). c - Immunofluorescence of control (Vector Ctr) or cyri-b shRNA knockdown (#1 and #2) MDCK cysts stained for WAVE2 (green) and Podocalyxin (PODXL) (red) after 5 days of culture. Inverted LUT images, merge and representative surface profile plots shown. PODXL (red) and WAVE2 (green) staining intensity was measured along the blue line. Scale bar = 9 μm. Insets provide a magnified view of the dotted square area. Scale bar = 5 μm. d-e – Immunofluorescence of control (Vector Ctr) or cyri-b shRNA knockdown (#1 and #2) MDCK cysts grown during 5 days, treated or not with 50 nM EHT1864 and stained for Podocalyxin (PODXL). Pictures represent the Z-maximal projection intensity from a representative z-stack running across the entire cyst volume. Scale bar = 50 μm (d). Number of lumens per cyst was quantified for vehicle or EHT1864-treated cysts and plotted in (e). One-way ANOVA with Dunn’s post-test was performed between control (Vector Ctr), shCYRI-B #1 and shCYRI-B #2 whereas unpaired two-tailed t-test was applied between vehicle and drug-treated cyst. n.s. p>0.05, ** p≤0.01 *** p≤0.001. (250 cysts/condition) All data presented are representative of at least 3 biologically independent experiments. Bar and scatter plots show data points with mean and S.E.M. Whisker plots show 10-90 percentile, median (bar) and mean (cross).

Similar articles

Cited by

References

    1. Krause M, Gautreau A. Steering cell migration: lamellipodium dynamics and the regulation of directional persistence. Nat Rev Mol Cell Biol. 2014;15:577–590. - PubMed
    1. Insall R. The interaction between pseudopods and extracellular signalling during chemotaxis and directed migration. Curr Opin Cell Biol. 2013;25:526–531. - PubMed
    1. Chen Z, et al. Structure and control of the actin regulatory WAVE complex. Nature. 2010;468:533–538. - PMC - PubMed
    1. Davidson AJ, Insall RH. Actin-based motility: WAVE regulatory complex structure reopens old SCARs. Curr Biol. 2011;21:R66–68. - PubMed
    1. Hoeller O, et al. Gbeta Regulates Coupling between Actin Oscillators for Cell Polarity and Directional Migration. PLoS Biol. 2016;14:e1002381. - PMC - PubMed

Publication types

MeSH terms

Substances