. 2018 Oct;20(10):1215-1225.
doi: 10.1038/s41556-018-0200-6. Epub 2018 Sep 24.

Single-fluorophore biosensors for sensitive and multiplexed detection of signalling activities

Affiliations

Single-fluorophore biosensors for sensitive and multiplexed detection of signalling activities

Sohum Mehta et al. Nat Cell Biol. 2018 Oct.

Abstract

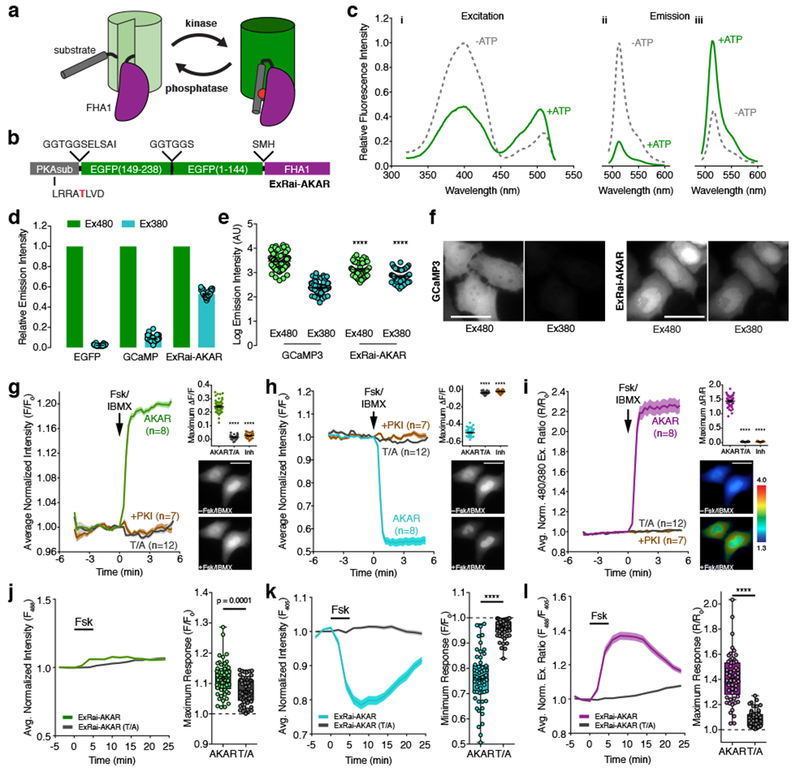
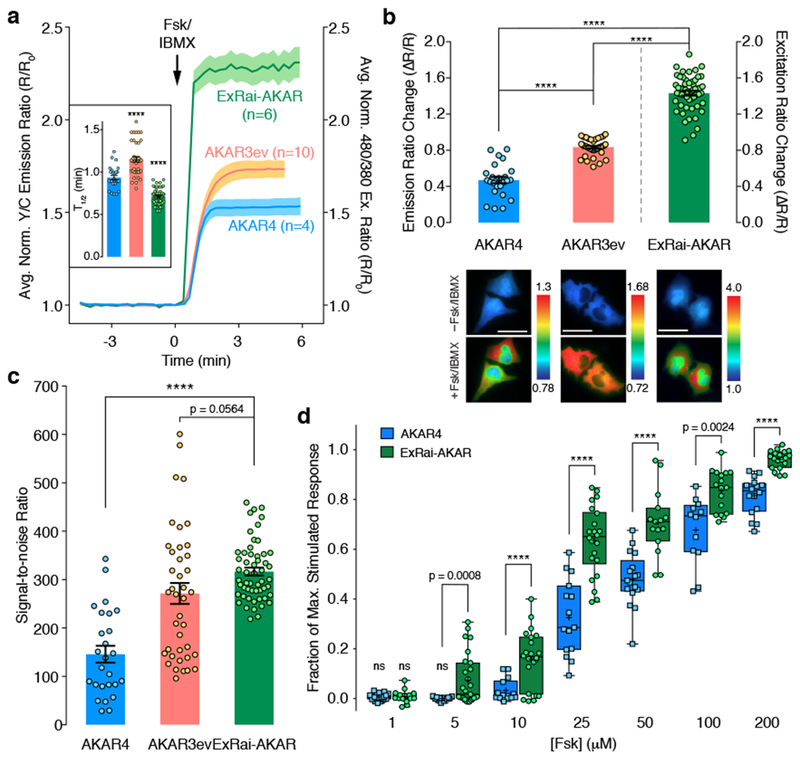
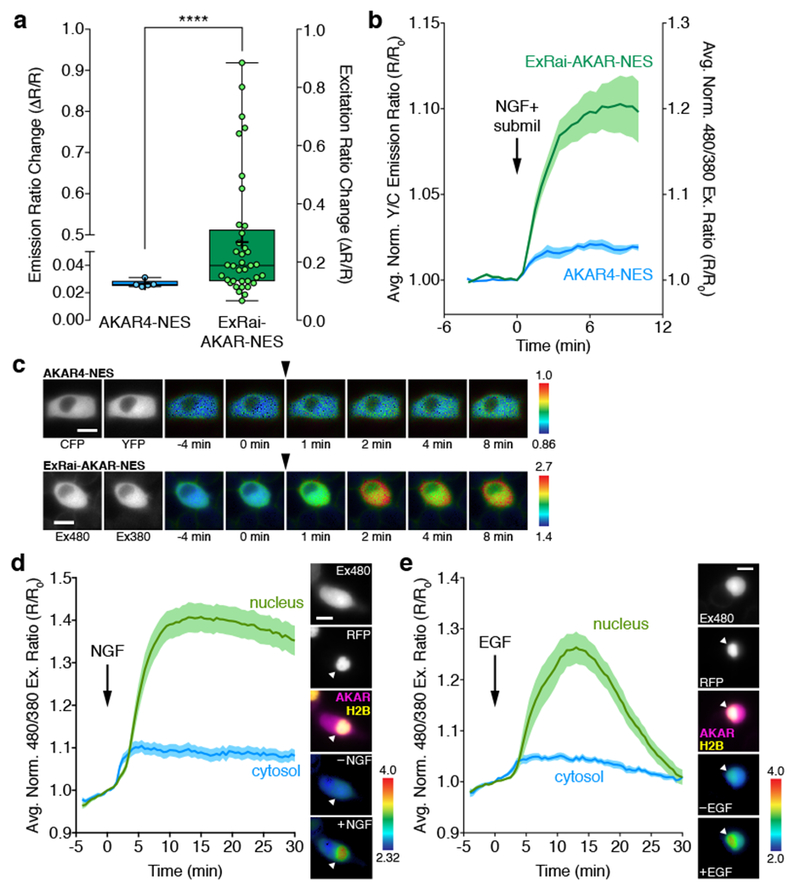
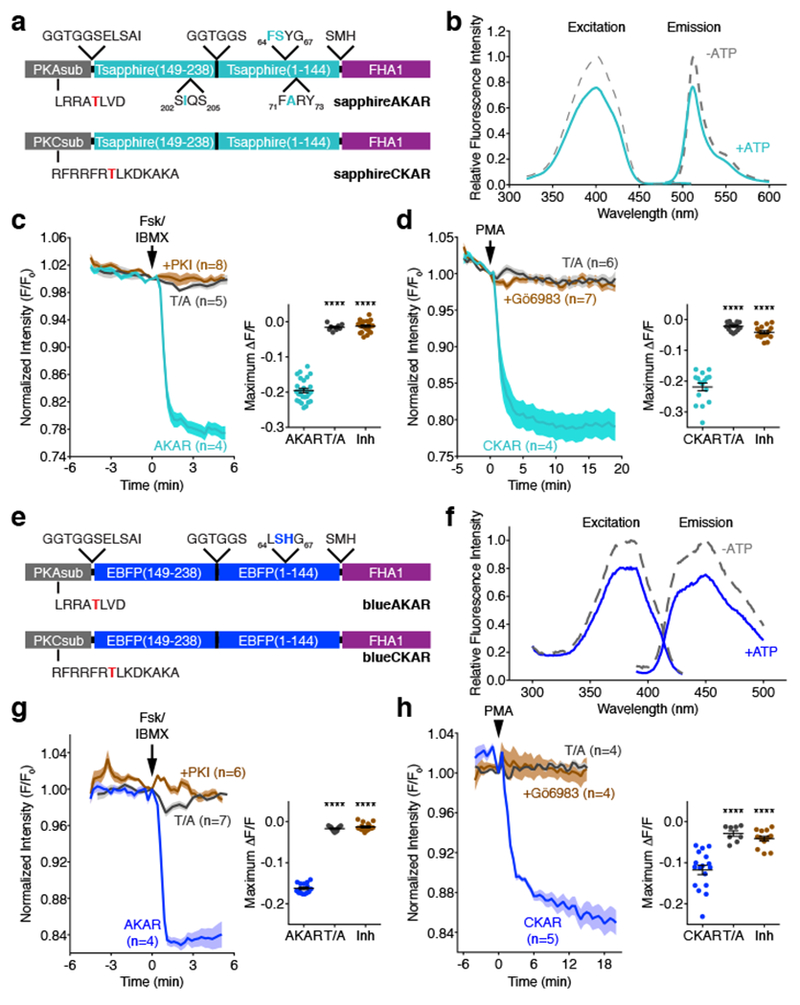
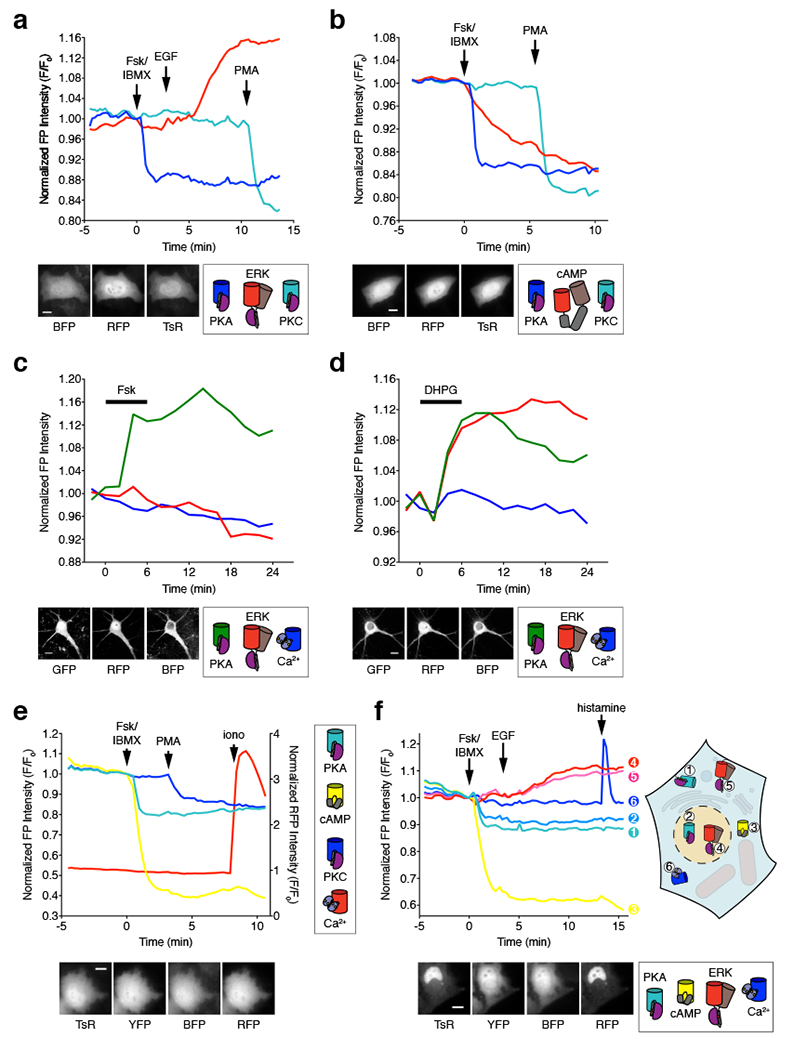
Unravelling the dynamic molecular interplay behind complex physiological processes such as neuronal plasticity requires the ability to both detect minute changes in biochemical states in response to physiological signals and track multiple signalling activities simultaneously. Fluorescent protein-based biosensors have enabled the real-time monitoring of dynamic signalling processes within the native context of living cells, yet most commonly used biosensors exhibit poor sensitivity (for example, due to low dynamic range) and are limited to imaging signalling activities in isolation. Here, we address this challenge by developing a suite of excitation ratiometric kinase activity biosensors that offer the highest reported dynamic range and enable the detection of subtle changes in signalling activity that could not be reliably detected previously, as well as a suite of single-fluorophore biosensors that enable the simultaneous tracking of as many as six distinct signalling activities in single living cells.


Conflict of interest statement

COMPETING FINANCIAL INTERESTS

The authors declare no competing financial interests.

Figures

Figure 1.
Figure 1.. Design and characterization of ExRai-AKAR.
(a) Modulation of cpFP fluorescence by a phosphorylation-dependent molecular switch. (b) ExRai-AKAR domain structure. (c) Representative ExRai-AKAR fluorescence spectra collected at (i) 530 nm emission and (ii) 380 nm or (iii) 488 nm excitation without (gray) or with (green) ATP in the presence of PKA catalytic subunit. n=3 independent experiments. (d) Relative fluorescence intensities of HeLa cells under 480 nm (Ex480) or 380 nm (Ex380) illumination. n=63 (EGFP), 94 (GCaMP3), and 54 (ExRai-AKAR) cells pooled from 2, 2, and 11 experiments. (e) ExRai-AKAR is dimmer at Ex480 (****p<0.0001, t=5.228, df=136; unpaired two-tailed Student’s t-test) but brighter at Ex380 (****p<0.0001, t=8.826, df=136; unpaired two-tailed Student’s t-test) versus GCaMP3. Same n as in (d). (f) Representative GCaMP3 or ExRai-AKAR fluorescence images. (g-i) Average time-courses (left) and maximum (g) Ex480 or (h) Ex380 (ΔF/F), or (i) 480/380 ratio (ΔR/R) responses (right, top) in HeLa cells treated with 50 μM Fsk/100 μM IBMX (Fsk/IBMX). n=54 (ExRai-AKAR), 36 (ExRai-AKAR[T/A]), and 31 (ExRai-AKAR plus PKI) cells. Time-courses are representative of and maximum responses are pooled from 11, 4, and 4 experiments. ****p<0.0001, F=665.7 (d), F=3956 (e), F=1819 (f); DFn=2, DFd=119; one-way ANOVA with Dunnet’s test. Images show ExRai-AKAR (g) Ex480 or (h) Ex380 fluorescence, or (i) 480/380 ratio (pseudocolored) before and after stimulation. Warmer colors indicate higher ratios. Scale bars, 30 μm. (j-l) Average time-courses (left) and maximal (j) 488 nm- or (k) 405 nm-excited fluorescence, or (l) 488/405 ratio responses (right) in the soma of Fsk-treated cultured rat cortical neurons. n=57 (ExRai-AKAR) and 56 (ExRai-AKAR[T/A]) neurons pooled from 5 and 6 experiments. ****p<0.0001, unpaired two-tailed Mann-Whitney U-test. Curves are normalized to time 0 (g-i) or to the average baseline value (j-l). Solid lines indicate the mean; shaded areas, SEM. Bars in d, e, and g-i represent mean ± SEM. Bar graphs in g-i show box-and-whisker plots indicating the median, interquartile range, min, max, and mean (+). Maximum responses are calculated as ΔF/F=(Fmax-Fmin)/Fmin or ΔR/R=(Rmax-Rmin)/Rmin (g-i) or with respect to time 0 (F/F0 or R/R0; j-k). See Supplementary Table 1 for bar graph source data.
Figure 2.
Figure 2.. ExRai-AKAR shows improved performance over previous-generation AKARs.
(a) Time-courses and (b) maximum responses (ΔR/R) in 50 μM Fsk/100 μM IBMX (Fsk/IBMX)-treated HeLa cells. Inset: Average time to half-maximal response (T1/2)n=26 (AKAR4), 40 (AKAR3ev), and 54 (ExRai-AKAR) cells. Curves are representative of and bar graphs are pooled from 4, 6, and 11 experiments. Curves are normalized to time 0 (R/R0). Solid lines represent the mean; shaded areas, SEM. Bars represent mean ± SEM; ****p<0.0001 vs. AKAR4; F=95.57, DFn=2, DFd=104; one-way ANOVA with Dunnett’s test. Maximum responses are calculated as ΔR/R=(Rmax-Rmin)/Rmin. Representative ratio images (pseudocolored) before and after Fsk/IBMX treatment are shown below. Warmer colors indicate higher ratios. ****p<0.0001; t=4.537, df=63.99 (AKAR4 vs. AKAR3ev); t=0.39, df=54.81 (ExRai-AKAR vs. AKAR3ev); t=5.926, df=41.12 (ExRai-AKAR vs. AKAR4); unpaired two-tailed Welch’s unequal variance t-test. Scale bars, 30 μm. (c) Signal-to-noise ratio in Fsk/IBMX-treated HeLa cells (see Methods). Bars represent mean ± SEM. n is the same as in (b). ****p<0.0001; t=5.926, df=41.12; unpaired two-tailed Welch’s unequal variance t-test. (d) Dose-response comparison in HeLa cells. Responses are normalized to Fsk/IBMX treatment. Data are shown as box-and-whisker plots showing the median, interquartile range, min, max, and mean (+) . ns, not significantly different from 0; two-tailed one-sample t-test: t=2.041, df=19 (AKAR4, 1 μM; n=20 cells from 3 experiments); t=1.316, df=14 (ExRai-AKAR, 1 μM; n=15 cells from 3 experiments); t=0.2396, df=13 (AKAR4, 5 μM; n=14 cells from 3 experiments). ****p<0.0001; t=3.767, df=26.55 (5 μM; AKAR4, n=14 cells from 3 experiments; ExRai-AKAR, n=27 cells from 7 experiments); t=3.021, df=33.98 (10 μM; AKAR4, n=14 cells from 3 experiments; ExRai-AKAR, n=22 cells from 3 experiments); t=6.299, df=28.21 (25 μM; AKAR4, n=15 cells from 3 experiments; ExRai-AKAR, n=22 cells from 3 experiments); t=5.31, df=27.19 (50 μM; AKAR4, n=17 cells from 3 experiments; ExRai-AKAR, n=15 cells from 3 experiments); t=3.566, df=16.72 (100 μM; AKAR4, n=12 cells from 3 experiments; ExRai-AKAR, n=17 cells from 4 experiments); t=7.073, df=20.73 (200 μM; AKAR4, n=16 cells from 3 experiments; ExRai-AKAR, n=19 cells from 3 experiments); unpaired two-tailed Welch’s unequal variance t-test. See Supplementary Table 1 for bar graph source data.
Figure 3.
Figure 3.. ExRai-AKAR amplifies minute activity changes and reveals compartmentalized PKA signaling in growth factor-stimulated PC12 cells.
(a) Bar graph comparing the maximum responses (ΔR/R) of AKAR4-NES (n=5 cells pooled from 3 experiments) and ExRai-AKAR-NES (n=37 cells pooled from 22 experiments) in PC12 cells treated with 200 ng/mL NGF and a submaximal (5 μM) dose of milrinone (submil). Data are presented as box-and-whisker plots showing the median, interquartile range, min, max, and mean (+). ****p<0.0001; unpaired two-tailed Mann-Whitney U test. Ratio changes are calculated as ΔR/R=(Rmax-Rmin)/Rmin. (b) Average time-courses of ExRai-AKAR-NES and AKAR4-NES responses in PC12 cells treated with NGF+submil. Curves are plotted as Y/C emission ratios or 480/380 excitation ratios normalized with respect to time 0 (R/R0). n is the same as in (a). (c) Representative pseudocolor images of the AKAR4-NES (top) and ExRai-AKAR-NES (bottom) ratio responses in PC12 cells treated with NGF+submil. Arrowhead indicates drug addition. Warmer colors indicate higher ratios. Grayscale images (left) show the distribution of probe fluorescence in each channel. (d, e) Left: Average time-courses of the PKA response in the nucleus (green curves) and cytosol (blue curves) in PC12 cells co-expressing diffusible ExRai-AKAR and the nuclear marker histone H2B-mCherry stimulated with (a) 200 ng/mL NGF (n=17 cells pooled from 8 experiments) or (b) 100 ng/mL EGF (n=16 cells pooled from 6 experiments). Curves are plotted as the 480/380 excitation ratio (R/R0) normalized with respect to time 0. Solid lines represent the mean; shaded areas, SEM. Right: representative images showing (from top to bottom) the localization of ExRai-AKAR fluorescence in the 480 nm excitation channel, the localization of mCherry-tagged histone H2B within the nucleus, merged image of ExRai-AKAR (magenta) and H2B (yellow) localization, and pseudocolored images of the ExRai-AKAR excitation ratio before and (a) NGF or (b) EGF stimulation. Warmer colors represent higher ratios. Arrowhead indicates the nucleus. Scale bars in c-e, 10 μm. See Supplementary Table 1 for bar graph source data.
Figure 4.
Figure 4.. Construction of ExRai-CKAR and ExRai-AktAR based on a generalized design.
(a) Domain structures of ExRai-CKAR (top) and ExRai-AktAR (bottom). (b) Average time-courses (left) and maximum stimulated responses (ΔR/R, right top) of HeLa cells treated with 100 ng/mL PMA. n=26 (ExRai-CKAR), 17 (ExRai-CKAR[T/A]), and 11 (ExRai-CKAR with PKC inhibitor pretreatment [10 μM Gö6983]) cells. Curves are representative of and bar graphs are pooled from 5, 3, and 3 experiments. (****p<0.0001, F=351.9, DFn=2, DFd=51; one-way ANOVA followed by Dunnet’s multiple comparisons test). Representative pseudocolor images show the ExRai-CKAR excitation ratio in HeLa cells before and after stimulation. Warmer colors correspond to higher excitation ratios. (c) Average time-courses (left) and maximum stimulated responses (ΔR/R, right top) of NIH3T3 cells treated with 50 ng/mL PDGF. n=15 (ExRai-AktAR), 16 (ExRai-AktAR[T/A]), and 7 (ExRai-AktAR with Akt inhibitor pretreatment [50 μM10-DEBC]) cells. Curves and bar graphs are pooled from 12, 4, and 5 experiments. (****p<0.0001, F=445.3, DFn=2, DFd=33; one-way ANOVA followed by Dunnet’s multiple comparisons test). Representative pseudocolor images show the ExRai-AktAR excitation ratio in NIH3T3 cells before (middle) and after (bottom) stimulation. Warmer colors correspond to higher excitation ratios. Scale bars, 10 μm. Curves are plotted as 480/380 excitation ratio normalized with respect to time 0 (R/R0). Solid lines represent the mean; shaded areas, SEM. For dot plots in b and c, horizontal bars represent mean ± SEM. Maximum responses are calculated as ΔR/R=(Rmax-Rmin)/Rmin. See Supplementary Table 1 for bar graph source data.
Figure 5.
Figure 5.. AKAR and CKAR color variants based on cp-T-sapphire and cpBFP.
(a, e) Domain structures of (a) sapphireAKAR and sapphireCKAR and (e) blueAKAR and blueCKAR. (b, f) Representative fluorescence spectra of (b) sapphireAKAR and (f) blueAKAR collected in without (gray) and with (teal or blue) ATP in the presence of PKA catalytic subunit. n=3 independent experiments. (c) Average time-courses (left) and maximum responses (ΔF/F, right) in Fsk/IBMX-treated HeLa cells. n=27 (sapphireAKAR), 8 (sapphireAKAR[T/A]), and 22 (sapphireAKAR plus PKI) cells. Curves are representative of and bar graphs are pooled from 6, 2, and 3 experiments. (****p<0.0001, F=386.4, DFn=2, DFd=54; one-way ANOVA followed by Dunnet’s multiple comparisons test). (d) Average time-courses (left) and maximum responses (ΔF/F, right) in PMA-treated HeLa cells. n=16 (sapphireCKAR), 15 (sapphireCKAR[T/A]), and 16 (sapphireCKAR with 10 μM Gö6983 pretreatment) cells. Curves are representative of and bar graphs are pooled from 5, 3, and 3 experiments. (****p<0.0001, F=176.5, DFn=2, DFd=44; one-way ANOVA followed by Dunnet’s multiple comparisons test). (g) Average time-courses (left) and maximum responses (ΔF/F, right) of blueAKAR (n=15 cells), blueAKAR(T/A) (n=11 cells), and blueAKAR plus PKI (n=16 cells) (****p<0.0001, F=1105, DFn=2, DFd=39; one-way ANOVA followed by Dunnet’s test). Curves are representative of and bar graphs are pooled from 5, 2, and 4 experiments. (f) Average time-courses (left) and maximum responses (ΔF/F, right) of blueCKAR (n=17 cells), blueCKAR(T/A) (n=8 cells), and blueCKAR with Gö6983 pretreatment (n=14 cells) (****p<0.0001, F=26.38, DFn=2, DFd=36; one-way ANOVA followed by Dunnet’s multiple comparisons test). Curves are representative of and bar graphs are pooled from 6, 2, and 3 experiments. Curves are normalized with respect to time 0 (F/F0). Solid lines represent the mean; shaded areas, SEM. For dot plots shown in c, d, g, and h, horizontal bars represent mean ± SEM. Maximum responses are calculated as ΔF/F=(Fmax-Fmin)/Fmin. See Supplementary Table 1 for bar graph source data.
Figure 6.
Figure 6.. Generating red-shifted single-fluorophore sensors using ddRFP.
(a) Design and domain structures of the ddRFP-based kinase activity reporters RAB-EKARev and RAB-AKARev. (b) Design and domain structure of the ddRFP-based cAMP reporter RAB-ICUE. (c) Average time-courses (left) and maximum stimulated responses (ΔF/F, right) in HEK293T cells treated with 100 ng/mL EGF. n=70 (RAB-EKARev), 54 (RAB-EKARev[T/A]), and 42 (RAB-EKARev with MEK inhibitor pretreatment [20 μM U0126]) cells. Curves are representative of and bar graphs are pooled from 7, 5, and 3 experiments. ****p<0.0001, F=367.7, DFn=2, DFd=163; one-way ANOVA followed by Dunnet’s test). (d) Average time-courses (left) and maximum stimulated responses (ΔF/F, right) in HeLa cells treated with 50 μM Fsk and 100 μM IBMX (Fsk/IBMX). n=19 (RAB-AKARev), 16, 2 (RAB-AKARev[T/A]), and 22 (RAB-AKARev plus PKI) cells. Curves are representative of and bar graphs are pooled from 3, 2, and 2 experiments. ****p<0.0001, F=138.8, DFn=2, DFd=54; one-way ANOVA followed by Dunnet’s test). (e) Average time-course of the fluorescence response in HEK293T cells expressing RAB-ICUE after Fsk/IBMX treatment. Data are representative of 4 experiments. Curves are normalized with respect to time 0 (F/F0). Solid lines represent the mean, and shaded areas represent SEM. For dot plots shown in c and d, horizontal bars represent mean ± SEM. Maximum responses are calculated as ΔF/F=(Fmax-Fmin)/Fmin. See Supplementary Table 1 for bar graph source data.
Figure 7.
Figure 7.. Multiplexed activity imaging using single-fluorophore biosensors.
(a, b) Three-parameter time-lapse epifluorescence imaging in HeLa cells. (a) Time-course of blueAKAR (blue), RAB-EKARev (red), and sapphireCKAR (teal) responses in a single cell treated with 50 μM Fsk and 100 μM IBMX (Fsk/IBMX), 100 ng/mL EGF, and 100 ng/mL PMA. Data are representative of n=13 cells from 5 independent experiments. Representative images of each channel are shown below. (b) Time-course of blueAKAR (blue), RAB-ICUE (red), and sapphireCKAR (teal) responses in a single cell treated with Fsk/IBMX and PMA. Data are representative of n=17 cells from 3 independent experiments. Representative images of each channel are shown below. (c, d) Three-parameter time-lapse confocal imaging in cultured rat cortical neurons. (c) Time-course of ExRai-AKAR (green; 488 nm excitation), RAB-EKARev (magenta) and BCaMP (blue) responses in the cell soma following Fsk stimulation. Data are representative of n=68 neurons from 6 independent experiments. (d) Time-course of ExRai-AKAR (green; 488 nm excitation), RAB-EKARev (magenta) and BCaMP (blue) responses in the cell soma of a single cultured neuron following DHPG stimulation. Data are representative of n=104 neurons from 10 independent experiments. (e, f) Higher-order multiplexed imaging in HeLa cells. (e) Four-parameter imaging time-course of sapphireAKAR (teal), Flamindo2 (yellow), and blueCKAR (blue), and RCaMP (red) responses in a single cell treated with Fsk/IBMX, PMA, and 1 μM ionomycin (iono). Data are representative of n=15 cells from 8 independent experiments. Representative images of each channel are shown below. (f) Six-parameter imaging time-course in a single cell co-expressing 1) Lyn-sapphireAKAR (teal), 2) sapphireAKAR-NLS (light blue), 3) Flamindo2 (yellow), 4) RAB-EKARev-NLS (red), 5) Lyn-RAB-EKARev (pink), and 6) B-GECO1 (blue) and treated with Fsk/IBMX, EGF, and 100 μM histamine. Data are representative of n=46 cells from 10 independent experiments. Representative images of each channel are shown below. Scale bars, 10 μm. Curves are normalized with respect to time 0 (F/F0; a, b, e, and f) or with respect to the average intensity of the baseline (c, d). Additional curves are shown in Supplementary Fig. 5–7.

Similar articles

Cited by

References

    1. Depry C, Mehta S & Zhang J Multiplexed visualization of dynamic signaling networks using genetically encoded fluorescent protein-based biosensors. Pflugers Arch 465, 373–381 (2013). - PMC - PubMed
    1. Piljic A & Schultz C Simultaneous recording of multiple cellular events by FRET. ACS Chem Biol 3, 156–160 (2008). - PubMed
    1. Nagai T, Sawano A, Park ES & Miyawaki A Circularly permuted green fluorescent proteins engineered to sense Ca2+. Proc Natl Acad Sci USA 98, 3197–3202 (2001). - PMC - PubMed
    1. Nakai J, Ohkura M & Imoto K A high signal-to-noise Ca(2+) probe composed of a single green fluorescent protein. Nat Biotechnol 19, 137–141 (2001). - PubMed
    1. Yang HH et al. Subcellular Imaging of Voltage and Calcium Signals Reveals Neural Processing In Vivo. Cell 166, 245–257 (2016). - PMC - PubMed

Publication types

Substances