. 2018 Sep 24;9(1):3872.
doi: 10.1038/s41467-018-06287-x.

Targeting PFKFB3 radiosensitizes cancer cells and suppresses homologous recombination

Affiliations

Targeting PFKFB3 radiosensitizes cancer cells and suppresses homologous recombination

Nina M S Gustafsson et al. Nat Commun. .

Abstract

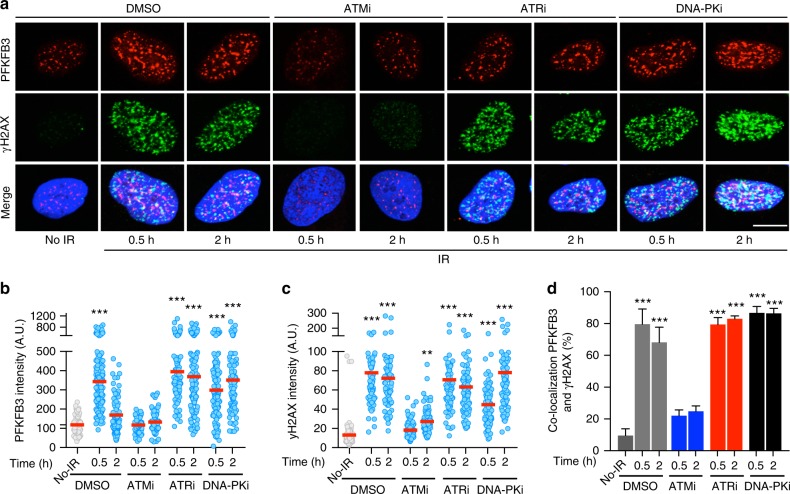
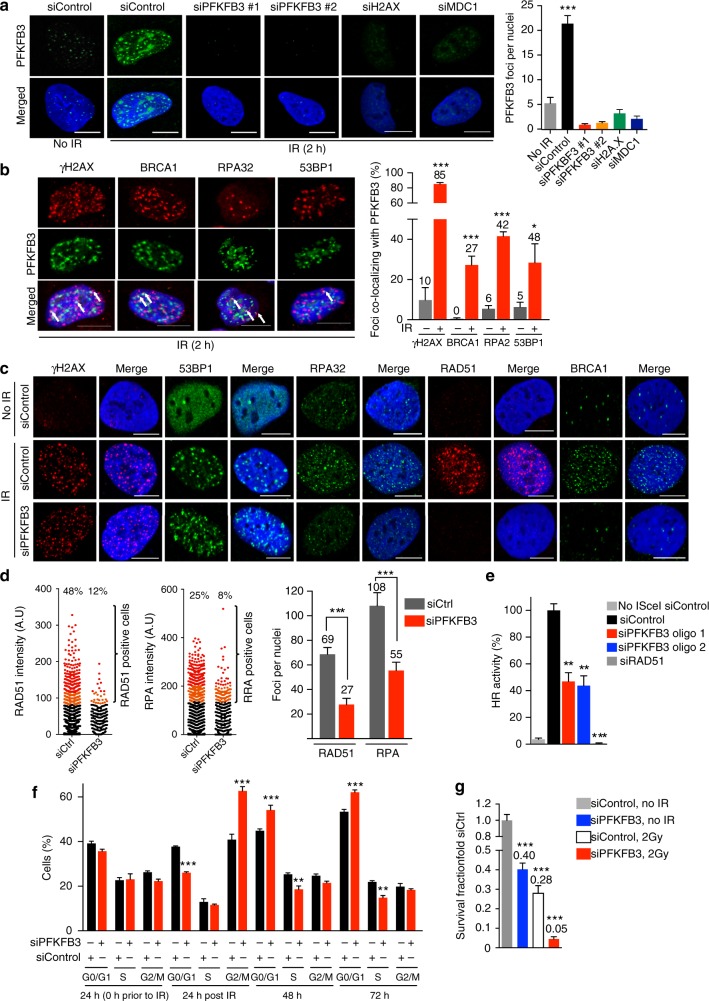
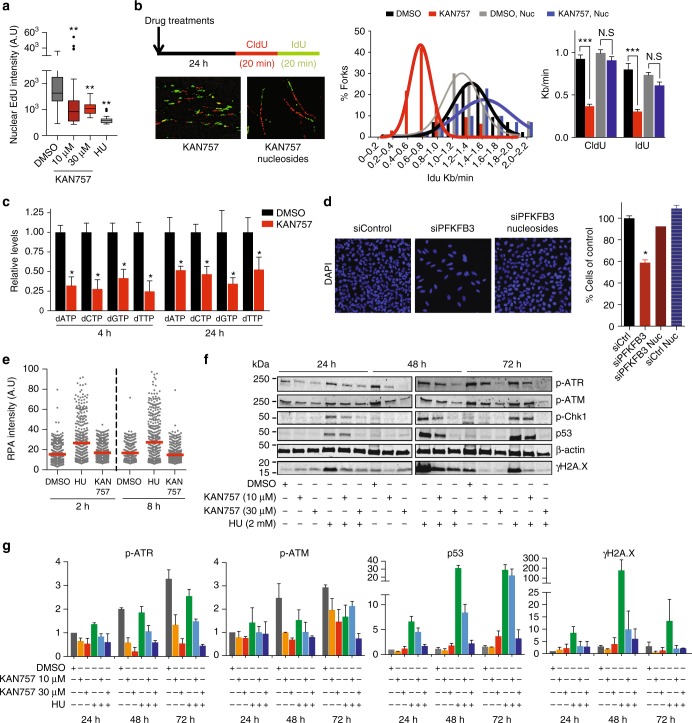
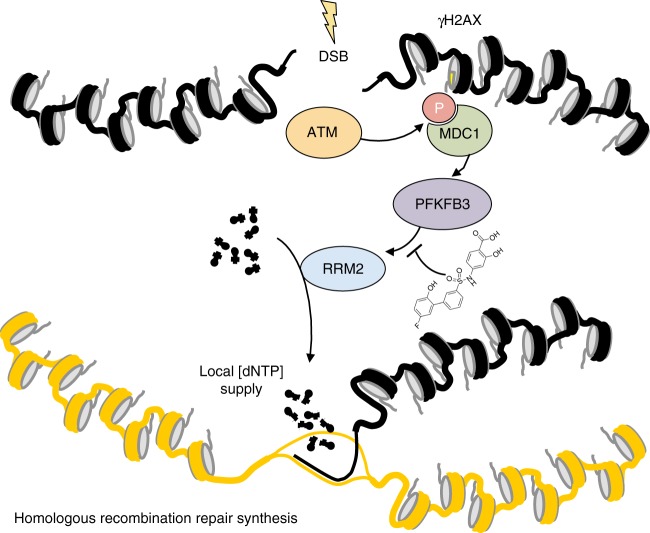
The glycolytic PFKFB3 enzyme is widely overexpressed in cancer cells and an emerging anti-cancer target. Here, we identify PFKFB3 as a critical factor in homologous recombination (HR) repair of DNA double-strand breaks. PFKFB3 rapidly relocates into ionizing radiation (IR)-induced nuclear foci in an MRN-ATM-γH2AX-MDC1-dependent manner and co-localizes with DNA damage and HR repair proteins. PFKFB3 relocalization is critical for recruitment of HR proteins, HR activity, and cell survival upon IR. We develop KAN0438757, a small molecule inhibitor that potently targets PFKFB3. Pharmacological PFKFB3 inhibition impairs recruitment of ribonucleotide reductase M2 and deoxynucleotide incorporation upon DNA repair, and reduces dNTP levels. Importantly, KAN0438757 induces radiosensitization in transformed cells while leaving non-transformed cells unaffected. In summary, we identify a key role for PFKFB3 enzymatic activity in HR repair and present KAN0438757, a selective PFKFB3 inhibitor that could potentially be used as a strategy for the treatment of cancer.


Conflict of interest statement

Kancera AB is developing PFKFB3 inhibitors commercially for treatment of cancer. N.G., K.F., A.H.N., J.S., J.L., C.N., M.N., and T.O. are employed at Kancera AB.

Figures

Fig. 1
Fig. 1
ATM signaling stimulates PFKFB3 recruitment upon DNA damage induction. a Confocal analysis of DNA damage, γH2AX, and nuclear localization of PFKFB3 in U2OS cells following treatment with inhibitors (6 h) as indicated, subjected to IR (6 Gy), or left untreated, n = 3 independent experiments. Scale bar, 10 μm. b Scatter dot plot representing the PFKFB3 nuclear intensity in (a) as quantified using CellProfiler, n > 100 cells/treatment. ***P < 0.001; one-way ANOVA analysis. c Scatter dot plot representing the γH2AX nuclear intensity in (a) as quantified using CellProfiler, n > 100 cells/treatment. **P < 0.01, ***P < 0.001; one-way ANOVA analysis. d Bars representing the percentage of PFKFB3 and γH2AX foci that co-localize in (a) as quantified using CellProfiler, n > 100 cells/treatment. Data are displayed as means ± SEM, ***P < 0.001, one-way ANOVA was used to calculate statistical significance
Fig. 2
Fig. 2
PFKFB3 promotes homologous recombination repair. a Confocal analysis of nuclear localization of PFKFB3 in U2OS cells following treatment with siRNAs (24 h) as indicated, subjected to IR (6 Gy, 2 h recovery), or left untreated, n = 3 independent experiments. Scale bar, 10 μm. To the right, bar chart showing PFKFB3 foci as quantified using CellProfiler, n > 100 cells/treatment. Data are displayed as means ± SEM. ***P < 0.001; one-way ANOVA analysis. b Confocal images of co-localization between PFKFB3 and indicated proteins in U2OS cells upon IR (6 Gy, 2 h recovery). White arrows indicate co-localized foci, n = 2 independent experiments. Scale bar, 10 μm. To the right, bar graph representing the percentage of PFKFB3 foci that co-localized with indicated proteins as quantified using CellProfiler. n > 100 cells/condition. Data displayed as means ± SEM. ***P < 0.001, *P < 0.05; Student’s t-test. c U2OS cells were treated with indicated siRNAs for 24 h, subjected to IR at 6 Gy (2 h recovery) and immunostained for indicated proteins, n = 3 independent experiments. Scale bar, 10 μm. d Scatter dot plot representing the RAD51 or RPA32 nuclear intensity in (c) as quantified using CellProfiler. To the right, bars showing RAD51 or RPA foci per nuclei in (c). n > 500 cells/treatment. Data displayed as means ± SEM. ***P < 0.001; Student’s t-test. e HR activity after treatment of U2OS DR-GFP cells with indicated siRNAs as assessed by FACS analysis, whereby the siControl cells are set as reference cells (100% activity). Data are displayed as means ± SEM, n = 3. **P < 0.01, ***P < 0.001; one-way ANOVA analysis. f DNA histograms of U2OS cells treated with indicated siRNAs for 24 h then subjected to IR at 2 Gy (24 h recovery) or left untreated for 48 and 72 h. Cells were fixed and DNA content was assessed using propidium iodide staining and flow cytometry. Data are displayed as means ± SEM, n = 3. **P < 0.01, ***P < 0.001; one-way ANOVA analysis. g Colony formation of U2OS cells 10 days after treatment with 10 nM siControl or 10 nM siPFKFB3 in combination with 2 Gy or left untreated, was assessed by staining with 4% methylene blue in methanol and counting colonies. Data are displayed as means fold over siControl no IR ± SEM, n > 5. ***P < 0.001; one-way ANOVA analysis
Fig. 3
Fig. 3
Development of PFKFB3 inhibitor. a Illustrative description of the drug discovery process towards identification of KAN0438757 as a PFKFB3 inhibitor. Following measurements of inhibition of human recombinant enzyme, the inhibitory effects on PFKFB3 in cells were demonstrated by intracellular measurements of F-2,6-BP levels by the van Schaftingen assay, thereafter effects on cell viability in different cancer cells were assessed. In parallel, biophysical studies were used to validate mechanism-of-action, selectivity towards related isoenzymes was tested to ascertain a promising selectivity profile, and different ADME assays were carried out to identify a molecule with promising properties. b Chemical structures of the PFKFB3 inhibitors KAN0438241 and the pro-drug KAN0438757. c Comparison of the acid KAN0438241 and its pro-drug KAN0438757 on inhibition of F-2,6-P2 level using the van Shaftingen assay in cells, n= 4. d Comparison of the acid KAN0438241 and its pro-drug KAN0438757 on inhibition of human recombinant PFKFB3 kinase activity. Activity was quantified based on the production of ADP and F-2,6-P2 from ATP and F6P, n= 5. e Stick model of KAN0438241 bound to human PFKFB3. The compound is bound to the fructose-6-phosphate substrate pocket. The stick model is colored according to atom type: oxygen in red, nitrogen in blue, sulfur in yellow, and carbon in white (protein) or pink (KAN0438241). Polar contacts between the compound and protein residues are shown as red dotted lines. The final 2Fo-Fc electron density map for the compound, contoured at 1 s, is shown as blue mesh. The image was prepared using PyMOL. f X-ray structure of human recombinant PFKFB3 in complex with KAN0438241. Crystal structure of KAN04438241 (stickmodel, pdb code 6ETJ) in the substrate pocket of the catalytic domain of PFKFB3. The molecular surface of the pocket is depicted color coded according to the calculated electrostatic charge (positive in blue, negative in red, and neutral in green). The ATP binding site is indicated in the low left part of the picture. The image was generated using the ICM-pro software from Molsoft LLC (www.molsoft.com). g Target engagement and thermal stabilization of PFKFB3 by 10 µM KAN757 (KAN0438757) as compared to DMSO in U2OS cells, assessed by CETSA. Band intensities were quantified using ImageJ, PFKBF3 levels were normalized against β-actin. To the right, bar graph representing the percentage of non-denatured PFKFB3 relative to DMSO at 42 °C, shown is a representative experiment of n = 2
Fig. 4
Fig. 4
PFKFB3 kinase activity is needed for effective DNA repair. a Confocal analysis of IR-induced foci of RAD51 or RPA32 in U2OS cells following treatment with DMSO or 10 μM KAN757 (6 h), subjected to IR (6 Gy, 2 h recovery), or left untreated. Shown is a representative experiment of n = 3. Scale bar, 10 μm. To the right, scatter dot plot representing the intensity of the fluorescent levels of RAD51 or RPA32 as assessed by quantifying nuclear intensity using CellProfiler, n > 500 cells/treatment. b Bar chart showing the percentage of foci per nuclei in (a) as quantified using CellProfiler. Data are displayed as means ± SEM, **P < 0.01, *P < 0.05; Student’s t-test. c HR activity after treatment of U2OS DR-GFP cells with indicated inhibitors as assessed by FACS analysis. DMSO treated cells are taken as reference cells (100% activity). Data are displayed as means ± SEM, n = 3. ***P < 0.001; Student’s t-test. d DNA damage levels were assessed using γH2AX staining, U2OS cells were treated with DMSO or KAN0438757 for 6 h, subjected to IR (6 Gy, 2 h, and 24 h recovery), and immunostained for γH2AX. Scale bar, 10 μm. Right panel, quantification of average γH2AX IRIF per cell and percentage of γH2AX positive cells (>10 γH2AX foci per cell) using CellProfiler. Data are displayed as means, n > 500 cells/treatment. **P < 0.01; one-way ANOVA analysis. e U2OS cells were treated with DMSO, 10 μM of KAN757 or 10 μM of KU55933 (ATM inhibitor) for 24 h, exposed to IR (6, 10, and 15 Gy) and harvested at the indicated time points. Whole cell extracts were prepared and protein levels were analyzed by western blot using indicated antibodies, β-actin was used as loading control. Shown is a representative experiment of n = 3. f Colony formation of U2OS cells upon PFKFB3 inhibition. U2OS cells were treated with DMSO or 10 μM KAN757 for 3 days, then exposed to indicated doses of IR or left untreated, inhibitors were washed out and 5 days later colonies were stained with 4% methylene blue-MeOH and counted. Data are displayed as means ± SEM, n = 3. **P < 0.01, ***P < 0.001; one-way ANOVA analysis. g Colony formation upon PFKFB3 inhibition in transformed and non-transformed cells. BJ TERT or RAS cells were treated with vehicle (DMSO) or indicated concentrations of inhibitors for 3 days, exposed to IR (2 Gy), or left untreated. Inhibitors were washed out 24 h post IR and 4 days (RAS) or 7 days (TERT) later colonies were stained with 4% methylene blue-MeOH and counted. Data are displayed as means ± SEM, n > 3. **P < 0.01, ***P < 0.001; one-way ANOVA analysis. KAN757 = KAN0438757
Fig. 5
Fig. 5
PFKFB3 kinase activity supports DNA repair synthesis. a U2OS cells were treated with DMSO or 10 μM KAN757 (6 h), exposed to IR (6 Gy, 0.5 h, 2 h, and 24 h recovery), or left untreated. At each time-point, cells were pulsed 30 min with 10 µM EdU, harvested, and fixed. DNA was stained with Hoechst and EdU detected by fluorophore conjugation for flow cytometry analysis. Bars indicate the number of EdU-positive cells in the G2/M phase. Data are displayed as means ± SEM, n = 3. ***P < 0.001; one-way ANOVA analysis. KAN757 = KAN0438757. b Representative images of confocal analysis of IR-induced foci of PFKFB3 and RRM2 in U2OS cells following treatments (6 h) as indicated, subjected to IR (6 Gy, 2 h recovery), or left untreated. Bar chart on the right shows the percentage of cells with PFKFB3 foci co-localizing with RRM2 foci (>10 colocalizing foci/cell), >100 cells/condition. Data are displayed as means ± SEM, n = 2. ***P < 0.001; one-way ANOVA analysis. KAN757 = KAN0438757. c Confocal analysis of RRM2 and PFKFB3 recruitment upon IR (6 Gy, 2 h recovery) in U2OS cells treated with indicated siRNA for 24 h or left untreated. To the right, bar chart showing quantification of cells with PFKFB3 foci co-localizing with RRM2 foci (>10 colocalizing foci/cell), >100 cells/condition. Data are displayed as means ± SEM, n = 2. **P < 0.01, *P < 0.05; one-way ANOVA analysis. d FLAG-PFKFB3 or FLAG transfected U2OS cells were exposed to IR (6 Gy) or left untreated. At 2 h post-IR cells were subjected to immunoprecipitations followed by immunoblot with FLAG antibody. Shown is a representative experiment of n = 3. e HR activity after treatment of U2OS DR-GFP cells with indicated siRNAs as assessed by FACS analysis, whereby the siControl cells are set as reference cells (100% activity). Data are displayed as mean ± SEM, n = 3. **P < 0.01; one-way ANOVA analysis
Fig. 6
Fig. 6
Nucleoside supplementation restores proliferation of PFKFB3 inhibited cells. a Effects on DNA synthesis of U2OS cells treated with DMSO or indicated concentrations of KAN757 (4 h), pulsed with 10 μM EdU for 40 min, followed by fixation, fluorescent labeling, and quantification in CellProfiler, >100 cells were analyzed per condition, n = 2. **P < 0.01; one-way ANOVA analysis. b Schematic representation of the DNA fiber assay and representative images of DNA strands incorporating CldU (red) and IdU (green) from U2OS cells that have received treatment with 10 μM KAN757 supplemented with or without 30 μM nucleosides. Graphs show the distribution of average fork speed and calculated mean fork speed for the indicated treatments (n > 100 forks per condition). Data are displayed as means ± SEM, n = 3. ***P < 0.001; Student’s t-test. c dNTP measurements of U2OS cells treated as indicated. Relative levels of dNTPs were calculated relative to DMSO. Data are displayed as mean ± SEM, n = 2. *P < 0.05; Student’s t-test. d Metabolic rescue of the proliferation of U2OS cells following 10 nM siControl or siPFKFB3 treatments and supplementation with or without 30 μM nucleosides was assessed by DAPI staining and counting nuclei using CellProfiler. siControl cells are set as reference cells. Data are displayed as means ± SEM, n = 2. *P < 0.05; one-way ANOVA analysis. e Scatter dot plot representing the nuclear intensity of the fluorescence levels of RPA32 in U2OS cells following treatment with DMSO or indicated inhibitors as quantified using CellProfiler. Lines represent mean fluorescence, n > 500 cells/treatment. f Representative immunoblots (of n = 2) of U2OS cells treated with DMSO, KAN757 (10, 30 µM) and/or HU (2 mM) for indicated time points. Bands correspond to whole cell extracts, β-actin was used as loading control. g Bar charts representing relative levels of phosphorylated ATR and ATM, p53 and γH2AX in (f). Densitometric analysis was performed using Image StudioTM Lite Software. Signal intensity data were normalized against β-actin and then normalized to DMSO 24 h. Data are displayed as means ± SD, n = 2 independent experiments. KAN757 = KAN0438757
Fig. 7
Fig. 7
PFKFB3 mediates ATM-dependent break-induced dNTP supply. MRE-ATM-γH2AX-MDC1 signaling recruits PFKFB3 into nuclear foci, within the DNA damage response upon IR. PFKFB3 activity is required for subsequent recruitment of the RRM2 subunit of ribonucleotide reductase to sites of DNA damage to potentially generate a local dNTP pool. Inhibition of PFKFB3 activity impairs IR-induced repair synthesis, homologous recombination, and replication fork progression, which is restored by nucleoside supplementation

References

    1. Cuadrado M, Martinez-Pastor B, Fernandez-Capetillo O. ATR activation in response to ionizing radiation: still ATM territory. Cell Div. 2006;1:7. doi: 10.1186/1747-1028-1-7. - DOI - PMC - PubMed
    1. Rupnik A, Lowndes NF, Grenon M. MRN and the race to the break. Chromosoma. 2010;119:115–135. doi: 10.1007/s00412-009-0242-4. - DOI - PubMed
    1. Khanna KK, Jackson SP. DNA double-strand breaks: signaling, repair and the cancer connection. Nat. Genet. 2001;27:247–254. doi: 10.1038/85798. - DOI - PubMed
    1. Stewart GS, Wang B, Bignell CR, Taylor AM, Elledge SJ. MDC1 is a mediator of the mammalian DNA damage checkpoint. Nature. 2003;421:961–966. doi: 10.1038/nature01446. - DOI - PubMed
    1. Baumann P, Benson FE, West SC. Human Rad51 protein promotes ATP-dependent homologous pairing and strand transfer reactions in vitro. Cell. 1996;87:757–766. doi: 10.1016/S0092-8674(00)81394-X. - DOI - PubMed

Publication types

MeSH terms