. 2018 Sep 24;9(1):3891.
doi: 10.1038/s41467-018-06393-w.

Maternal gut and breast milk microbiota affect infant gut antibiotic resistome and mobile genetic elements

Affiliations

Maternal gut and breast milk microbiota affect infant gut antibiotic resistome and mobile genetic elements

Katariina Pärnänen et al. Nat Commun. .

Abstract

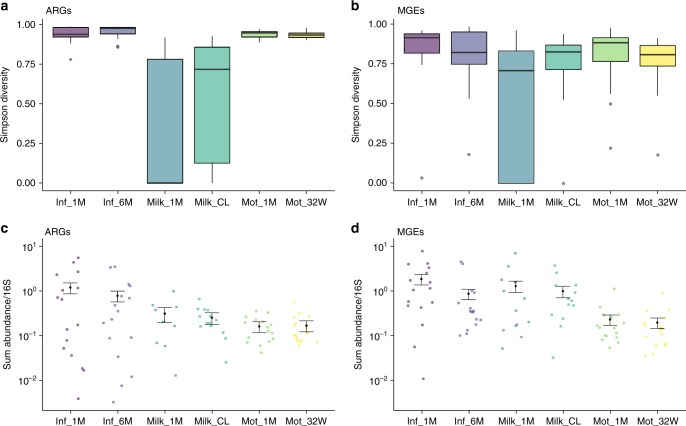
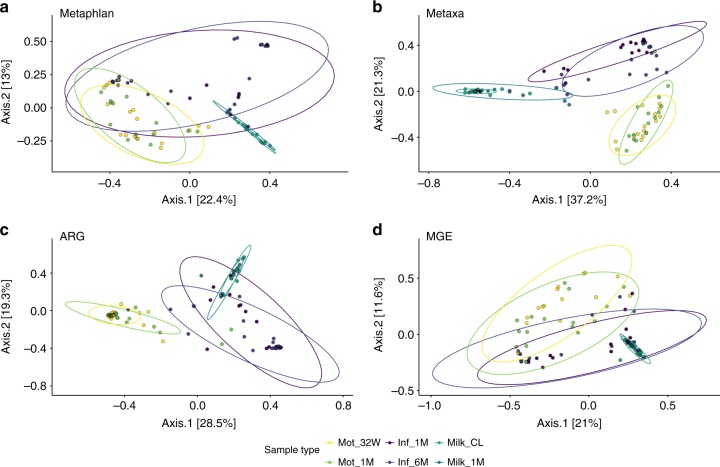
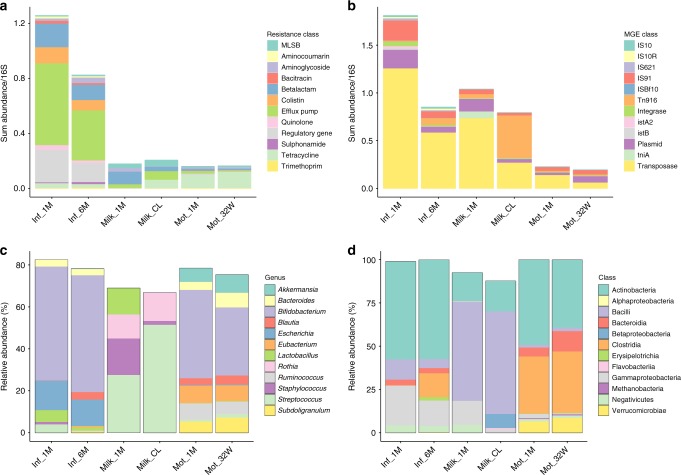
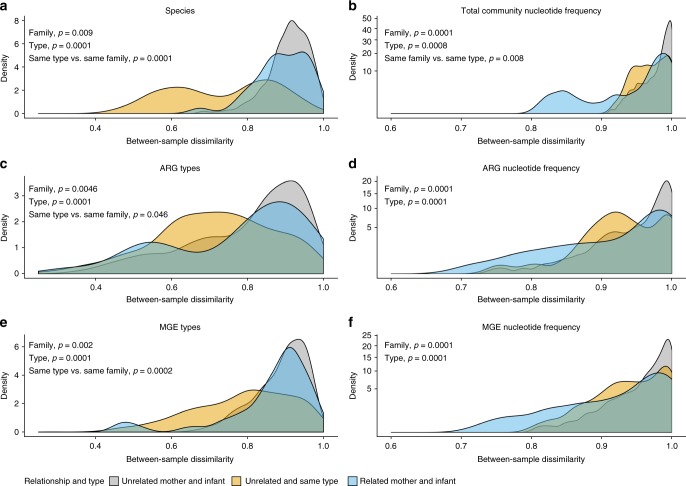
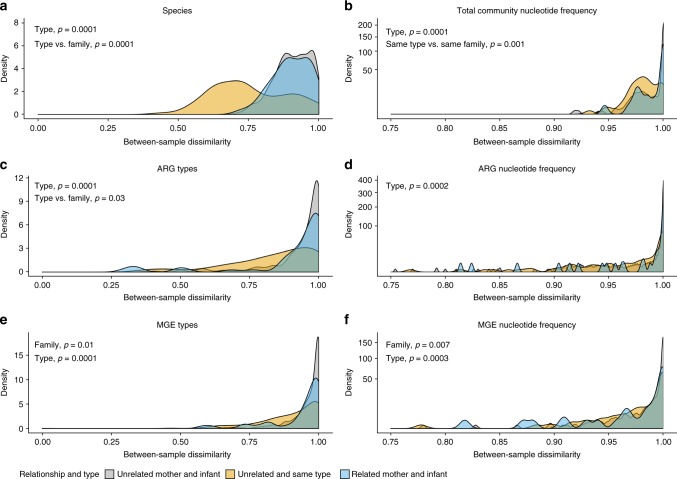
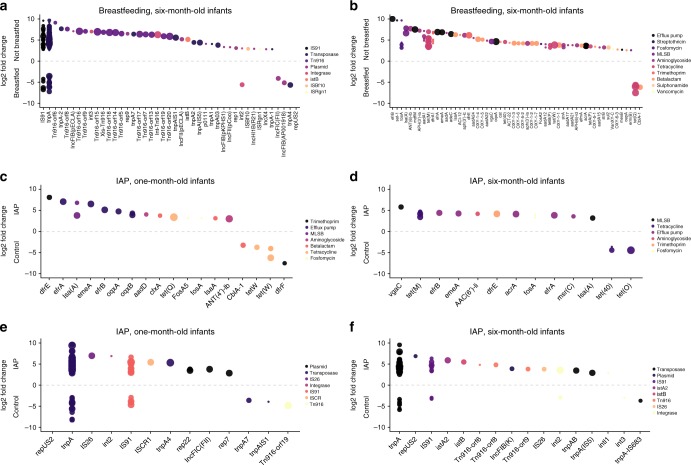
The infant gut microbiota has a high abundance of antibiotic resistance genes (ARGs) compared to adults, even in the absence of antibiotic exposure. Here we study potential sources of infant gut ARGs by performing metagenomic sequencing of breast milk, as well as infant and maternal gut microbiomes. We find that fecal ARG and mobile genetic element (MGE) profiles of infants are more similar to those of their own mothers than to those of unrelated mothers. MGEs in mothers' breast milk are also shared with their own infants. Termination of breastfeeding and intrapartum antibiotic prophylaxis of mothers, which have the potential to affect microbial community composition, are associated with higher abundances of specific ARGs, the composition of which is largely shaped by bacterial phylogeny in the infant gut. Our results suggest that infants inherit the legacy of past antibiotic consumption of their mothers via transmission of genes, but microbiota composition still strongly impacts the overall resistance load.


Conflict of interest statement

The authors declare no competing interests.

Figures

Fig. 1
Fig. 1
Simpson diversity of ARGs and MGEs and their relative sum abundances. a ARG diversity. b MGE diversity. c ARG sum relative abundances. d MGE sum relative abundances. The relative sum abundances are calculated per copy of 16S rRNA gene and normalized by gene lengths. Each colored point represents one sample. Predicted mean and standard error from the negative binomial GLM is drawn in black. Sample names are as follows: Inf_1M = 1-month-old infants, Inf_6M = 6-month-old infants, Mot_32W = mother fecal samples gestational week 32, Mot_1M = mother fecal samples one month postpartum, Milk_CL = colostrum or milk produced within 7 days after delivery, Milk_1M = milk 1 month postpartum. Each sample type has an n of 16. In boxplots a and b, the lower hinge represents 25% quantile, upper hinge 75% quantile and center line the median. Notches are calculated with the formula median ± 1.58 * interquartile range/sqrt(n). Negative binomial general linearized models (GLMs) were used to predict the means and standard errors (SEs) of the relative sum abundances in different sample types. The notches in c and d represent SEs and means are represented as black points
Fig. 2
Fig. 2
PCoA of microbiomes, resistomes, and MGEs using relative abundance. a Species level taxonomic identification done based on single copy marker genes with Metaphlan2. b Taxonomic profiling based on 16S rRNA reads retrieved using Metaxa2. c Resistome profiles based on reads mapped against an ARG database and normalized to 16S rRNA gene reads and gene lengths. d MGE profiles based on read mapping against a custom MGE database. Horn-Morisita similarity indexes were used to calculate between sample overlap for the ordinations. The confidence ellipses are drawn with confidence level of 0.90. Sample names are as follows: Inf_1M = 1-month-old infants, Inf_6M = 6-month-old infants, Mot_32W = mother fecal samples gestational week 32, Mot_1M = mother fecal samples 1 month postpartum, Milk_CL = colostrum or milk produced within 7 days after delivery, Milk_1M = milk 1 month postpartum. The significances and R2-values of differences between samples are represented in Supplementary Tables 6 and 7
Fig. 3
Fig. 3
Abundant bacteria, ARGs, and MGEs in breast milk and infants’ and mothers’ gut. a Most abundant resistance classes b Most abundant MGE classes. c Most abundant genera based on Metaphlan2 taxonomy profiling. d Most abundant classes based on Metaphlan2 taxonomy profiling. ARG and MGE sum abundances are normalized to 16S rRNA gene as in Fig. 1 and depicted on the y-axis in a and b. The mean relative abundances for taxa, expressed as percentages, are depicted on the y-axis in c and d. Sample names are as follows: Inf_1M = 1-month-old infants, Inf_6M = 6-month-old infants, Mot_32W = mother fecal samples gestational week 32, Mot_1M = mother fecal samples 1 month postpartum, Milk_CL = colostrum or milk produced within 7 days after delivery, Milk_1M = milk 1 month postpartum
Fig. 4
Fig. 4
Dissimilarities of infant and mothers’ gut microbiota, resistomes, and MGEs. a Dissimilarity of microbial community on species level between infants and mothers using Metaphlan2 species classifications. b Dissimilarity of microbial communities in infants and mothers using DNA sequence profiles calculated based on kmer profiles. c Dissimilarity of resistomes between infants and mothers using gene type annotations. d Dissimilarity between resistomes using DNA sequence profiles of genes calculated based on kmer profiles. e Dissimilarity of MGEs between infants and mothers using gene type annotations. f Dissimilarity between MGEs using DNA sequence profiles of genes calculated based on kmer profiles. Dissimilarities between related and unrelated infant-mother pairs were compared. Type notion indicates that mothers and infants are significantly different from each other, family indicates that infant’s feces are more similar to mother’s feces than to that of unrelated women, same type vs. same family indicates that infants are more similar to each other than to their own mothers. Significance of differences was tested using ANOVA between the similarity indexes in the comparisons and p-values < 0.05 are indicated in the figures. The density plot depicts where comparisons between sample pairs are located on the dissimilarity scale. The higher the density is at a given dissimilarity, the more pairwise comparisons have the given dissimilarity value. Density of the samples is plotted on the y-axis and the x-axis depicts the between sample Jaccard similarity index of species, ARGs and MGEs shared between sample types using presence–absence data or DNA sequence profiles based on kmers calculated with sourmash. DNA sequence profiles provide a way to compare DNA sequence signatures of samples with each other and does not rely on species or gene annotations. The x-axis ranges from 0 (no dissimilarity, i.e., completely similar) to 1 (complete dissimilarity)
Fig. 5
Fig. 5
Dissimilarities of infant gut and breast milk microbiota, resistomes, and MGEs. a Dissimilarity of microbial communities using Metaxa2 taxonomy profiles based on 16S rRNA genes between breast milk and infant feces. b Dissimilarity of microbial communities in infants and breast milk using DNA sequence profiles calculated based on kmers. c Dissimilarity of resistomes of breast milk and infant’s feces. d Similarity of resistomes between breast milk and mother’s feces. e Dissimilarity of MGEs between breast milk and infants’ feces. f Dissimilarity of MGEs between breast milk and mothers’ feces. Dissimilarities between related and unrelated infant-mother pairs were compared. Notion type indicates that breast milk and feces are significantly different from each other, family indicates that mother’s breast milk is more similar to related infant’s feces than to unrelated infant’s feces, type vs. family indicates that breast milk samples are more similar to each other than to feces samples from the infant from the same family, family vs. type indicates that breast milk and feces samples are more similar to samples from family members than to a sample of the same type. Significance of differences was tested using ANOVA between the similarity indexes in the comparisons and p-values < 0.05 are indicated in the figures. The density plot depicts where comparisons between sample pairs are located on the dissimilarity scale. The higher the density is at a given dissimilarity, the more pairwise comparisons have the given dissimilarity value. Density of the samples is plotted on the y-axis and the x-axis depicts the between sample Jaccard dissimilarity index of species, ARGs and MGEs shared between sample types using presence–absence data or DNA sequence profiles based on kmers calculated with sourmash. DNA sequence profiles provide a way to compare DNA sequence signatures of samples with each other and does not rely on species or gene annotations. The x-axis ranges from 0 (no dissimilarity) to 1 (complete dissimilarity)
Fig. 6
Fig. 6
Differentially abundant ARGs and MGEs in 6-month-old infants. a MGEs differentially abundant due to breastfeeding in 6-month-old infants compared to non-breastfed infants. b ARGs differentially abundant in breastfed infants at 6 months, c ARGs differentially abundant in 1-month-old infants due to IAP. d ARGs differentially abundant in 6-month-old infants due to IAP. e MGEs differentially abundant due to IAP in 1-month-old infants. f MGEs differentially abundant due to IAP in 6-month-old infants. Genes that have negative fold changes are more abundant in the non-breastfed and IAP groups. Sizes depict the number of samples each gene was found in (n = 1–10), color represents ARG or MGE class. The y-axis shows log2 fold changes and the x-axis denotes gene names

References

    1. WHO World Health Organization. Antimicrobial resistance: global report on surveillance. Available at: http://www.who.int/drugresistance/documents/surveillancereport/en/. (2014). Accessed 27 Sept 2017.
    1. Wright GD. The antibiotic resistome: the nexus of chemical and genetic diversity. Nat. Rev. Microbiol. 2007;5:175–186. doi: 10.1038/nrmicro1614. - DOI - PubMed
    1. Levy SB, Marshall B. Antibacterial resistance worldwide: causes, challenges and responses. Nat. Med. 2004;10:S122–S129. doi: 10.1038/nm1145. - DOI - PubMed
    1. Costello EK, Stagaman K, Dethlefsen L, Bohannan BJM, Relman DA. The application of ecological theory toward an understanding of the human microbiome. Science. 2012;336:1255–1262. doi: 10.1126/science.1224203. - DOI - PMC - PubMed
    1. Laxminarayan R, et al. Access to effective antimicrobials: a worldwide challenge. Lancet. 2016;387:168–175. doi: 10.1016/S0140-6736(15)00474-2. - DOI - PubMed

Publication types

Substances