. 2018 Sep 24;8(1):14297.
doi: 10.1038/s41598-018-32722-6.

Human hepatic 3D spheroids as a model for steatosis and insulin resistance

Affiliations

Human hepatic 3D spheroids as a model for steatosis and insulin resistance

Mikael Kozyra et al. Sci Rep. .

Abstract

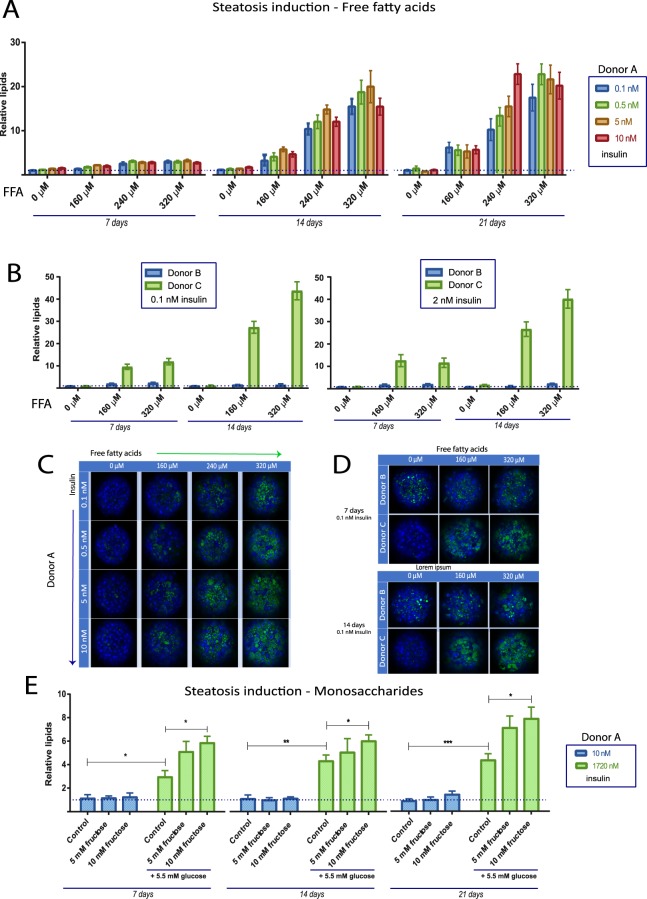
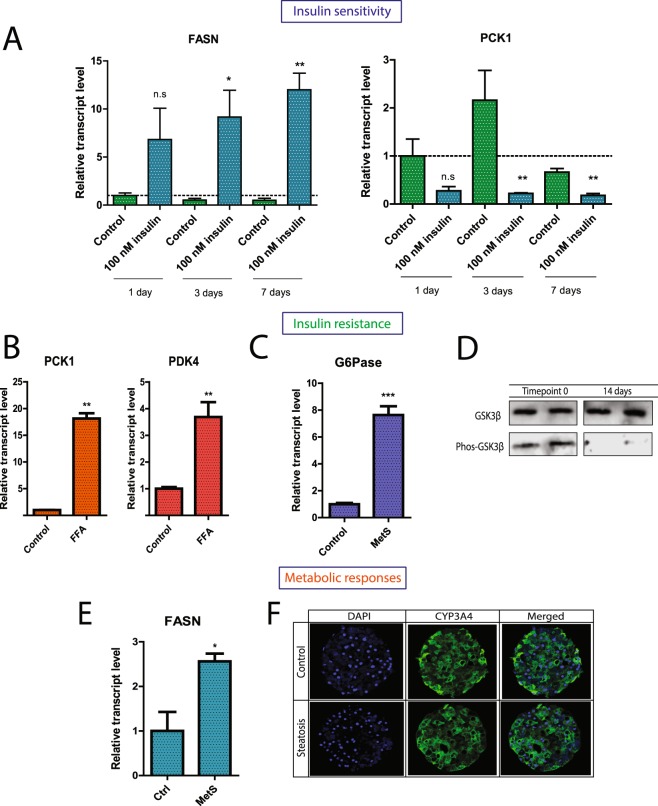
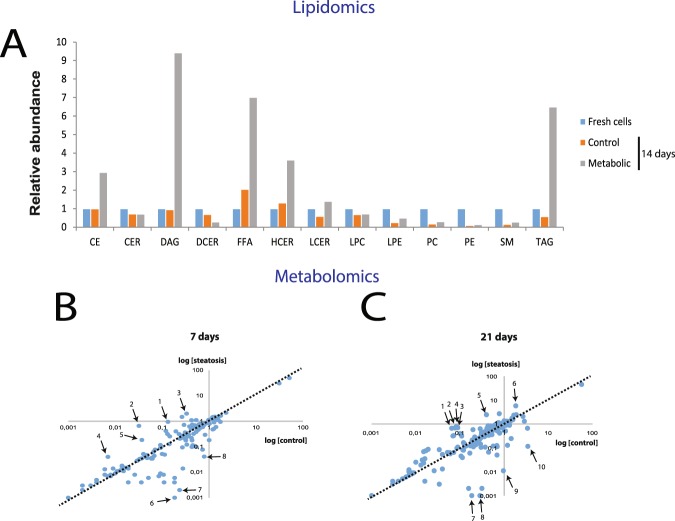
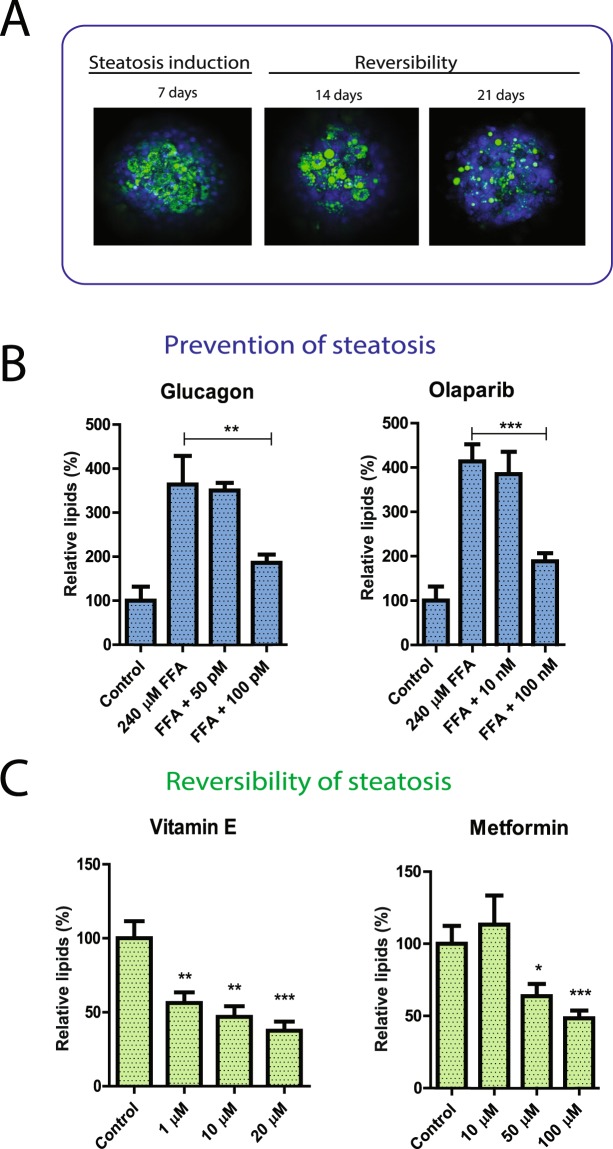
Non-alcoholic fatty liver disease (NAFLD) has emerged as a public health concern as reflected in its widespread distribution in the general population. Yet, treatment options are scarce which is at least in part due to lack of reliable human in vitro disease models. Here, we report a human hepatic 3D spheroid system cultured under defined chemical conditions that has the potential to mimic steatotic conditions in a reversible manner, useful for identification of novel drug treatment conditions. Primary human hepatocytes (PHH) from different donors were cultured as spheroid microtissues in physiological in vivo -like culture conditions. Hepatic steatosis was induced over the course of three weeks in culture by supplementing the culture medium with pathophysiological concentrations of free fatty acids, carbohydrates and insulin. Effects of steatosis in the 3D system were evaluated on transcriptional, metabolomic and lipidomic levels. Free fatty acids on one hand as well as a combination of insulin and monosaccharides, promoted lipid accumulation in hepatocytes and increased expression of lipogenic genes, such as fatty acid synthase. This milieu also promoted development of insulin resistance within 2 weeks as manifested by an increase in gluconeogenic and insulin resistance markers, which are observed in type 2 diabetes mellitus and metabolic syndrome. Induced steatosis was reversible after withdrawal of lipogenic substrates and a further reduction in cellular fat content was observed following treatment with different antisteatotic compounds, such as metformin, glucagon, olaparib and antioxidants. Taken together, these results demonstrate that the 3D hepatic spheroids can serve as a valuable, HTS compatible model for the study of liver steatosis and facilitate translational discovery of novel drug targets.


Conflict of interest statement

M.I.S. and V.M.L. are Co-founders of HepaPredict AB.

Figures

Figure 1
Figure 1
Induction of hepatic steatosis with free fatty acids, monosaccharides and insulin in three different donors. (A) Spheroids from donor A were treated with an equal mix of oleic and palmitic acid bound to albumin (final concentrations 160 µM, 240 µM and 320 µM respectively) as well as different concentrations of insulin (0.1 nM to 10 nM). Cell nuclei as well as lipid accumulation was visualized utilizing Hoechst 33342 and Nile Red staining. Neutral lipid content in each spheroid was quantified with CellProfiler Software and normalized to the size of each spheroid. (B) Induction of hepatic steatosis in donor B and C. The relative neutral lipid abundance in each donor is compared to the corresponding control of each donor, which was set to 1 for both donors. (C) Representative confocal images after induction of hepatic steatosis with free fatty acids and insulin after 14 days from donor A. (D) Representative picture of spheroids after induction of hepatic steatosis after 7 and 14 days in donor B and C. (E) Induction of hepatic steatosis with monosaccharides (glucose and fructose) and insulin. Abbreviations: FFA = Free fatty acids *p < 0.05, **p < 0.01, ***p < 0.001.
Figure 2
Figure 2
Spheroids are insulin sensitive, develop insulin resistance after induction of hepatic steatosis and express key lipogenic genes. (A) Spheroids from donor A were stimulated with 0.1 nM (control) or 100 nM insulin, respectively, every 24 hours and spheroid RNA was isolated after 1, 3 and 7 days respectively. FASN and PCK1 gene expression was assessed relative to control with qPCR normalized to the endogenous expression of the housekeeping RNA 18S. (B) Gene expression of PCK1 and PDK4 14 days after induction of steatosis. Steatosis was induced with 320 µM free fatty acids, and insulin concentration was held stable. (C) Gene expression of glucose-6-phosphatase (G6Pase) after 7 days in culture. MetS = ‘metabolic syndrome’: 11 mM glucose, 160 µM free fatty acids and 1,720 nM insulin. (D) Western Blot of steatotic spheroids revealed a clear reduction in phosphorylation of GSK3β after 14 days of treatment with 160 µM free fatty acids in addition to 11 mM glucose and 1,720 nM insulin. (E) FASN expression following induction of steatosis. (F) Staining of CYP3A4 in control and steatotic spheroids after 10 days revealed unaltered expression of CYP3A4 in the hepatic spheroids. Spheroids were treated with 320 µM free fatty acids in addition to 11 mM glucose and 1,720 nM insulin. Representative image from 3 replicates *p < 0.05, **p < 0.01, ***p < 0.001.
Figure 3
Figure 3
Lipidomic and metabolomic profiles of hepatic spheroids after induction of fatty liver disease. (A) Lipidomic analysis of fresh cells from donor A as well as spheroids exposed to either control (healthy) or pathological media (“metabolic syndrome”) for 14 days after spheroid formation. In total, spheroids corresponding to 1,008,000 cells were harvested for each sample. Control medium contained 0.1 nM insulin and 5.5 mM glucose, whereas “metabolic syndrome” conditions consisted of 10 nM insulin, 5.5 mM glucose, 10 mM fructose and 320 µM free fatty acids (1:1 oleic and palmitic acid). Abbreviations: CE = cholesterol esters, CER = ceramide, DAG = diglyceride, DCER = dihydroceramide, FFA = free fatty acids, HCER = hydroxyceramide, LCER = lactosylceramide, LPC = lysophosphatidylcholine, LPE = lysophosphosphatidylethanolamine, PC = phosphatidylcholine, PE = phosphatidylethanolamine, SM = sphingomyelin). (B) Metabolomic analysis of secreted extracellular metabolites at 7 days after spheroid formation from donor A. Steatosis was induced with elevated insulin (10 nM) and 320 µM FFA. In total 147 unique metabolites were identified. The relative abundance of the metabolites in the two respective conditions are presented as logarithmic values. The outliers are specified in Supplemental Table 2. (C) Metabolomic analysis at 21 days after spheroid formation from donor A. Outliers are specified in Supplemental Table 3.
Figure 4
Figure 4
Steatosis can be reversed in hepatic spheroids and successfully treated with various types of drugs. (A) Reversal of induced hepatic steatosis with healthy medium. Spheroids from donor A were made steatotic by treatment with elevated concentration of free fatty acids (320 µM) for seven days and the spheroids were thereafter cultivated in the healthy medium (0.1 nM insulin, 5.5 mM glucose) in the absence of free fatty acids for 14 days. Cell nuclei as well as triglyceride accumulation was visualized utilizing Hoechst 33342 and Nile Red staining after 7, 14 and 21 days. The pictures are representative images of two independent experiments. (B) Prevention of steatosis by co-treatment with glucagon (50 and 100 pM) and olaparib (10 and 100 nM). Spheroids from donor A were treated with glucagon and olaparib for 10 days in the presence of 240 µM free fatty acids. Lipid levels were quantified using AdipoRed biochemical quantification assay in two independent experiments. (C) Reversibility of steatosis. Hepatic spheroids from donor A were made steatotic by treatment with 320 µM free fatty acids during 7 days. The spheroids were thereafter cultivated in medium without free fatty acids with or without vitamin E and metformin. Lipid levels were quantified using both AdipoRed biochemical quantification assay and confocal microscopy in two independent experiments. The effect of drug treatment is related to the corresponding control without drugs of steatosis stimulating factors. Data are results from the AdipoRed biochemical quantification assay *p < 0.05, **p < 0.01, ***p < 0.001.

References

    1. Younossi ZM, et al. Global epidemiology of nonalcoholic fatty liver disease-Meta-analytic assessment of prevalence, incidence, and outcomes. Hepatology (Baltimore, Md.) 2016;64:73–84. doi: 10.1002/hep.28431. - DOI - PubMed
    1. Brunt EM, et al. Nonalcoholic fatty liver disease. Nat Rev Dis Primers. 2015;1:15080. doi: 10.1038/nrdp.2015.80. - DOI - PubMed
    1. Kleiner DE, et al. Design and validation of a histological scoring system for nonalcoholic fatty liver disease. Hepatology (Baltimore, Md.) 2005;41:1313–1321. doi: 10.1002/hep.20701. - DOI - PubMed
    1. Finkelstein J, Heemels M-T, Shadan S, Weiss U. Lipids in health and disease. Nature. 2014;510:47–47. doi: 10.1038/510047a. - DOI - PubMed
    1. Almeda-Valdes P, Cuevas-Ramos D, Aguilar-Salinas CA. Metabolic syndrome and non-alcoholic fatty liver disease. Annals of hepatology. 2009;8(Suppl 1):S18–24. - PubMed

Publication types

MeSH terms