. 2018 Oct;562(7725):76-81.
doi: 10.1038/s41586-018-0549-5. Epub 2018 Sep 24.

The interaction landscape between transcription factors and the nucleosome

Affiliations

The interaction landscape between transcription factors and the nucleosome

Fangjie Zhu et al. Nature. 2018 Oct.

Abstract

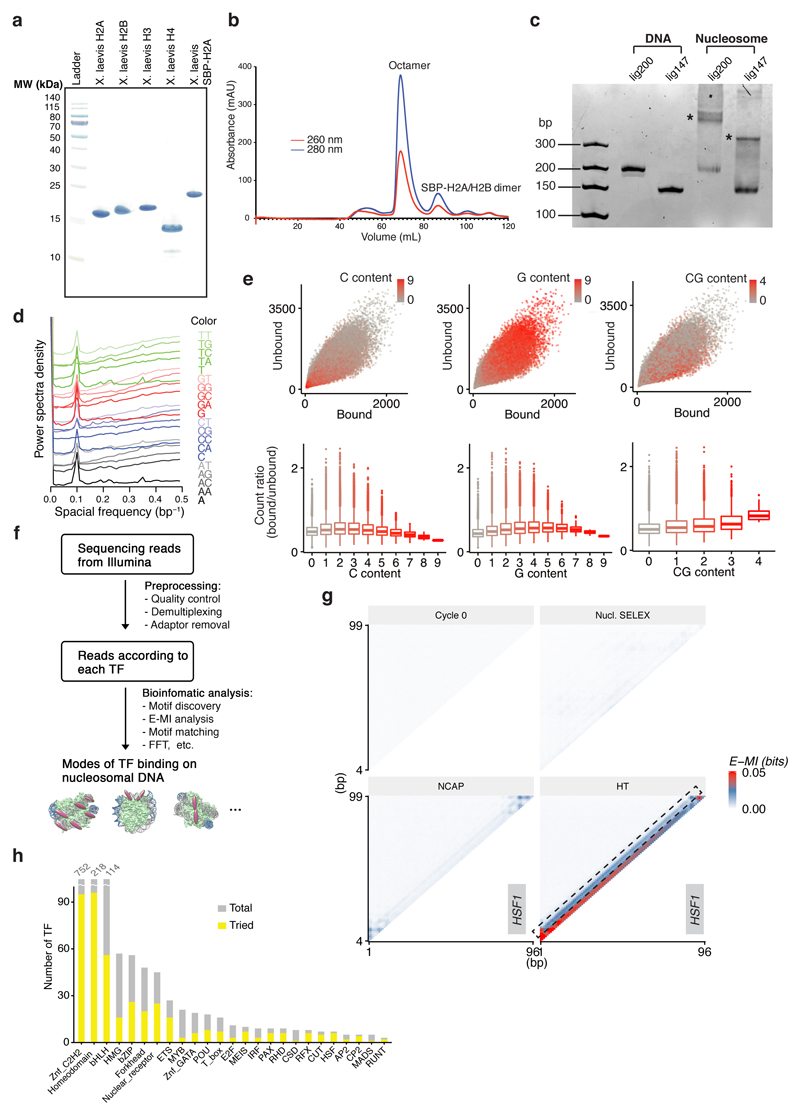
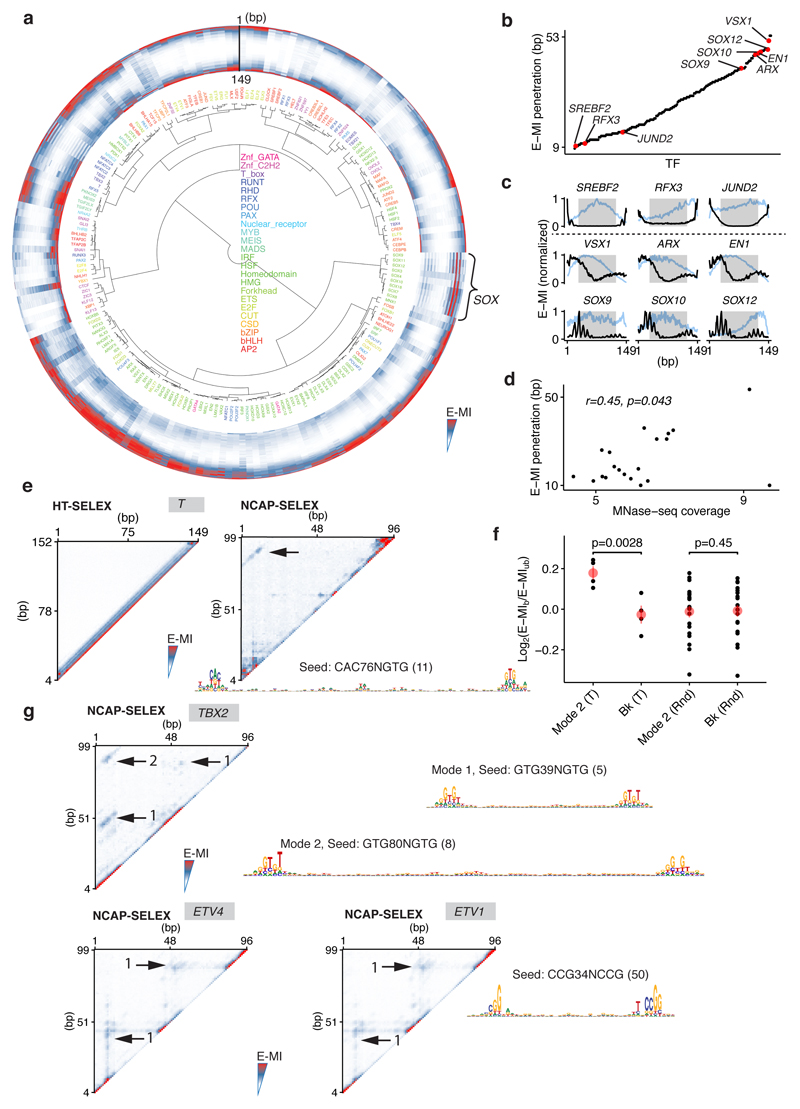
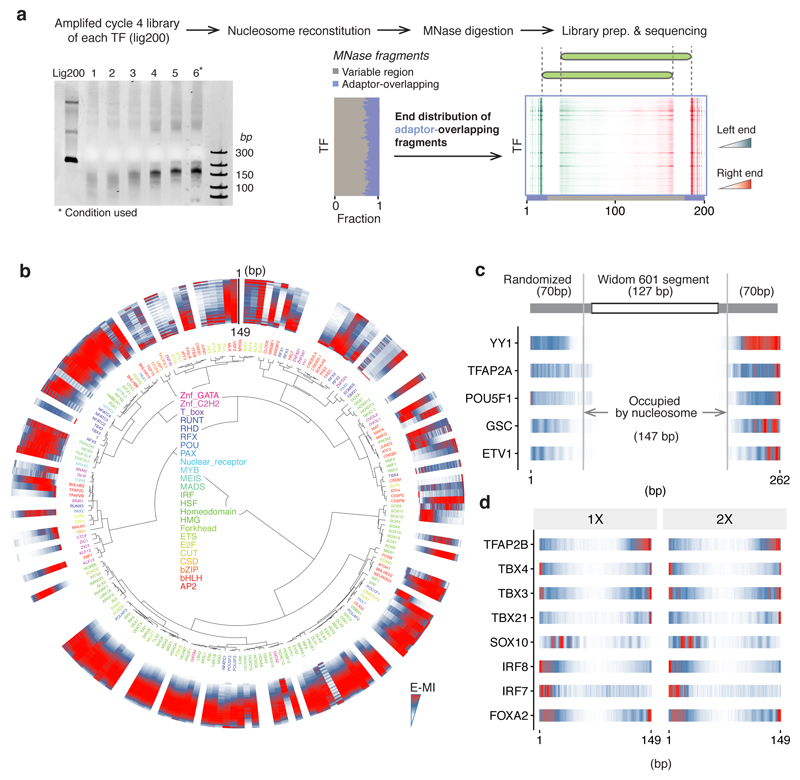
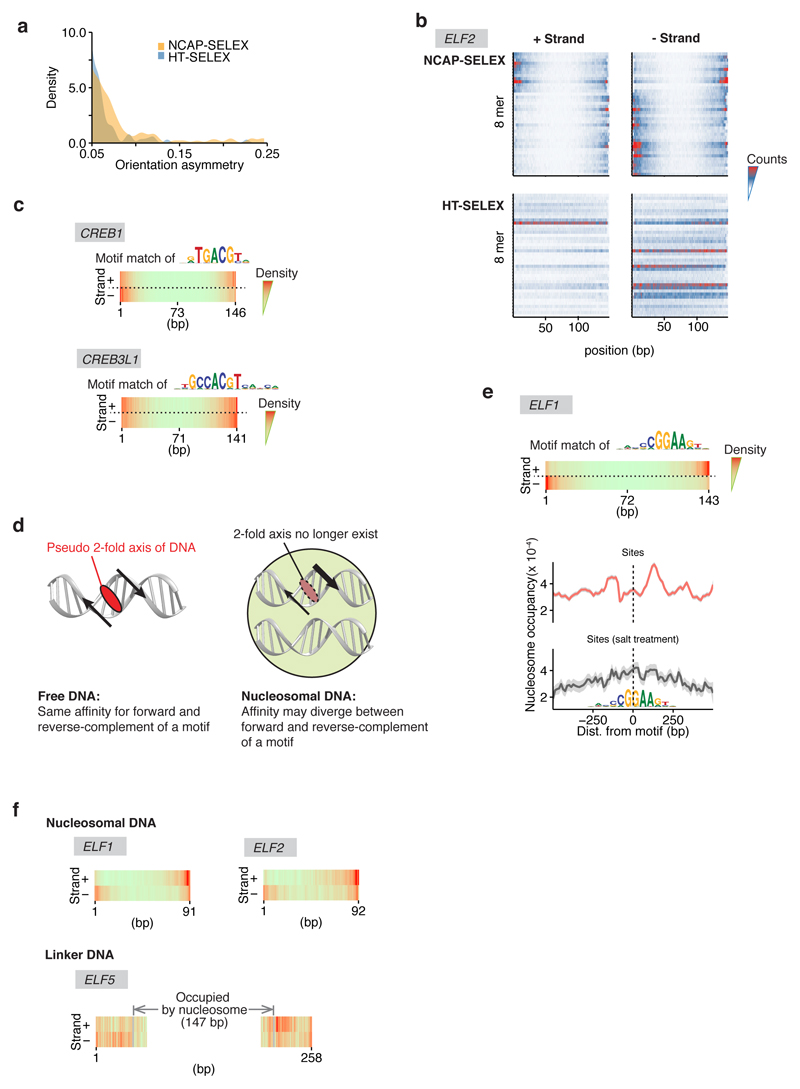
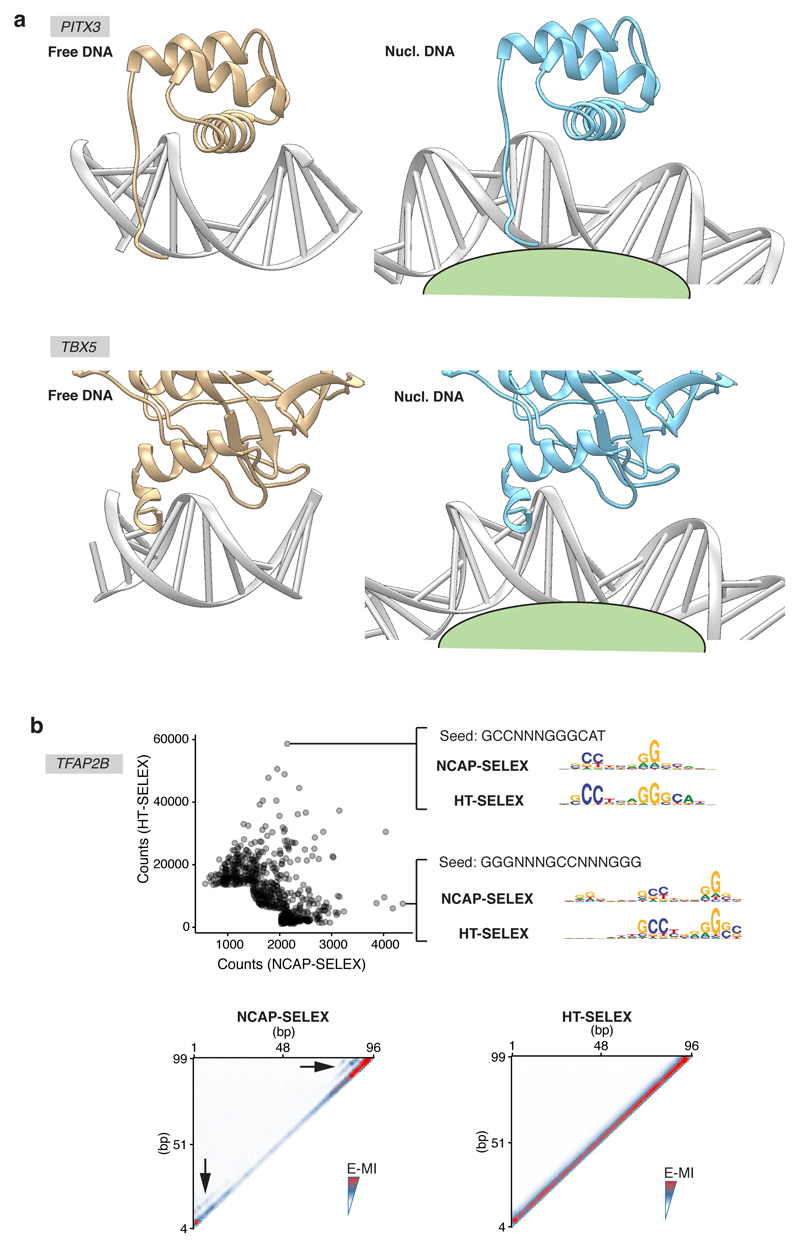
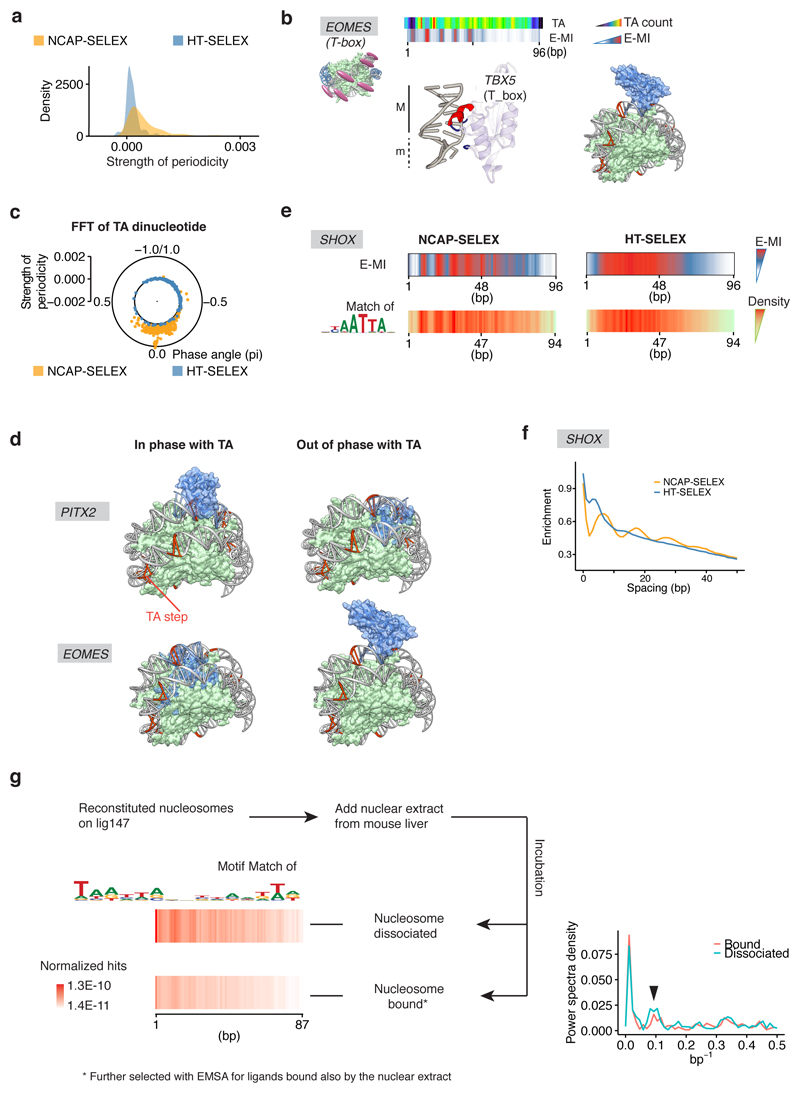
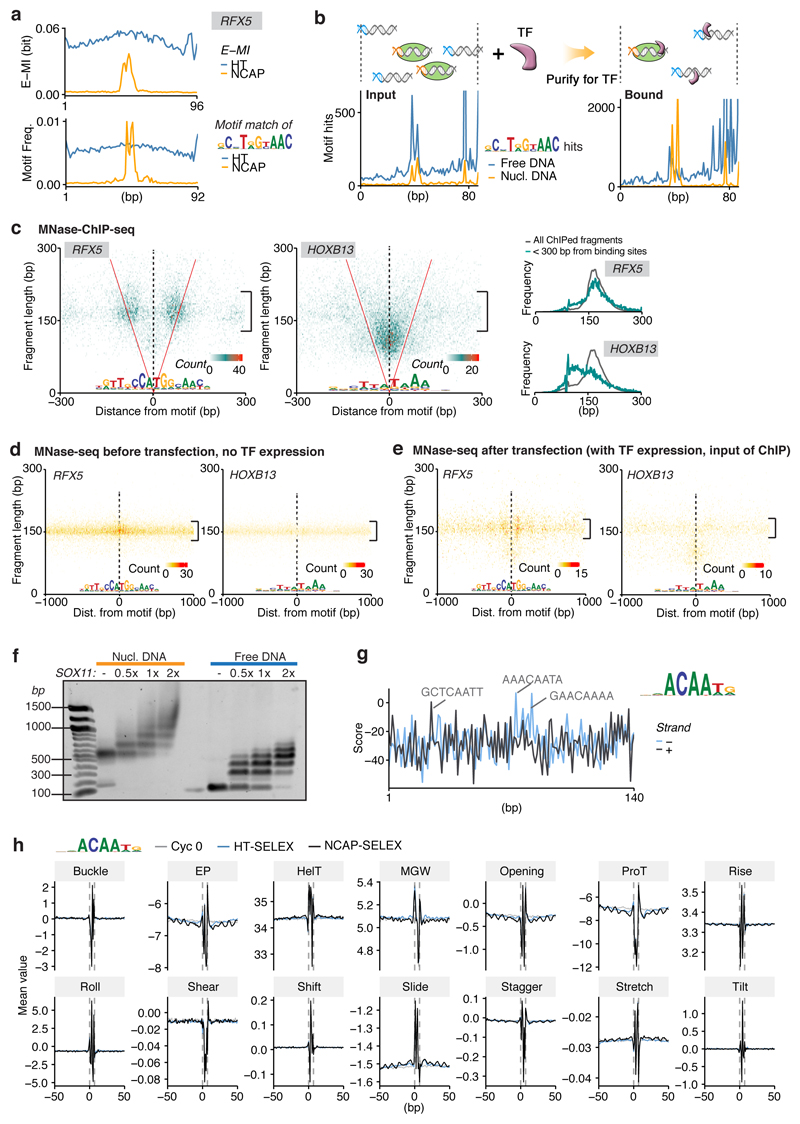
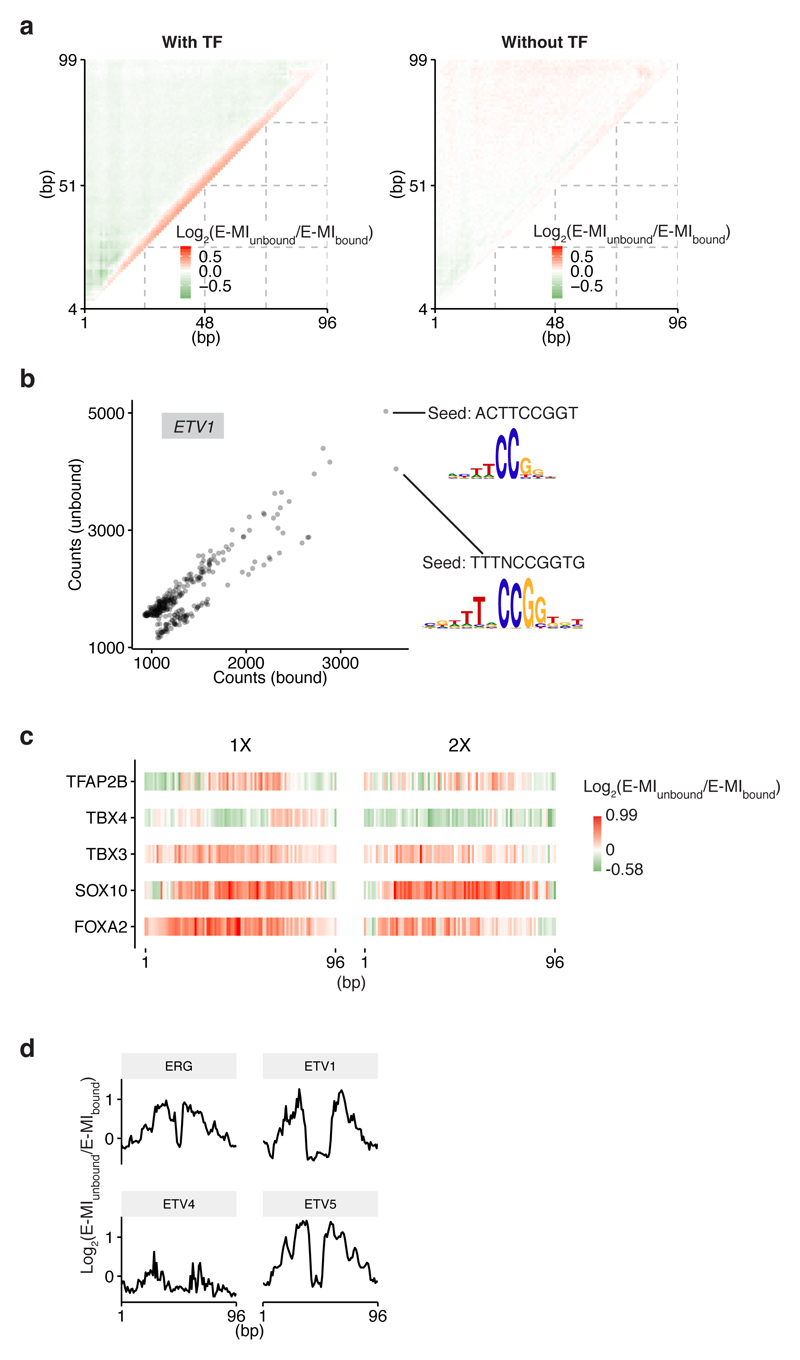
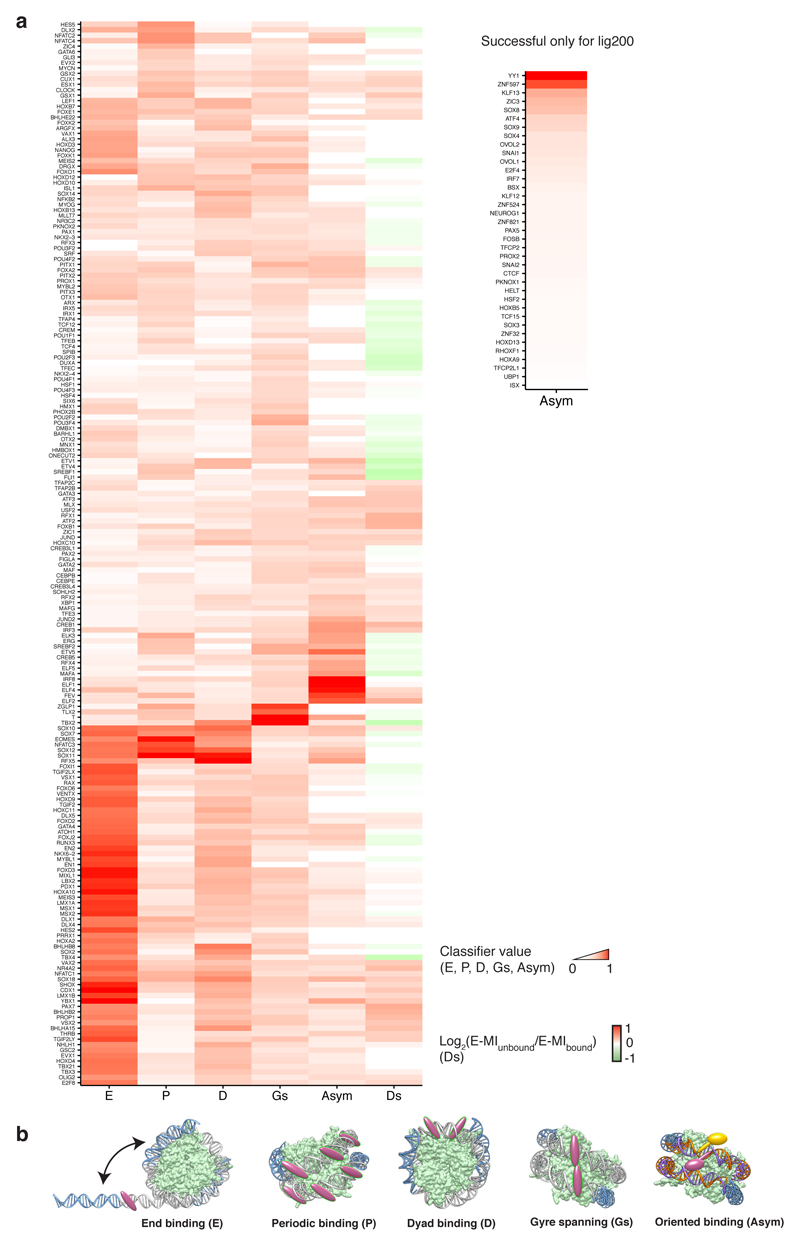
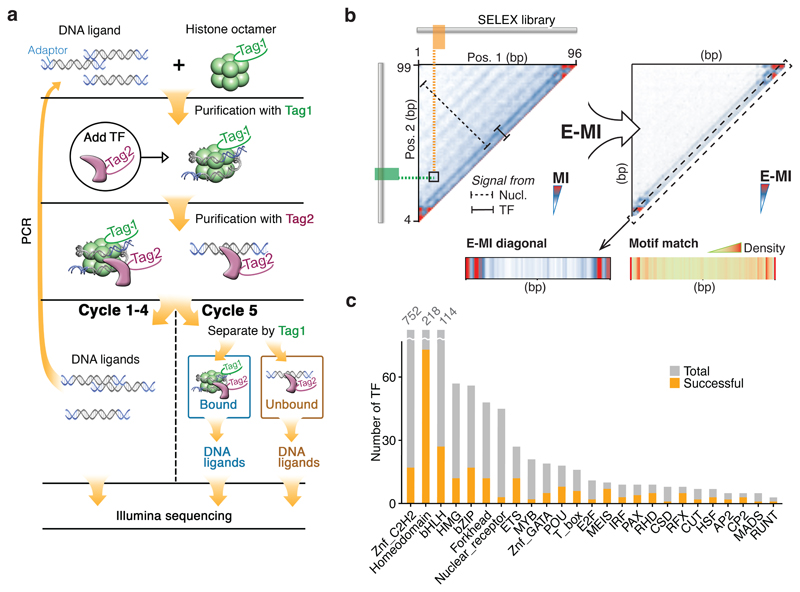
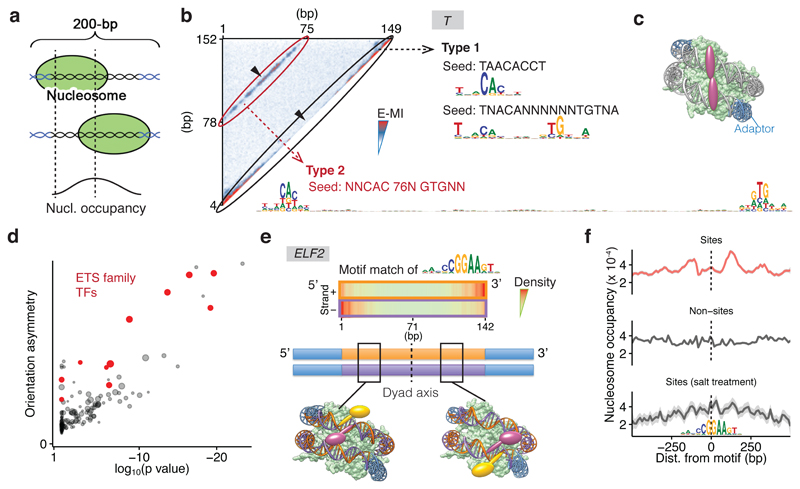
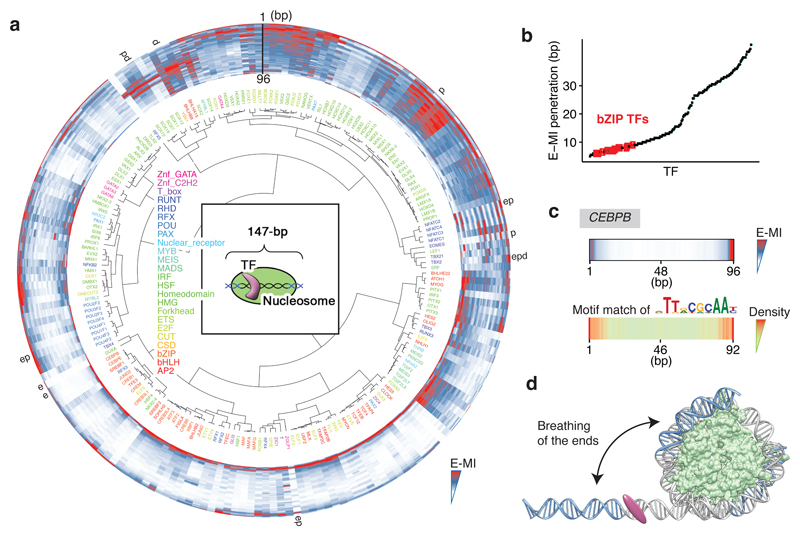
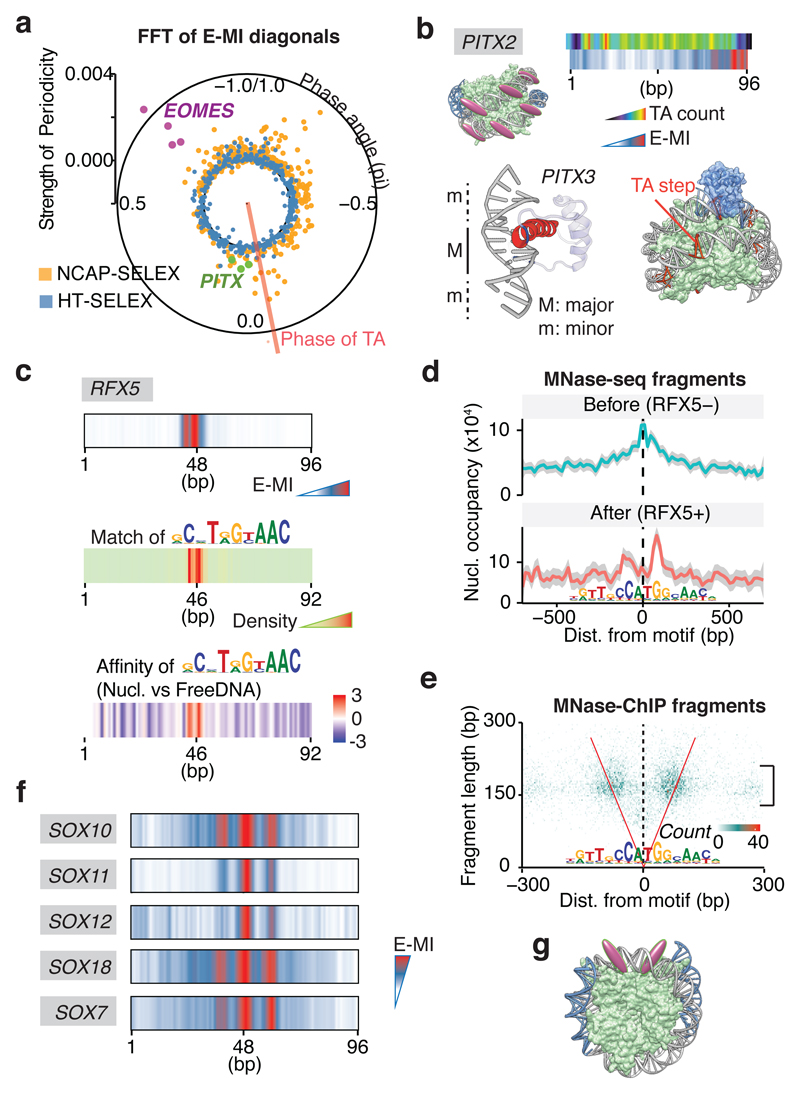
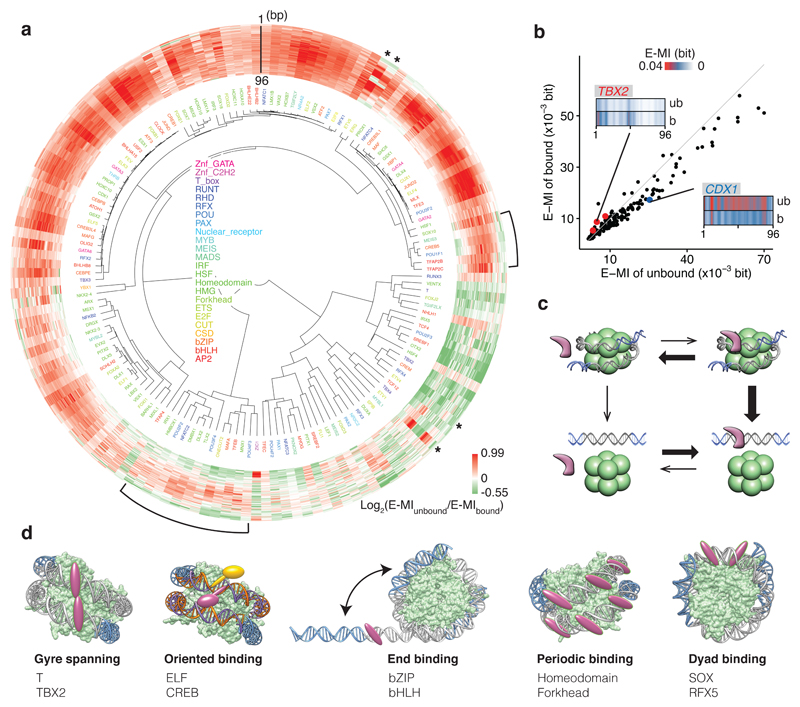
Nucleosomes cover most of the genome and are thought to be displaced by transcription factors in regions that direct gene expression. However, the modes of interaction between transcription factors and nucleosomal DNA remain largely unknown. Here we systematically explore interactions between the nucleosome and 220 transcription factors representing diverse structural families. Consistent with earlier observations, we find that the majority of the studied transcription factors have less access to nucleosomal DNA than to free DNA. The motifs recovered from transcription factors bound to nucleosomal and free DNA are generally similar. However, steric hindrance and scaffolding by the nucleosome result in specific positioning and orientation of the motifs. Many transcription factors preferentially bind close to the end of nucleosomal DNA, or to periodic positions on the solvent-exposed side of the DNA. In addition, several transcription factors usually bind to nucleosomal DNA in a particular orientation. Some transcription factors specifically interact with DNA located at the dyad position at which only one DNA gyre is wound, whereas other transcription factors prefer sites spanning two DNA gyres and bind specifically to each of them. Our work reveals notable differences in the binding of transcription factors to free and nucleosomal DNA, and uncovers a diverse interaction landscape between transcription factors and the nucleosome.


Conflict of interest statement

The authors declare no competing financial interests.

Figures

Extended Data Figure 1
Extended Data Figure 1. Experiment design and data analysis strategy of NCAP-SELEX.
a, Expression of the recombinant histones from X. laevis. For each lane 3 µg histone is loaded. Similar purifications for untagged H2A, H2B, H3, and H4 have been repeated for at least three times. The SBP-H2A purification was performed once. b, Size-exclusion chromatogram of the histone octamer. Such octamer formation has been performed twice and the results were highly consistent. c, EMSA result showing the reconstituted nucleosomes using lig147 and lig200. The original ligands are also loaded as reference. The asterisks indicate the nucleosome bands. Similar results are seen in four independent nucleosome reconstitutions. For gel source data see Supplementary Figure 1. d, Oligonucleotide periodicity in the library enriched by nucleosome. As a quality control of nucleosome reconstitution, we verified whether nucleosome by itself is enriching the previously reported ~10-bp periodic oligonucleotide signal,. Nucleosome SELEX (without TF) were carried out for four cycles to enrich nucleosome-favoring ligands. The counts of each single and di-nucleotide across each individual ligand were Fourier transformed and summed up for the whole library. A clear peak around 0.1 bp-1 (corresponding to the reported ~10-bp periodicity) is visible for most mono and dinucleotides. e, The C/G/CG preferences of nucleosome. All 9-mers were counted for the nucleosome-favored (bound) and the nucleosome-disfavored (unbound) libraries. The point representing each 9-mer is colored according to its C/G/CG content (top), and the count ratios between the bound and the unbound libraries are summarized for 9-mers of different C/G/CG contents (bottom). For the box plots grouped by C/G content, the sample sizes of the boxes are 19683, 59049, 78732, 61236, 30618, 10206, 2268, 324, 27, and 1, respectively for 9-mer groups containing 0 to 9 C/G. For the box plots grouped by CG dinucleotide content, the sample sizes of the boxes are 151316, 91824, 17784, 1200, and 20, respectively for 9-mer groups containing 0 to 4 CG. The line within each box represents the median; the lower and upper boundaries of the box indicate the first and third quartiles. The whiskers represent the 1.5-fold interquartile range. More extreme values are indicated with dots. f, Analysis pipeline for the ligands enriched in NCAP-SELEX. g, E-MI strength comparison for libraries with and without TF signals. The E-MI heatmaps represent signals in the input (cycle 0) library, in the cycle 4 library of nucleosome-favored sequences (Nucl. SELEX), and in the NCAP- and HT-SELEX cycle 4 libraries. The libraries enriched with TF (NCAP and HT) have much stronger E-MI signals compared to the cycle 0 and the nucleosome-SELEX library. The detected dimer signals of HSF1 in HT-SELEX is boxed. h, Family-wise coverage of TFs tried in NCAP-SELEX.
Extended Data Figure 2
Extended Data Figure 2. NCAP-SELEX with lig200.
a, Hierarchical clustering of the E-MI diagonals for NCAP-SELEX with the 200-bp ligand (lig200). The E-MI diagonal for each TF is oriented radially. The randomized region is 154 bp and contains 149 windows for MI calculation between neighboring 3 mers. The names of the TFs are colored by family with the coloring scheme indicated on the center. TFs from the same family tend to be clustered together (e.g., SOX, indicated). Because of the gradient of nucleosome occupancy, the penetration of the E-MI signal into the center of the E-MI diagonals (E-MI penetration; see Methods for details) reflects the ability of each TF to bind to nucleosomal DNA. Note that almost all TFs have lower E-MI towards the center of lig200, indicating their lower affinity to nucleosomal DNA than to free DNA. Such decrease of E-MI towards the center is rarely observed in the absence of the nucleosome. Note that the binding inhibition of TF to nucleosomal DNA occurs in the absence of higher order effects, such as chromatin compaction, remodeling or histone modification. This results directly verifies the mutually antagonistic role of TFs and the nucleosome,,, which was biochemically validated only for a few cases before,. The E-MI diagonals shown are scaled for each TF (see Methods). Due to the fixed adaptor sequences, TFs may prefer one end of the lig200 over the other end. b, E-MI penetration of individual TFs on lig200. TFs are ordered according to their E-MI penetration depth towards the center of the ligand. This order reflects TFs’ ability to bind nucleosome-occupied DNA. Note that the penetration of E-MI into the ligand center (E-MI penetration; see Methods for details) varies strongly between the TFs. TFs representing either of the two ends are colored red and exemplified in (c). c, The diagonal of E-MI for TFs with high (top) and low (bottom) E-MI penetrations. Because HT (blue) and NCAP-SELEX (black) may differ in stringency, each E-MI diagonal is normalized by dividing its maximum value. On lig200 the central 94 bp (shaded grey) is always occupied by a nucleosome. d, Correlation between E-MI penetration and TF’s capability to bind nucleosomal DNA in vivo. Per base-pair coverage of MNase fragments (>140 bp) at ChIP-seq peaks of the TFs (x axis) is plotted against their E-MI penetration (y axis) in NCAP-SELEX. The calculation of Pearson’s r and the correlation test is performed for n=20 TFs. The observed correlation suggests that TFs’ ability to bind nucleosomal DNA in NCAP-SELEX (E-MI penetration) partially explains the nucleosome occupancy at TFs’ sites in K562 cells. Thus the biochemical ability of TFs to bind to nucleosomal DNA also affects their binding in vivo. e, (Left) E-MI heatmap of T (brachyury) in HT-SELEX using lig200. Pairwise E-MI for all 3-mer pairs is presented as a heatmap. The signal is only visible near the diagonal, no E-MI signal across ~80 bp is detected. (Right) The gyre-spanning mode (arrow) of T (brachyury) on lig147. The corresponding motif is derived with the indicated seed for a specific position (number in the parentheses) in the high E-MI region (arrow). PWM generation follows our previous method using multinomial 1. f, Type 2 binding of Brachyury (T) stabilizes nucleosome from dissociation. Log2 ratio of E-MI between the bound and unbound libraries (cycle five) is calculated for both the Type 2 binding and for the background E-MI level (see Methods for details) of Brachyury (T). Compared to the unbound, the bound library has stronger Type 2 binding but a similar background. As a control, for 20 random TFs (Rnd), the log2 ratio of E-MI between the bound and unbound libraries is also calculated for both the Type 2 binding (hypothetic) and for the background E-MI level. For these TFs the bound libraries have similar E-MI strength as the unbound in the region corresponding to the Type 2 binding of Brachyury (T). Data are mean ± s.d.; two-sided t-test was used, 95% CI, 0.097–0.202 (T) and -0.008–0.004 (random TFs). The sample sizes are n=20 libraries for random TFs and n=4 independent SELEX replicates for Brachyury (T). The raw data for the random control TFs are listed in Supplementary Data 3. g, E-MI heatmap of TBX2, ETV4, and ETV1 in NCAP-SELEX using lig147. The E-MI signals across ~80 (type 2) or ~40 bp (type 1) are indicated with arrows. The corresponding motif of each binding type is derived with the indicated seed for a specific position (number in the parentheses) in the high E-MI regions (arrows). Note that the E-MI signals across ~40 bp are position-specific, with one binding event being observed near the dyad, and the other(s) on the opposite side of the nucleosome, with the two contacts separated by ~180°. This binding mode can be achieved by TF dimers that contact nucleosomal DNA in a pincer-like manner. However, as the individual TFs are located far from each other in this binding mode, it more likely suggests that the nucleosome may have two allosteric states, or may form a higher order complex with these TFs.
Extended Data Figure 3
Extended Data Figure 3. Control experiments with lig200.
a, Determination of nucleosome positions for NCAP-SELEX libraries (lig200, all TFs). To examine if nucleosome has preferred positioning on lig200, nucleosomes were loaded onto the amplified cycle 4 NCAP-SELEX library of each TF. After digestion with MNase, the remaining DNA fragments were collected and sequenced. A titration was first carried out to find the appropriate concentration of MNase. As shown in the gel image (left, see Supplementary Figure 1 for source data), 4.8, 2.4, 1.2, 0.6, 0.3, 0.15 units of MNase (lane 1–6) were added into each 25 µl reaction containing the purified nucleosome. According to the results, the asterisk-marked condition was chosen for the reactions to determine nucleosome position. After sequencing, the fractions of MNase fragments that mapped to the variable region (grey) and to the adaptor-overlapping region (blue) of lig200 are visualized (middle, each row corresponds to a TF). To identify potential positional preference of nucleosome on lig200, the adaptor-overlapping fragments are analyzed for their end distributions. Distributions of both the left end (cyan) and the right end (red) of the MNase-digested fragments on lig200 are shown (right, each row correspond to a TF). Such distributions likely indicate that nucleosomes have two relatively preferred positions on lig200 (illustrated by cartoon in green). Note that most nucleosomes are not positioned by the adaptor (middle) thus are randomly distributed. b, E-MI diagonals for HT-SELEX with the 200-bp ligand (lig200). TFs are arranged according to the clustering for NCAP-SELEX libraries (Extended Data Fig. 2a) to facilitate comparison. TFs without a lig200 HT-SELEX control are left as blank. The E-MI diagonal for each TF is oriented radially and the names of the TFs are colored by family as indicated. The E-MI diagonals are scaled for each TF. Some TFs show preferred positions on lig200, likely due to the fixed adaptors. c, TFs prefer free DNA to the edge of a nucleosome. For a few randomly chosen TFs, NCAP-SELEX was run using a ligand (Lig70Nlinker, sequence in Supplementary Table 2) that positions nucleosome at its center by embedding a segment of Widom 601 sequence, and with randomized flankings. At a low resolution, TFs’ E-MI signal decreases monotonically towards the nucleosome-occupied region. Thus the higher E-MI at the flankings of lig200 (Extended Data Fig. 2a) suggests TFs’ preference for free DNA, rather than for the edge of a nucleosome. E-MI diagonals are scaled for each TF. d, E-MI diagonals for TFs at doubled concentrations. The concentration effect on TFs’ E-MI diagonal is explored by running NCAP-SELEX at doubled (2×) concentrations for a few randomly chosen TFs. Compared to the E-MI diagonal with the original TF concentrations (1×), the change on E-MI pattern is minor.
Extended Data Figure 4
Extended Data Figure 4. Nucleosome breaks the rotational symmetry of DNA.
a, Density plot representing the orientational asymmetry of all TFs in NCAP-SELEX and in HT-SELEX. In NCAP-SELEX, more TFs bind with high orientational asymmetry than in HT-SELEX. A few TFs can prefer different ends of the ligand for the two binding directions in HT-SELEX; this is likely induced by the adaptor sequences. However, there are more TFs with higher orientational asymmetry in NCAP-SELEX libraries, despite the fact that for most TFs their signals are stronger in HT-SELEX libraries. b, Orientation asymmetry of ELF2 revealed by using top 8-mers. Each row of the heatmap corresponds to the counts distribution of a top 8-mer (non-palindromic) across the positions of the SELEX ligand. Hits of the top 8-mers occur at different ends for different strands of nucleosomal DNA (i.e. an 8-mer and its reverse-complement prefer different ends), whereas their distribution is relatively homogeneous for free DNA. c, Orientation asymmetry of CREB TFs. CREB TFs have different motif density distributions for the two strands of nucleosomal DNA. The motif used for matching is indicated above. The “–” strand profile is from the density of the reverse-complement motif. d, Break of the 2-fold rotational symmetry of DNA induces preferred orientation of TFs. Left: free DNA has a 2-fold axis (red ellipse) perpendicular to the helix axis. Motifs in two orientations are symmetric with each other with respect to a 180° rotation centered on the axis. Right: for motifs on nucleosomal DNA, if the other strand of DNA or the histone proteins (green) affects binding, the 2-fold axis of DNA no longer exists, as a 180° rotation centered on the axis no longer generates an identical conformation (the rotated image not superimposable with the original one). Such break of rotational symmetry occurs also on the linker DNA that immediately flanks the nucleosome (f). e, (Top panel) The orientational asymmetry of ELF2 in NCAP-SELEX of lig200. (Bottom panel) The asymmetric nucleosome distribution around genomic ELF1 sites (top). Such asymmetry is not observed for the same ELF1 sites after a 30 min 500 mM KCl treatment to mobilize the nucleosome (bottom). ELF1 motif matches are positioned at the center. Frequency of the center of MNase-fragments (140–170 bp) is visualized for nearby regions to represent the nucleosome occupancy. Each profile (n=999 data points) is LOESS smoothed with a span of 0.05 and plotted with the SE band. f, The orientational binding of ELF occurs on both the nucleosomal DNA and the nearby linker region. The motif matches of ELF on lig147 (top) suggest that the orientational binding occurs on nucleosomal DNA. In addition, the motif matches of ELF on the 293-bp ligand (bottom; nucleosome positioned at the center, ligand schematic in Extended Data Fig. 3c) indicates that the orientational binding also occurs on nearby linker DNA regions.
Extended Data Figure 5
Extended Data Figure 5. TFs can bind nucleosomal DNA without significant motif change.
a, Cartoons showing that TFs are theoretically able to contact grooves of the bent nucleosomal DNA from the solvent-exposed side. The left panel for each TF shows the structures (PITX3: 2LKX, TBX5: 2X6V). For the right panels of each TF, the PDB structure of the TF is aligned to the nucleosome structure (3UT9) as described in the Methods (section “FFT analysis and structure alignment”). The corresponding base-pairs of the nucleosomal DNA were replaced with coot according to the DNA sequence in each TF’s PDB structure. The models are visualized with UCSF Chimera. b, TFAP binds nucleosomal DNA with slightly different specificity than free DNA. The scatter plot (top panel) shows the counts of gapped 9-mers from SELEX libraries of TFAP2B, enriched with NCAP-SELEX (x axis) and HT-SELEX (y axis). The examined 9-mers consists of three segments of trimers interspaced with two gaps (0–5 bp). Only the most enriched 9-mers (top 300 in each library and in the combined library) are shown from clarity. For comparison, the most differentially enriched gapped 9-mers were also used as seeds to derive the corresponding motifs from both libraries (right). The heatmap (bottom panel) shows the pairwise E-MI for all combinations of positions on lig147, in the presence (left) and absence (right) of nucleosome. The arrowheads indicate the additional signals developed in the presence of nucleosome.
Extended Data Figure 6
Extended Data Figure 6. NCAP-SELEX with lig147.
a, E-MI diagonals for HT-SELEX with the 147-bp ligand (lig147). TFs are arranged according to the clustering for NCAP-SELEX libraries (Fig. 3a) to facilitate comparison. The E-MI diagonal for each TF is oriented radially and scaled. The names of the TFs are colored by family as indicated. b, The top five PCs (Principle Component) and the components from NMF (Non-negative Matrix Factorization) with rank equals 5. The E-MI diagonals of lig147 (n=195 TFs) were used in the dimension reduction. For visualization purpose, each component is centered and scaled. Note that the five PCs (left) correspond well to the three identified positional preferences of TFs on nucleosomal DNA (End: Dim 1, 2; Periodic: Dim 3, 4; Dyad: Dim 5). c, Comparison between the scores from PC classifiers and custom classifiers. Red points indicate the TFs defined as displaying respective preferences according to custom classifiers. The PC classifiers are well in accord with custom classifiers for the End and the Dyad preferences (left), but not for the Periodic preference (right). Because the phase of periodic preference can vary continuously whereas PCs can only capture discrete values, the custom FFT-based classifier is more natural for such purpose. The libraries of n=195 TFs were used in the analyses. The correlation coefficients (Pearson’s r) are also indicated. d, E-MI diagonal and motif matching results for the bZIP factor CEBPB. In HT-SELEX (without nucleosome), the binding signal is more distributed across the ligand. e, Pearson’s correlation between TFs’ E-MI penetrations on lig200 and on lig147. The libraries of n=155 TFs, which are successful with both lig200 and lig147, were used in this analysis. TFs’ end preference on lig200 reveals that they prefer free DNA to nucleosomal DNA. Such free-DNA preference likely also explains TFs’ end preference on lig147 due to the observed correlation of E-MI penetrations. For each TF, the E-MI penetration values differ between lig147 and lig200 because free-DNA regions are expected near the ends of lig200, but not present on lig147. f, Correspondence between TF’s E-MI patterns on lig147 and on 1ig200. The E-MI diagonals of RFX5 and SHOX on lig200 and those on lig147 are plotted together for comparison. The peaks on lig200 that illustrates the central preference of RFX5 and periodic preference of SHOX are indicated with red arrowheads. The weaker preference patterns on lig200 are due to the delocalization of the nucleosome on lig200, however still visible because the two fixed adaptors dictate two weakly preferred nucleosome positions.
Extended Data Figure 7
Extended Data Figure 7. TFs with periodic preferences.
a, Density plot showing the periodicity strength of all TFs in NCAP-SELEX (orange) and HT-SELEX (blue). Note that the overall periodicity of E-MI is stronger for the NCAP-SELEX library compared to the free-DNA HT-SELEX library. b, Minor groove binder prefers exposed minor grooves (m) on nucleosomal DNA. The E-MI diagonal of EOMES (T-box) is out of phase with the TA peaks, suggesting it binds positions where nucleosomal DNA’s minor groove is facing outside (TA peaks indicate nucleosome-DNA contacts, whereas E-MI visualizes TF-DNA contacts, see Methods for details). Accordingly, the TBX5 (T-box) structure (PDB entry 2X6V) shows contacts with DNA principally in the minor groove. Cartoon representation to the right shows that the steric hindrance is minimal when TBX5 (blue) binds out of phase with TA (orange) on the nucleosome structure (PDB entry 3UT9). c, Strength and phase of the ~10 bp periodicity of TA dinucleotide in NCAP-SELEX and HT-SELEX libraries. For the library (lig147) enriched by a specific TF, the strength and phase information is derived from FFT of the TA counts at each position of the library. In the polar plot, each dot represents one TF’s library. The overall periodicity is stronger in the NCAP-SELEX libraries (yellow) than in the HT-SELEX libraries (blue), suggesting an enrichment of nucleosome signal. The TA phases in all TFs’ NCAP-SELEX libraries are similar, thus the rotational positioning of nucleosome on the SELEX ligand is similar for all TF’s libraries. In contrast, the phase of the E-MI periodicity is much more dispersed (Fig. 4a), suggesting the preference of TFs towards different grooves of DNA. d, Cartoon representations of the 3D structures of PITX3 (PDB entry 2LKX) and TBX5 (T_box, PDB entry 2X6V) in complexes with nucleosomal DNA. PITX3 and TBX5 structures were shown to illustrate the groove preferences of PITX2 and EOMES (T-box). The DNA ligand in the nucleosome structure (PDB entry 3UT9) contains phased TA steps (orange). Consistent with the SELEX result, PITX is more compatible with nucleosomal DNA when it binds in phase with TA, whereas T-box is more compatible when it binds out of phase with TA. Therefore, when TF binds nucleosomal DNA according to the identified patterns, the steric conflict between TF and the histones is minimized. e, E-MI diagonal and motif matching results for SHOX in NCAP-SELEX and HT-SELEX. The E-MI diagonal agrees with the motif matching result. f, The ~10 bp periodicity for the preferred spacing of SHOX dimers on nucleosomal DNA. In NCAP-SELEX libraries of many periodic binders (SHOX as an example), enrichment of the most abundant 3-mer tandem repeats oscillates as a function of the spacing between the repeats. The enrichment is evaluated by log2-ratio between the observed and expected occurrences. The observed ~10 bp periodicity with dimer spacing originates from the periodic availability of nucleosomal DNA. However, in most cases such binding appears not to be cooperative, based on the fact that the observed frequency of ligands with two motifs can be well estimated by the frequency of ligands that contain only one motif (data not shown). g, Homeodomain TFs from mouse liver prefer periodic positions on nucleosomal DNA. Motif hits of homeodomain TFs show a periodic pattern for both the nucleosome-bound and nucleosome-dissociated (unbound) libraries after incubation with mouse liver nuclear extract; however, the unbound library has more motif hits, indicating that binding events to the presented motif facilitates the dissociation of nucleosome. To more clearly visualized the ~10 bp periodicity, the Fourier-Transformed spectra for both libraries are also shown to the right. The arrowhead indicates the peaks for the ~10 bp periodicity.
Extended Data Figure 8
Extended Data Figure 8. TFs with the dyad preference.
a, E-MI diagonal and motif matching results for RFX5. The distribution of binding events is more spread in the absence of nucleosome (HT-SELEX). b, The design of the competition assay and the raw counts of RFX5 motif matches. Differently barcoded nucleosomal DNA (orange) and free DNA (blue) were mixed as input, and incubated with the TF protein. Purification for the TF-bound species was then performed. Matches of the indicated RFX5 motif was counted for both the nucleosomal DNA (orange) and the free DNA (blue), and for both of the input and the bound libraries. On nucleosomal DNA, more motif hits near the center of the ligand are observed after purification. c, MNase-ChIP fragments near the binding sites of RFX5 and HOXB13. Motif matches within MNase-ChIP peaks of each TF are positioned at the center. Counts of MNase-ChIP fragments are binned to 3 bp by 3 bp bins according to their lengths and center positions. Nucleosome distribution is reflected by the signal intensity of the ~150 bp fragments (bracket). This visualization resembles the reported “V-plot”. Length distribution of all ChIPed fragments and that of fragments < 300 bp from the TF sites are shown on the right. Note that HOXB13 enriches ~120 bp ChIP fragments at its sites (middle), suggesting that similarly to most TFs,, its binding sites in the genome are depleted of nucleosomes. In contrast, RFX5 enriches nucleosome-sized fragments (left). Most of the enriched fragments also have their center positioned between the red “V” lines, and thus overlap with the TF motifs. d, Nucleosome distribution near the binding sites of RFX5 and HOXB13 before transfection (no TF expression). MNase-seq fragments around the identified TF sites are visualized as in (c). The sites later bound by exogenous RFX5 are located at the maximum of nucleosome occupancy (left). e, Nucleosome distribution near the binding sites of RFX5 and HOXB13 after transfection (with TF expression). The nucleosomes are now positioned aside the exogenous RFX5 sites (left). f, EMSA of SOX11 complexes with nucleosome and with free DNA. Nucleosome is reconstituted and purified using a modified Widom 601 sequence, which contains a SOX11 binding sequence (extracted from cycle 4 SELEX library) embedded close to the dyad. Each 40 µl reaction contains 1 µg DNA, together with SOX11 protein at a molar ratio of 0, 0.5, 1, 2 (indicated on top of each lane) to DNA. Here the observed multiple shifts likely reveal the binding of SOX11 to additional weaker sites on the ligand (g). For gel source data, see Supplementary Figure 1. g, The score of SOX11 motif across the EMSA ligand (see Methods for ligand sequence). The top 3 binding sites are indicated. h, DNA shape features around SOX11 motifs. DNA shape features were calculated using DNAshapeR,, for NCAP-SELEX (black), HT-SELEX (blue), and cycle 0 (input, grey) libraries. The black line is plotted last thus may hide other lines when all values are similar. Boundary of the motif is indicated with dashed vertical lines. Only the ligands with motifs around the center (position range: 36-58) are included in the analysis.
Extended Data Figure 9
Extended Data Figure 9. TF binding affects the stability of nucleosome.
a, E-MI difference between the bound and the unbound cycle 5 libraries. The bound and the unbound libraries were collected either in the presence (left) or in the absence (right) of TFs. The heatmaps visualize E-MI differences between the bound and unbound libraries for all position combinations of 3-mer pairs, and each pixel on the heatmap is a mean of all the examined TFs’ E-MI difference at this pixel. For individual TFs, value at each pixel is calculated as log2(E-MIunbound/E-MIbound). Testing nucleosome dissociation in the absence of TF was aimed to verify whether the TF motifs on lig147 by themselves can affect the nucleosome’s stability. Note that in general, binding events close to the center of nucleosomal DNA more efficiently dissociated the nucleosome (left). This observation is in accordance with the mutually exclusive nature between TFs and the nucleosome. While TFs generally have lower affinity to the center of the lig147, it is also conceivable that TF binding close to the center will more efficiently undermine the DNA-histone interactions, and in turn lead to a higher rate of nucleosome dissociation. TFs bound close to the ends could have decreased the flexibility of the DNA there and subsequently disfavor the dissociation of DNA ends from the histones, which in turn contributes to nucleosome stability. b, The efficiency of nucleosome dissociation induced by ETV1 is dependent on its binding specificity. To displace nucleosome, binding with the shorter motif is more efficient than binding with the longer motif, because the shorter motif is more enriched in the dissociated library (unbound). c, Differential E-MI diagonals for TFs at doubled concentrations. TF’s ability to dissociate or stabilize nucleosome is revealed by the log ratio of E-MI between the unbound and the bound cycle 5 libraries (differential E-MI). The concentration effect on TFs’ differential E-MI diagonal is explored by running NCAP-SELEX followed by the dissociation assay at doubled (2×) concentrations of the TFs. The differential E-MI diagonals at 2× TF concentrations resemble those at the original (1×) TF concentrations. d, Differential E-MI diagonals for the four ETS family TFs indicated by asterisks in Fig. 5a.
Extended Data Figure 10
Extended Data Figure 10. Modes of TF-nucleosome interaction.
For each TF, the strengths of all identified TF-nucleosome interaction modes, together with its ability to dissociate nucleosome, are shown in the heat map (a). The displayed features include TF’s positional preferences (E: end, P: periodic, D: dyad) on nucleosomal DNA, gyre-spanning binding mode (Gs), orientational asymmetry (Asym), and TF’s ability to dissociate nucleosome (Ds). TFs succeeded only in NCAP-SELEX with lig200 are presented to the right for their orientational asymmetry. In the heatmap values are scaled into 0 to 1 for each mode, except for the dissociation, where TFs that stabilize nucleosome are given negative values (green). The raw data are provided in Supplementary Table 5. (b) All the identified modes can be explained by the structural features of nucleosome. TFs with the end preference (E) bind nucleosomal DNA close to the entry and exit positions. This preference is in line with the probability of spontaneous dissociation (breathing) of nucleosomal DNA, which decreases from the end to the center–. TFs with a strong end preference are likely less compatible with nucleosomal DNA thus only bind to the dissociated regions. These TFs could be structurally hindered by nucleosome, because one side of the nucleosomal DNA is masked by the histones. Moreover, nucleosomal DNA is bent sharply, which could impair TF-DNA contacts if TFs have evolved to specifically bind to free DNA. TFs with the periodic preference (P) binds every ~10.2 bp positions on nucleosomal DNA. This preference arises also because nucleosomal DNA is accessible only from one side, which leads to significant accessibility change along each pitch (~10.2 bp) of the DNA helix. TFs that bind to short motifs, or to discontinuous motifs, are still able to occupy the available periodic positions on nucleosomal DNA. TFs with the dyad preference (D) tend to bind close to the nucleosomal dyad. Structurally, the dyad is distinct from other regions of the nucleosomal DNA. The dyad contains only a single DNA gyre, and features the thinnest histone disk,. These characteristics of the dyad DNA reduce the steric barrier for TF binding. The relatively weak DNA-histone interaction around the dyad could allow TFs that bend DNA upon binding (e.g., SOXs57) to deform DNA more easily at the dyad compared to other positions. In addition, the entry and exit of nucleosomal DNA are also close to the dyad; together with the dyad DNA, they provide a scaffold for specific configurations of TFs. FOXA has been suggested to make use of this scaffold to achieve highly specific positioning close to the dyad,. However, the dyad positioning of FOXA is not observed in this study using eDBD, potentially because the full length of FOXA is required for its interaction with the nucleosome. A few T-box TFs were found to bind nucleosomal DNA with the gyre-spanning binding mode (Gs). Such mode is observed because DNA grooves align across the two nucleosomal DNA gyres. The parallel gyres could specifically associate with TF dimers, or TFs having long recognition helices or multiple DNA binding domains. The dual-gyre binding is possible only on nucleosomal DNA, and it thus stabilizes the nucleosome from dissociation, and may therefore function to lock a nucleosome in place at a specific position. Many TFs such as ETS and CREB show an orientational asymmetry (Asym) upon binding to the nucleosomal DNA. The nucleosomal environment has induced such preference by breaking the local rotational symmetry of DNA. In accord with the mutually exclusive nature between TF and nucleosome binding, most TFs were found to dissociate nucleosomes (Ds). While nucleosome weakens the affinity of incompatible TFs, binding of such TFs are expected to weaken the nucleosome-DNA contacts as well. The ability of TFs to dissociate nucleosome is required for them to open chromatin and to activate transcription. Moreover, we also observed TFs that both stabilize and destabilize nucleosomal DNA, depending on their relative position of binding. Such ability could be used to more precisely position local nucleosomes. All the identified TF-nucleosome interactions suggest that the TF-nucleosome interaction could be more complicated than the previously suggested pioneer/non-pioneer classification of TFs. We observed that for eDBD of almost all TFs, including known pioneer factors such as FOX and SOX, free DNA was nonetheless preferred than nucleosomal DNA. However, some pioneer factors can bind relatively better to the interior of the nucleosome (e.g. FOX and SOX). In addition, some other TFs prefer nucleosomal DNA at restricted positions, or with one of their multiple binding motifs. These strategies are likely related to pioneer factor’s access to nucleosomal DNA.
Figure 1
Figure 1. Nucleosome CAP-SELEX.
a, Schematic representation of NCAP-SELEX. The DNA ligands for SELEX contain a randomized region (grey) with fixed adaptors (blue). The protocol first selects ligands that are favored by the nucleosome, and then from the nucleosome-bound ligand pool selects ligands that bind to a given TF. The orthogonal tagging of histone H2A (tag1) and TFs (tag2) enables the consecutive affinity purification. In the last (5th) cycle, the TF-bound DNA ligands are further separated into nucleosome-bound and unbound libraries before sequencing. b, TF-signal analysis by E-MI. Both the TF (solid bar) and the nucleosome (dotted bar) binding signals can be captured by the mutual information (MI) between 3-mer distributions at two non-overlapping positions of the ligand (left). In our analysis, we further focus on MI of the most enriched 3-mer pairs (E-MI, right) to filter out the nucleosome signals. Most analyses in this manuscript use the E-MI diagonal (box, containing E-MI from directly adjacent non-overlapping 3-mer pairs) because it is most informative of TF binding and generally similar to motif-matching result (bottom). c, Family-wise coverage of successful TFs.
Figure 2
Figure 2. Nucleosome scaffolds DNA and breaks its rotational symmetry, enabling new TF binding modes.
a, Schematic representation of single nucleosomes assembled on different positions of lig200 (top, middle), resulting in higher nucleosome occupancy towards the center (bottom). b, Two different binding types of T (brachyury) on nucleosomal DNA. Heatmap shows E-MI for all combinations of positions on lig200. Type 1 signal near the diagonal yields short motifs similar to those on free DNA. The Type 2 signal corresponds to a ~80-bp-long motif. Note that in contrast to Type 1 signal, Type 2 signal is not inhibited by the high nucleosome occupancy at the center (arrowheads). c, Schematic representation of TFs that bind both gyres of nucleosomal DNA. d, Orientational asymmetry of binding of individual TFs on nucleosomal DNA. y-axis: binding energy difference between two relative orientations of the most enriched subsequences. x-axis: t-test p-value of the difference compared to binding on free DNA (see Methods). Note that most ETS-family TFs (red) show prominent asymmetry. Dot size represents the extent of signal enrichment in each TF’s NCAP-SELEX library. e, Orientational asymmetry of the ETS factor ELF2. At the 5’ end of the ligand, ELF2 motif (top) is enriched on the minus strand, because ELF2 prefers to bind DNA in one orientation relative to the nucleosome (yellow, left bottom cartoon). At the 3’ end of the ligand, ELF2 motif is enriched on the plus strand, as this leads to the same orientation of the ELF2 protein with respect to the nucleosome (yellow, right bottom). Note also that the two yellow ELF2 proteins make symmetric contacts, but to different strands of DNA (marked orange and purple; adapters are indicated in blue). Note that TF positions on the ligand are not fixed, for simplicity only few example positions are shown. f, Asymmetric nucleosome distribution around genomic ELF2 sites (top, sites positioned at center). Asymmetry is not observed for the same ELF2 sites after salt treatment to mobilize the nucleosome (bottom) or for ELF2 motifs without ChIP signal (middle). Nucleosome positions are shown as frequency of the center of MNase-fragments (140–170 bp). Each profile (n=999 data points) is LOESS smoothed with a span of 0.05 and plotted with the SE band.
Figure 3
Figure 3. Nucleosome induces positional preference to TF binding.
a, Hierarchical clustering of the E-MI diagonals for NCAP-SELEX with the 147-bp ligand (lig147). E-MI diagonal is scaled for each TF (see Methods). The names of the TFs are colored by family. TFs from the same family tend to be clustered together. A few TFs were annotated as examples to illustrate their end (e), periodic (p), and dyad (d) preferences (see Supplementary Table 5). Note the preferences are not mutually exclusive. Center: schematic illustration of the fixed position of nucleosome on lig147. b, E-MI penetration of each TF on lig147. All bZIP TFs are marked with red. c, E-MI diagonal and motif matching results for the bZIP factor CEBPB. d, Schematic representation showing a TF that prefers the ends of nucleosomal DNA due to breathing. Both ends of nucleosomal DNA will breathe but only one is illustrated here for clarity.
Figure 4
Figure 4. Periodic and position-specific binding of TFs to nucleosomal DNA.
a, TF binding on nucleosomal DNA commonly displays ~10 bp periodic pattern. The polar plot shows strength and phase derived from FFT of E-MI diagonals, for both NCAP-SELEX (orange) and HT-SELEX (blue; free DNA). Note that EOMES (magenta, four replicates) and PITX (green for PITX1, 2, 3) have opposite phases. Phase of TA dinucleotide (red line) indicates where histones contact nucleosomal DNA. b, PITX prefers exposed major grooves on nucleosomal DNA. The E-MI diagonal of PITX is in phase with the TA peaks along the ligand. Accordingly, the structure of PITX (PDB entry 2LKX) shows contacts with DNA principally in the major groove (M). The base-contacting helices (red) and loops (blue) are indicated. Cartoon representation to the right shows that the steric hindrance is minimal when PITX (blue) binds in phase with TA (orange) on the nucleosome structure (PDB entry 3UT9). c, RFX5 prefers to bind near the nucleosome dyad. E-MI diagonal (top), motif matching (middle), and competition assay (bottom) are shown. Positive values in the competition assay indicate preference towards nucleosomal-DNA. d, Binding of RFX5 affects local nucleosome profile in vivo. Nucleosome distribution is examined by MNase-seq before (top) and after (bottom) exogenous expression of RFX5 in HEK293 cells. RFX5 motif matches within MNase-ChIP peaks are centered. Nucleosome occupancy is shown as frequency of the center of MNase-fragments (140–170 bp). Each profile (n=1401 data points) is LOESS smoothed with a span of 0.05 and plotted with the SE band. Before RFX5 expression, the nucleosome occupancy is higher at the RFX5 sites than the surrounding region (top); the nucleosomes are shifted after the expression of RFX5 (bottom). e, MNase-ChIP indicates that RFX5 binds to nucleosomal DNA in vivo. Counts of MNase-ChIP fragments are binned to 3 bp by 3 bp bins according to their lengths and center positions. Note that most ChIPed fragments are ~150 bp in size (bracket) and overlap the RFX5 motif (are between the red “V” lines), indicating that RFX5 prefers to bind to nucleosomal DNA. f, E-MI diagonal of SOX family TFs showing preferred binding around the dyad. g, Schematic representation of TFs that prefer to bind around the dyad.
Figure 5
Figure 5. Effects of TF binding on nucleosome stability.
a, Hierarchical clustering of the differential E-MI diagonal between the nucleosome-bound and the unbound cycle 5 libraries. Most TFs have stronger signal in the unbound library, indicating that their binding destabilizes the nucleosome. Brackets denote TFs that both destabilize and stabilize the nucleosome in a position-dependent way. Asterisks denote the ETS factors with a specific pattern of positional dependence. b, Mean strengths of E-MI diagonals in the nucleosome-bound and unbound cycle 5 libraries. The scatterplot shows the mean E-MI for the diagonals of each TF (dots), and for both the bound library (y axis) and the unbound library (x axis). The grey line represents where y=x. Most TFs have stronger signals in the unbound library (e.g. CDX1, blue). A few TFs show the reverse (e.g. TBX2, red, 3 replicates). For CDX1 and TBX2 the E-MI diagonals of the bound (b) and the unbound (ub) libraries are also illustrated. c, TF binding facilitates nucleosome dissociation. Binding of most TFs (magenta) to nucleosomal DNA leads to formation of a relatively unstable ternary complex (top right), and facilitates dissociation of the nucleosomes because the TFs prefer free DNA over nucleosomal DNA (bottom right). An alternative mechanism where the nucleosome first dissociates (left bottom) is not consistent with the observed effect of nucleosome on positional binding preferences of TFs (see also Fig 3). d, The identified major TF-nucleosome interaction modes.

Comment in

  • Spotlight on nucleosomes.
    Clyde D. Clyde D. Nat Rev Genet. 2018 Dec;19(12):738-739. doi: 10.1038/s41576-018-0070-6. Nat Rev Genet. 2018. PMID: 30367164 No abstract available.

References

    1. Andrews AJ, Luger K. Nucleosome structure(s) and stability: variations on a theme. Annu Rev Biophys. 2011;40:99–117. - PubMed
    1. Segal E, Widom J. What controls nucleosome positions? Trends Genet. 2009;25:335–343. - PMC - PubMed
    1. Richmond TJ, Davey CA. The structure of DNA in the nucleosome core. Nature. 2003;423:145–150. - PubMed
    1. McGinty RK, Tan S. Nucleosome structure and function. Chem Rev. 2015;115:2255–2273. - PMC - PubMed
    1. Jin J, et al. Synergistic action of RNA polymerases in overcoming the nucleosomal barrier. Nat Struct Mol Biol. 2010;17:745–752. - PMC - PubMed

LinkOut - more resources