. 2018 Sep 24;9(1):3884.
doi: 10.1038/s41467-018-06430-8.

Natural variation at XND1 impacts root hydraulics and trade-off for stress responses in Arabidopsis

Affiliations

Natural variation at XND1 impacts root hydraulics and trade-off for stress responses in Arabidopsis

Ning Tang et al. Nat Commun. .

Abstract

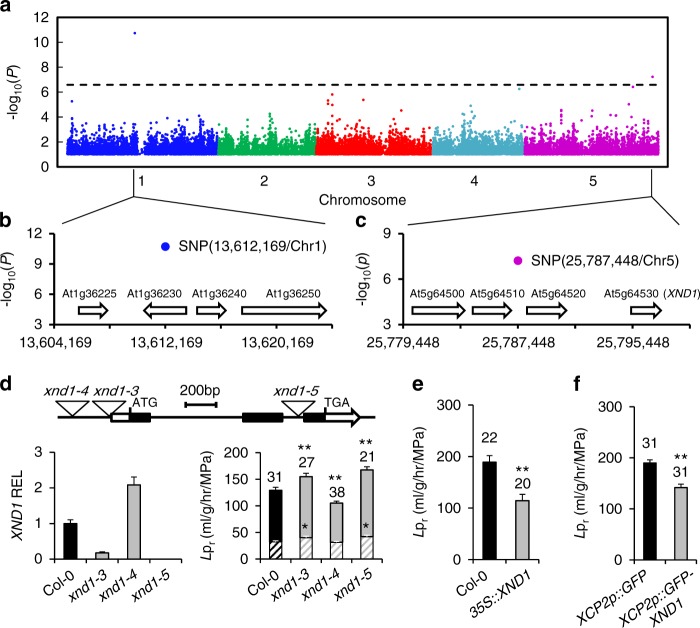
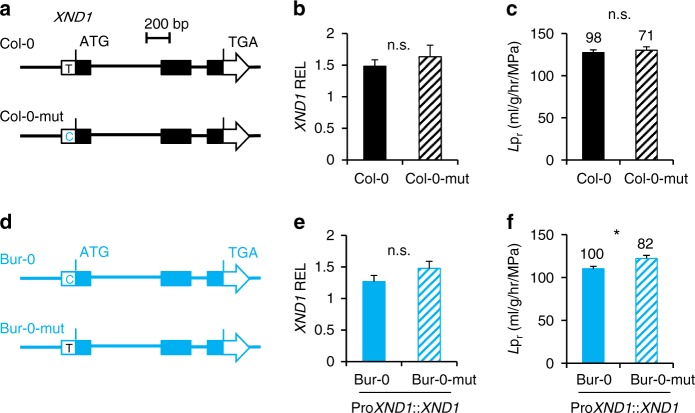
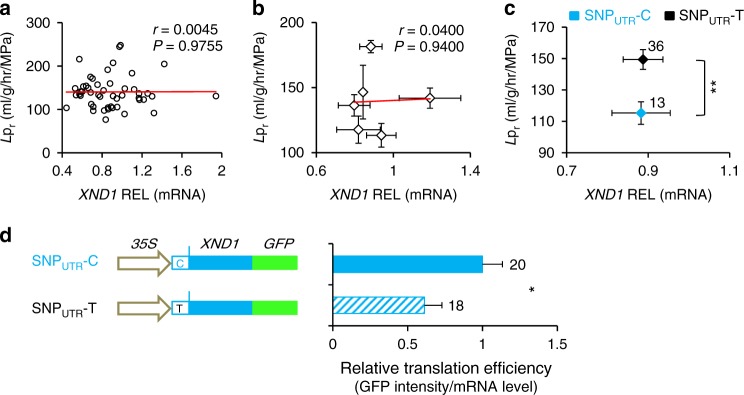
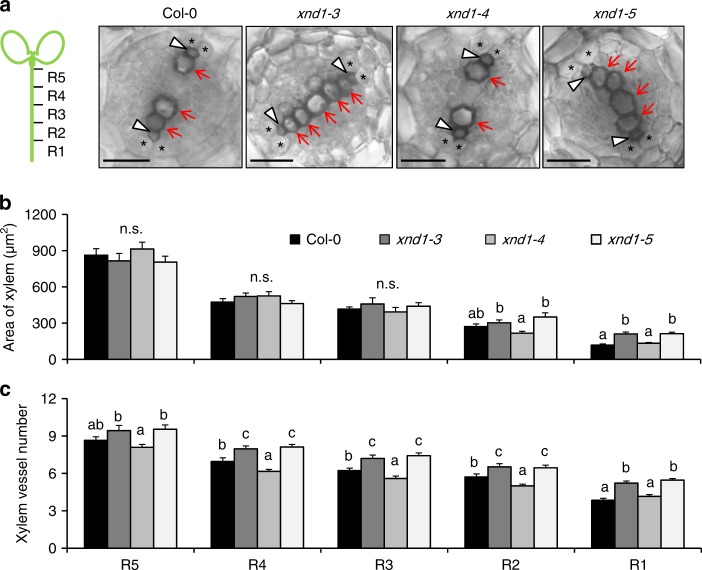
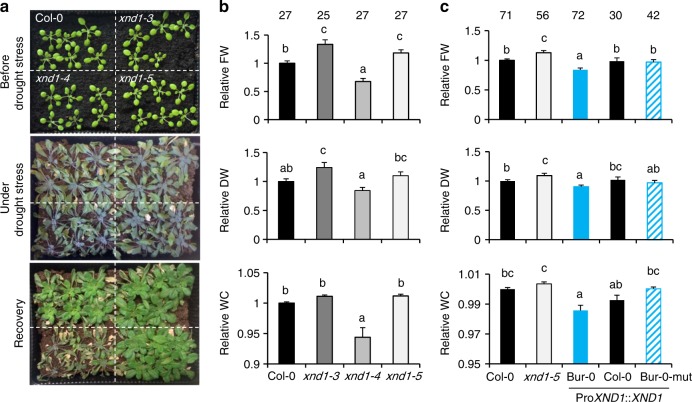
Soil water uptake by roots is a key component of plant performance and adaptation to adverse environments. Here, we use a genome-wide association analysis to identify the XYLEM NAC DOMAIN 1 (XND1) transcription factor as a negative regulator of Arabidopsis root hydraulic conductivity (Lpr). The distinct functionalities of a series of natural XND1 variants and a single nucleotide polymorphism that determines XND1 translation efficiency demonstrate the significance of XND1 natural variation at species-wide level. Phenotyping of xnd1 mutants and natural XND1 variants show that XND1 modulates Lpr through action on xylem formation and potential indirect effects on aquaporin function and that it diminishes drought stress tolerance. XND1 also mediates the inhibition of xylem formation by the bacterial elicitor flagellin and counteracts plant infection by the root pathogen Ralstonia solanacearum. Thus, genetic variation at XND1, and xylem differentiation contribute to resolving the major trade-off between abiotic and biotic stress resistance in Arabidopsis.


Conflict of interest statement

The authors declare no competing interests.

Figures

Fig. 1
Fig. 1
Identification of XND1 as a genetic determinant of root hydraulic conductivity. a Manhattan plot of GWA for root hydraulic conductivity (Lpr) data based on a conditioned accelerated mixed-model. The chromosomes are depicted in different colors and the x-axis represents the chromosome number and position. A Bonferroni corrected significance threshold at α = 0.05 is indicated by the horizontal dashed line. b, c Gene models of 20-kb genomic regions surrounding the two most significantly associated SNPs. The blue and purple dots represent these SNPs, and numbers on x-axes indicate chromosomal positions in base pairs. d Molecular and phenotypic characterization of three xnd1 T-DNA insertion lines. The upper diagram shows a schematic representation of the XND1 genomic region with positions of the three T-DNA insertions. The bar graph on the left shows XND1 transcript abundance relative to Col-0 (relative expression level, REL) in the xnd1 lines (means ± SE, based on two biological repeats). The bar graph on the right shows Lpr phenotypes before (whole bars) or after (hatched bars) root treatment for 30 min with the aquaporin blocker NaN3. e, f Lpr phenotype of Col-0 transgenic lines with XND1 constructs under control of a CaMV35S (e) or a xylem specific XCP2Pro (XCP2p) (f) promoter. In f, plants expressing GFP alone under the control of XCP2Pro were used as negative controls. In all panels, Lpr data (means ± SE) were based on the indicated number of plants in two to three independent experiments. Asterisks indicate significant differences with respect to control lines (Student’s t test; *P < 0.05, **P < 0.01)
Fig. 2
Fig. 2
A XND1-based association analysis allows refining the natural allelic variations of XND1. a The association with Lpr of 27 polymorphic sites (MAF > 0.05) in the indicated XND1 genomic region was investigated in a set of 112 accessions. The x-axis shows the nucleotide position of each variant, with empty and filled circles indicating INDELs and SNPs, respectively. The y-axis shows the –log10(P) for the association tests, with the significance threshold at α = 0.05 indicated with a dashed line. b The eight polymorphisms selected for further analysis are projected onto a schematic representation of XND1 gene structure. For position −1962, + and − represent an insertion and deletion, respectively. The boxes represent exons, with solid and empty boxes showing translated and untranslated regions, respectively. The SNP at Chr 5-P25,795,349 that surpassed the significance threshold in a is located in the 5’-UTR of XND1 and indicated as SNPUTR. c The eight selected nucleotide polymorphisms (with their distance from translation start site shown on the top) define six haplogroups (H1–H6). Representative accessions and mean Lpr ± SE within each haplogroup (n, accessions number) are shown. One-way ANOVA (Fisher’s LSD, P < 0.05) was used to test the significance of the Lpr data. d Transgenic complementation of xnd1–5 with different allelic forms of XND1. The Lpr of Col-0, xnd1–5, and xnd1–5 plants expressing XND1 genomic fragments from Bur-0, Ty-0, Col-0, or Fei-0, was tested using 3–5 independent transgenic lines per XND1 allele (see Supplementary Figure 5). Mean values ± SE (n = 14–63 plants) are shown with sample size indicated on the top. One-way ANOVA (Fisher’s LSD, P < 0.05) was used to test the significance of the data
Fig. 3
Fig. 3
SNPUTR of XND1 contributes to Lpr variation. Transgenic complementation of xnd1–5 with Col-0 or Bur-0 allelic forms of XND1, either wild-type or with a site-directed mutation at SNPUTR. a, d Schematic representation of investigated XND1 allelic forms. Col-0 and Bur-0 indicate the wild-type forms while Col-0-mut and Bur-0-mut indicate the corresponding point mutated forms. b, e Transcript abundance of XND1 in xnd1–5 homozygous transgenic lines expressing the Col-0, Col-0-mut, Bur-0, or Bur-0-mut forms of XND1. Three to five independent transgenic lines (two biological replicates for each) were studied for each form. Mean values ± SE (n = 18–30) were normalized to transcript abundance in Col-0. c, f Lpr of the transgenic lines described above. Three to five independent transgenic lines were phenotyped for each form. Mean values ± SE are shown with total number of plants indicated on the top. Student’s t test (*P < 0.05) was used to assess the statistical significance of the data (n.s. = not significant). XND1 expression and Lpr data in individual transgenic lines are shown in Supplementary Figure 7
Fig. 4
Fig. 4
XND1-dependent natural variation of Lpr is contributed by effects of SNPUTR on XND1 translation. ac XND1 transcript abundance was measured in the roots of 49 accessions using 6–10 plants and two independent experiments per accession. Data were analyzed considering each individual accession (a) or their grouping in the H1-H6 (b) or SNPUTR-C vs. SNPUTR-T haplogroups (c). Pearson correlation coefficient (r) and P value (P) between XND1 transcript level and Lpr are shown in a and b. Error bars in b and c indicate SE. Accession number per haplogroup was n = 3–18 in b and as indicated in c (**P < 0.01 in Student’s t test). d A XND1–GFP fusion construct was placed downstream of a CaMV35S promoter and a XND1 5’-UTR, with either C or T at SNPUTR. Note that this SNP is the only variation between Bur-0 and Col-0 XND1 alleles present in the construct sequence. Transcript abundance and fluorescence intensity of XND1–GFP was quantified in the roots of 9–10 transgenic lines per genotype, with two biological replicates. Relative translation efficiency of XND1–GFP was calculated in each individual line from the ratio of fluorescence to mRNA abundance. Mean values ± SE based on total number of lines and repeats are indicated on the right and were normalized to the data for SNPUTR-C. Student’s t test (*P < 0.05) was used to assess the statistical significance of the data
Fig. 5
Fig. 5
XND1 negatively regulates root xylem formation. a The figure shows schematic representation of 2-cm-long segments (R1–R5) used for characterization of xylem anatomy in the indicated genotypes and representative cross-sections within the R2 segment. Arrowheads and arrows indicate protoxylem and metaxylem, respectively. Asterisks indicate pericycle cells adjacent to xylem poles. Scale bars represent 20 µm. b, c Xylem area (b) and vessel number (c) (mean values ± SE) were measured in the indicated root segment and genotype, in 20–61 sections from 10–15 plants and 2–3 independent experiments. One-way ANOVA (Fisher’s LSD, P < 0.05) was used to test the significance of the data (n.s. = not significant)
Fig. 6
Fig. 6
XND1 negatively regulates plant drought stress tolerance. a Shoot phenotypes of Col-0 and xnd1 plants at 22 days postgermination (upper panel), after water deprivation for 24 additional days (middle panel), and at 5 days after rewatering (lower panel). b Relative fresh weight (FW), dry weight (DW) and water content (WC) in shoots of indicated genotypes at 5 days after rewatering (see a). All data were normalized to values measured in Col-0 plants from the same pot. The figure shows mean values ± SE from the indicated number of plants and four biological replicates. One-way ANOVA (Fisher’s LSD, P < 0.05) was used to test the significance of the data. c Same parameters as in b but for Col-0, xnd1–5, and xnd1–5 plants complemented with the Bur-0, Col-0, or Bur-0-mut XND1 alleles. Three to five independent transgenic lines were phenotyped for each allele. Mean values ± SE from the indicated number of plants are shown. One-way ANOVA (Fisher’s LSD, P < 0.05) was used to test the significance of the data
Fig. 7
Fig. 7
XND1 mediates the inhibition of xylem formation by flg22 and resistance to R. solanacearum. a, b Plants of the indicated genotype were grown for 4 days in the absence (mock) or in the presence of 0.25 µM flg22 (flg22). R2 and R3 root segments (see Fig. 5a) were cross-sectioned and xylem area (a) and xylem vessel number (b) were measured. Data are means ± SE from 18–50 sections in 6–10 plants and two independent experiments. One-way ANOVA (Fisher’s LSD, P < 0.05) was used to test the significance of the data. c The indicated genotypes were inoculated with R. solanacearum through root dipping and plant survival (in %) was scored at the indicated days postinoculation. Cumulated data from three independent biological experiments, each with three technical repeats comprising at least 24–32 plants. Stars indicate significant differences from Col-0 based on a Gehan–Breslow–Wilcoxon test (P < 0.0001). The Col-0 and xnd1–3 curves were not significantly different (P = 0.1304). d in planta growth measurement of R. solanacearum at 3 days after inoculation of the indicated genotypes. Each dot represents a replicate of two plants and the black line indicates the mean of all the replicates. Cumulated data from four independent biological repeats. Asterisks indicate a significant difference with Col-0 (Mann–Whitney test; P < 0.05)

Similar articles

Cited by

References

    1. Maurel C, et al. Aquaporins in plants. Physiol. Rev. 2015;95:1321–1358. doi: 10.1152/physrev.00008.2015. - DOI - PubMed
    1. Shahzad Z, Amtmann A. Food for thought: how nutrients regulate root system architecture. Curr. Opin. Plant. Biol. 2017;39:80–87. doi: 10.1016/j.pbi.2017.06.008. - DOI - PMC - PubMed
    1. Sutka M, et al. Natural variation of root hydraulics in Arabidopsis grown in normal and salt stress conditions. Plant Physiol. 2011;155:1264–1276. doi: 10.1104/pp.110.163113. - DOI - PMC - PubMed
    1. Adachi S, et al. Characterization of a rice variety with high hydraulic conductance and identification of the chromosome region responsible using chromosome segment substitution lines. Ann. Bot. 2010;106:803–811. doi: 10.1093/aob/mcq175. - DOI - PMC - PubMed
    1. Lynch JP, Chimungu JG, Brown KM. Root anatomical phenes associated with water acquisition from drying soil: targets for crop improvement. J. Exp. Bot. 2014;65:6155–6166. doi: 10.1093/jxb/eru162. - DOI - PubMed

Publication types

MeSH terms

LinkOut - more resources