. 2018 Oct;16(4):3623-3631.
doi: 10.3892/etm.2018.6613. Epub 2018 Aug 17.

Intrapancreatic accessory spleen: Evaluation with CT and MRI

Affiliations

Intrapancreatic accessory spleen: Evaluation with CT and MRI

Qianjiang Ding et al. Exp Ther Med. 2018 Oct.

Abstract

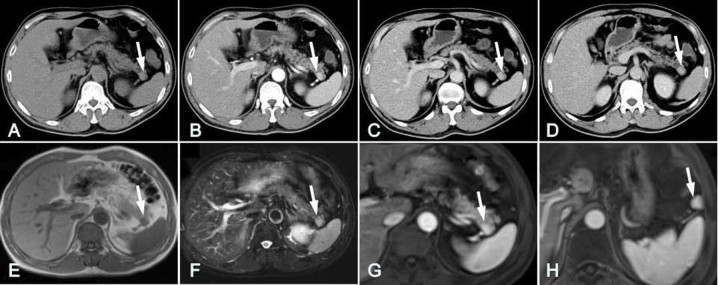
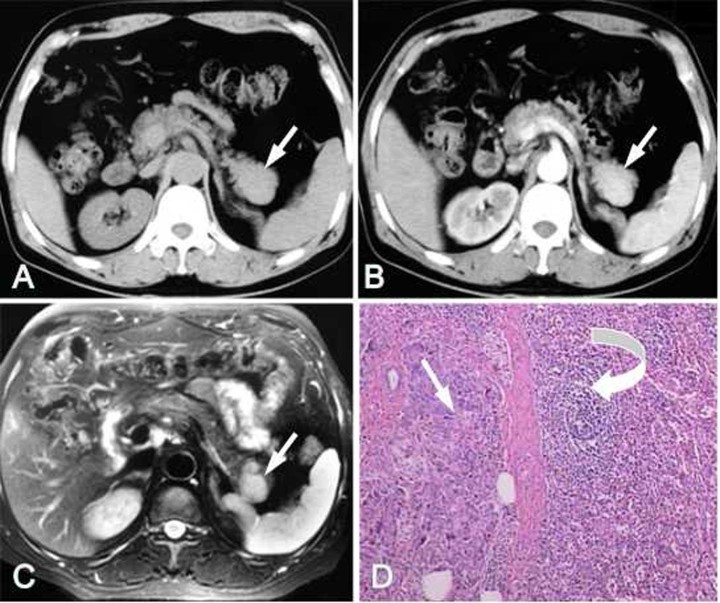
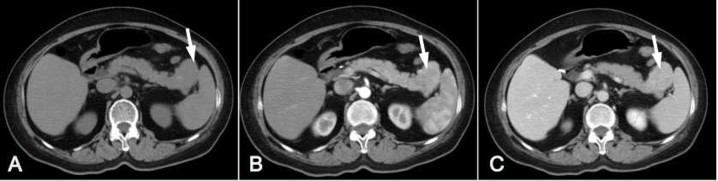
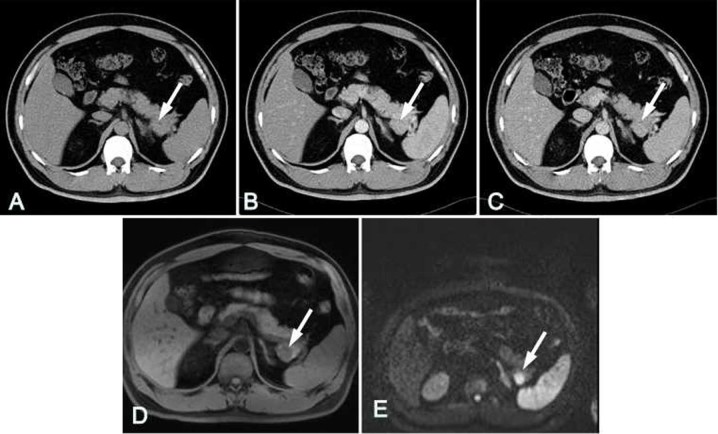
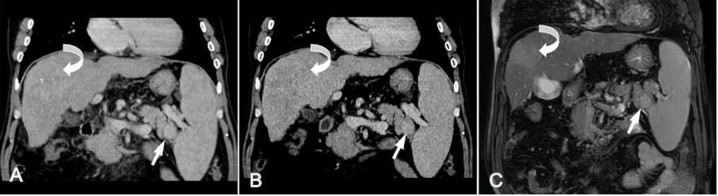
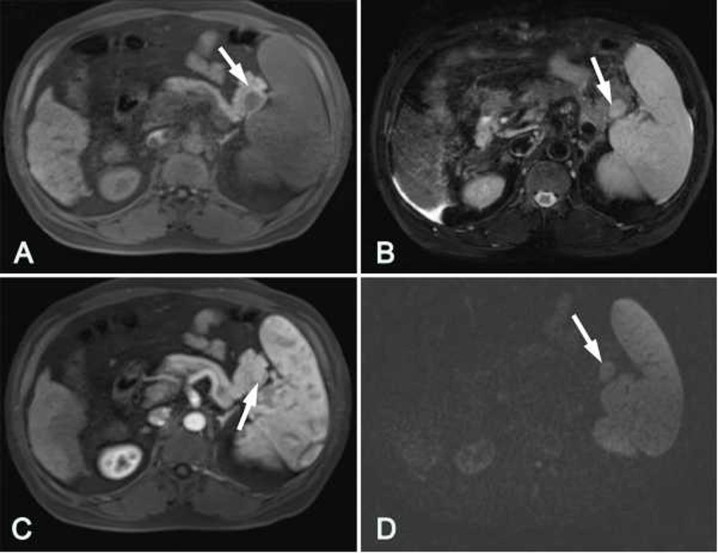
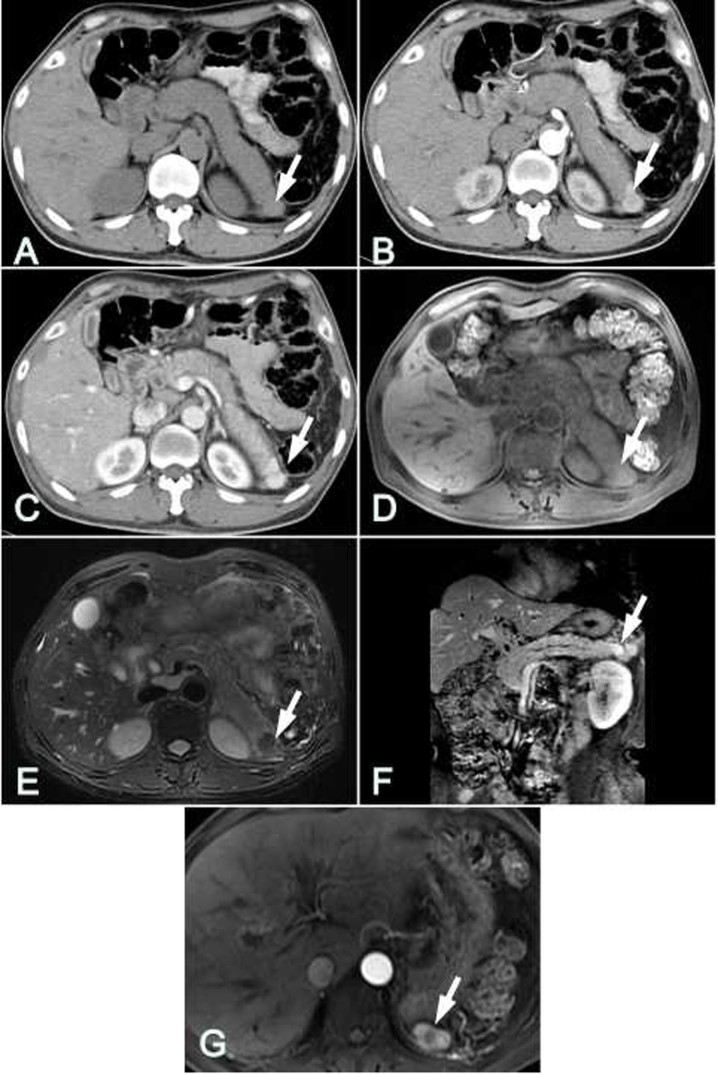
The aim of the present study was to evaluate the characteristics of computed tomography (CT) and magnetic resonance imaging (MRI), particularly diffusion-weighted imaging (DWI), in the imaging of intrapancreatic accessory spleen (IPAS). The clinical and pathological records of 9 patients, including 8 patients with IPAS and 1 patient with splenosis, were reviewed. The patients had undergone plain and triple-phase enhanced CT scanning (n=9) and MRI scanning (n=8). The lesions of the 8 IPAS patients were located in the pancreatic tail, and were round (n=3), oval (n=4) or triangular (n=1) in shape. The CT and/or MRI densities, signal intensities and dynamic enhanced patterns of the lesions were similar to those of the orthotopic spleen. In DWI images (n=5), the IPAS regions presented high signal intensity (SI), and no significant difference in the apparent diffusion coefficient determined using a b-value of 600 sec/mm2 was identified between the IPAS and orthotopic spleen (P>0.05). One patient with splenosis complicated with cirrhosis had a nodule located in the pancreatic tail with an unenhanced CT value of 65 HU. In MRI examination, with the exception of the dynamic enhancement pattern, the T1-weighted, T2-weighted and DWI signals of splenosis were inconsistent with those of the normal spleen. In conclusion, in pre-contrast and post-contrast-enhanced CT and MRI images, IPAS exhibits similar characteristics to the orthotopic spleen. CT and MRI used in combination with DWI are important in the diagnosis of IPAS.

Keywords: computed tomography; diffusion-weighted imaging; intrapancreatic accessory spleen; magnetic resonance imaging.


Figures

Figure 1.
Figure 1.
Case 5. CT and MRI images of a 50-year-old male with IPAS. (A) In the pre-contrast CT image, slight hyper-attenuation of the lesion was visible in the pancreatic tail compared with the pancreas (arrow). Contrast-enhanced axial CT images were obtained in the (B) arterial phase, (C) portal venous phase and (D) delayed phase. High attenuation was shown for the IPAS (arrows) compared with the pancreas in all phases, and the attenuation level of the IPAS was comparable with that of the orthotopic spleen. The lesion (arrow) had (E) a low signal level in T1-weighted imaging and (F) a high signal level in T2-weighted imaging. (G) In gadolinium-enhanced MRI of the arterial phase, the lesion was clearly enhanced. The SI of the nodule was comparable to that of the spleen. (H) In MRI at the splenic hilum level, a triangular accessory spleen (arrow) was visible with a degree of enhancement comparable to that of the orthotopic spleen. CT, computed tomography; MRI, magnetic resonance imaging; IPAS, intrapancreatic accessory spleen.
Figure 2.
Figure 2.
Case 2. IPAS was detected in a 44-year-old male due to upper abdominal pain and melena. (A) Unenhanced CT exhibited an oval, well-defined nodule bulging to the anterior and posterior of the pancreatic tail. (B) In a CT image of the arterial phase, homogeneous enhancement was observed for the lesion (arrow). (C) The lesion (arrow) had a high signal level in T2-weighted imaging. (D) The splenic tissue (curved arrow) located at the pancreatic parenchyma (arrow) was confirmed using histopathologic analysis (hematoxylin and eosin staining), and the IPAS was composed of red and white pulp, like normal spleen. Magnification, ×100. IPAS, intrapancreatic accessory spleen; CT, computed tomography.
Figure 3.
Figure 3.
Case 7. A 63-year-old female was diagnosed with IPAS during a health examination. (A) Unenhanced computed tomography imaging exhibited a triangular lesion with low density in the forepart of the pancreatic tail, and the lesion was visible in front of the pancreatic tail (arrow). (B) The heterogeneous zebra-striped enhancement pattern within the lesion (arrow) was similar to the orthotopic spleen in the arterial phase. (C) The IPAS enhancement (arrow) tended to be homogeneous in the portal venous phase, and the density difference between the IPAS and its surrounding pancreatic tissue was evident. IPAS, intrapancreatic accessory spleen.
Figure 4.
Figure 4.
Case 1. A 56-year-old male was confirmed to have IPAS by surgical pathology. (A) The unenhanced CT image exhibited only slight enlargement of the pancreatic tail. In the (B) arterial phase and (C) delayed phase, similar attenuation levels were observed for the IPAS (arrow) and the surrounding pancreatic tissue. (D) In T1-weighted imaging, the IPAS exhibited a low signal in the pancreatic tissues (arrow). (E) In diffusion-weighted imaging using a high b-value (600 sec/mm2), the lesion (arrow) clearly had higher signal intensity than the pancreas. IPAS, intrapancreaticaccessory spleen; CT, computed tomography.
Figure 5.
Figure 5.
Case 3. CT and MRI images of a 57-year-old male with IPAS complicated with advanced cirrhosis and hepatocellular carcinoma. Coronal reconstructed CT images obtained in the (A) arterial phase and (B) delayed phase demonstrated that the density of the nodule (arrows) matched that of the orthotopic spleen, and was higher than that of the surrounding pancreatic tissue. In addition, a mass was observed in segment VII of the liver with an enhancement characteristic of ‘quick wash in and wash out’ (curved arrows). (C) Coronal MRI using true fast imaging with steady state precession revealed that the signal intensity of the nodule (arrow) was consistent with that of the orthotopic spleen, and the liver tumor (curved arrow) had slightly higher SI. CT, computed tomography; MRI, magnetic resonance imaging; IPAS, intrapancreatic accessory spleen.
Figure 6.
Figure 6.
Case 3. The nodule in the pancreatic tail (arrows) had (A) a low signal level in T1-weighted imaging and (B) a high signal level in T2-weighted imaging. (C) Enhanced MRI presented a zebra-patterned enhancement in the arterial phase. (D) In diffusion-weighted imaging at a high b-value (600 sec/mm2), the lesion clearly had higher signal intensity than the surrounding pancreas. In these MRI sequences, the signals for the IPAS lesion were similar to those of the orthotopic spleen. MRI, magnetic resonance imaging; IPAS, intrapancreatic accessory spleen.
Figure 7.
Figure 7.
Case 4. Splenosis located in the pancreatic tail and intraperitoneal region of a 55-year-old man who had undergone splenectomy due to liver cirrhosis. (A) In a pre-contrast axial CT scan, the lesion (arrow) exhibited hyper-attenuation compared with the pancreas, and the CT value was 65 HU. Axial CT images were obtained in the (B) arterial phase and (C) portal venous phase. The lesion (arrow) exhibited higher attenuation than the surrounding pancreas in the two phases. (B) The inhomogeneous enhancement within the lesion (arrow) was similar to the zebra-striped enhancement of the spleen in the arterial phase. The lesion (arrow) had (D) a slightly higher signal level compared with the pancreas in T1-weighted imaging and (E) lower signal level in T2-weighted imaging. (F) On a consistent projection reconstructionimage obtained in the portal phase, the lesion (arrow) presented hyper-intensity compared with the pancreas. (G) In MRI of the base of the stomach, another splenosis was detected in the left subphrenic space (arrow), which had the same enhanced pattern as the intrapancreaticsplenosis. CT, computed tomography.

Similar articles

Cited by

References

    1. Movitz D. Accessory spleens and experimental splenosis. Principles of growth. Chic Med Sch Q. 1967;26:183–187. - PubMed
    1. Kim SH, Lee JM, Han JK, Lee JY, Kim KW, Cho KC, Choi BI. Intrapancreatic accessory spleen: Findings on MR Imaging, CT, US and scintigraphy, and the pathologic analysis. Korean J Radiol. 2008;9:162–174. doi: 10.3348/kjr.2008.9.2.162. - DOI - PMC - PubMed
    1. Halpert B, Alden ZA. Accessory spleens in or at the tail of the pancreas. A survey of 2700 additoonal necropsies. Arch Pathol. 1964;77:652–654. - PubMed
    1. Halpert B, Gyorkey F. Lesions observed in accessory spleens of 311 patients. Am J Clin Pathol. 1959;32:165–168. doi: 10.1093/ajcp/32.2.165. - DOI - PubMed
    1. Matthaei H, Schmelzle M, Braunstein S, Bölke E, Peiper M. Pancreatic incidentalomas: A growing clinical challenge exemplified by an intrapancreatic accessory spleen. Wien Klin Wochenschr. 2011;123:186–188. doi: 10.1007/s00508-011-1543-1. - DOI - PubMed

LinkOut - more resources