

A meta-analysis and bioinformatics exploration of the diagnostic value and molecular mechanism of miR-193a-5p in lung cancer
- PMID: 30250529
- PMCID: PMC6144214
- DOI: 10.3892/ol.2018.9174
A meta-analysis and bioinformatics exploration of the diagnostic value and molecular mechanism of miR-193a-5p in lung cancer
Abstract
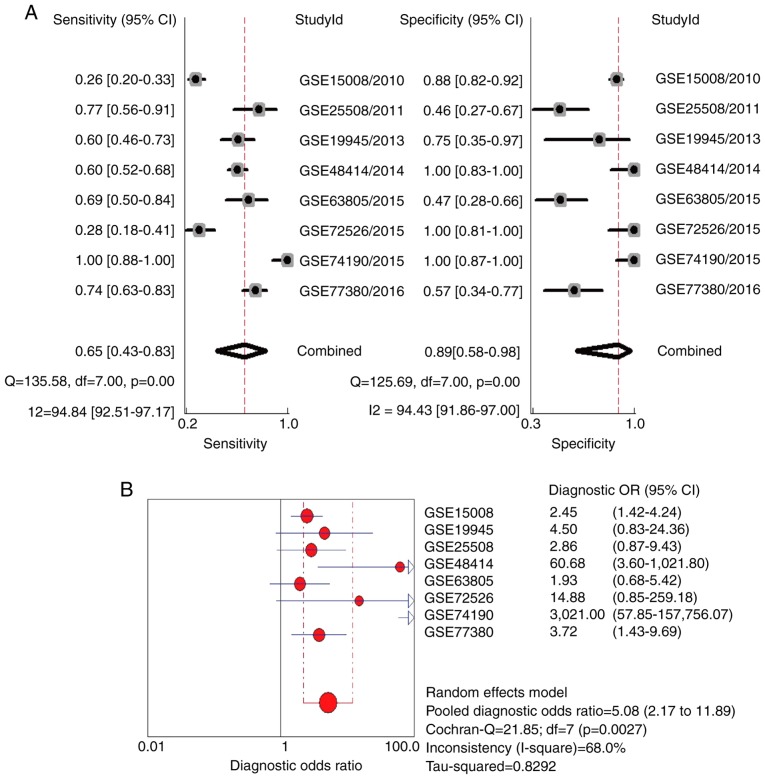
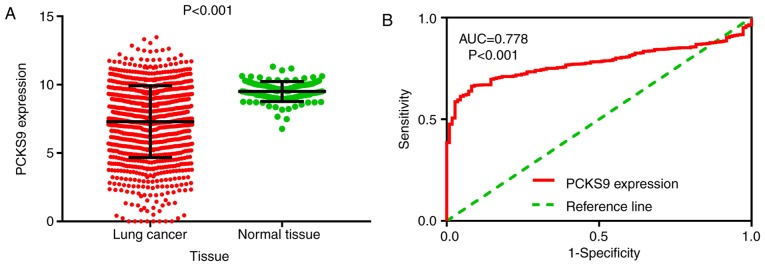
Lung cancer is a leading cause of mortality worldwide and despite recent improvements in lung cancer treatments patient mortality remains high. miR-193a-5p serves a crucial role in the initiation and development of cancer; it is necessary to understand the underlying molecular mechanisms of miR-193a-5p in lung cancer, which may enable the development of improved clinical diagnoses and therapies. The present study investigated the diagnostic value of peripheral blood and tissue miR-193a-5p expression using a microarray meta-analysis. Peripheral blood miR-193a-5p was revealed to be upregulated in patients with lung cancer. The pooled area under the curve (AUC) was 0.67, with a sensitivity and specificity of 0.74 and 0.56, respectively. Conversely, the peripheral tissue miR-193a-5p expression in patients with lung cancer was significantly downregulated. The pooled AUC was 0.83, and the sensitivity and specificity were 0.65 and 0.89, respectively. Through bioinformatics analysis, three Kyoto Encyclopedia of Genes and Genomes (KEGG) terms, pathways in cancer, prostate cancer and RIG-I-like receptor signaling pathway, were identified as associated with miR-193a-5p in lung cancer. In addition, in lung cancer, six key miR-193a-5p target genes, receptor tyrosine-protein kinase erbB-2 (ERBB2), nuclear cap-binding protein subunit 2 (NCBP2), collagen α-1(I) chain (COL1A1), roprotein convertase subtilisin/kexin type 9 (PCSK9), casein kinase II subunit α (CSNK2A1) and nucleolar transcription factor 1 (UBTF), were identified, five of which were significantly upregulated (ERBB2, NCBP2, COL1A1, CSNK2A1 and UBTF). The protein expression of ERBB2, NCBP2, COL1A1, CSNK2A1 and UBTF was also upregulated. NCBP2 and CSNK2A1 were negatively correlated with miR-193a-5p. The results demonstrated that miR-193a-5p exhibited opposite expression patterns in peripheral blood and tissue. Upregulated peripheral blood miR-193a-5p and downregulated tissue miR-193a-5p may be promising diagnostic biomarkers in lung cancer. In addition, the KEGG terms pathways in cancer, prostate cancer and RIG-I-like receptor signaling pathway may suggest which pathways serve vital roles in lung cancer by regulating miR-193a-5p. In addition, six genes, ERBB2, COL1A1, PCSK9, UBTF and particularly NCBP2 and CSNK2A1, may be key target genes of miR-193a-5p in lung cancer.
Keywords: bioinformatics; diagnosis; lung cancer; microRNA-193a-5p; target genes.
Figures


Similar articles
-
MiR-193a-5p/ERBB2 act as concurrent chemoradiation therapy response indicator of esophageal squamous cell carcinoma.Oncotarget. 2016 Jun 28;7(26):39680-39693. doi: 10.18632/oncotarget.9444. Oncotarget. 2016. PMID: 27203740 Free PMC article.
-
Long Non-Coding RNA Cancer Susceptibility 9 (CASC9) Up-Regulates the Expression of ERBB2 by Inhibiting miR-193a-5p in Colorectal Cancer.Cancer Manag Res. 2020 Feb 20;12:1281-1292. doi: 10.2147/CMAR.S234620. eCollection 2020. Cancer Manag Res. 2020. Retraction in: Cancer Manag Res. 2020 Nov 16;12:11675. doi: 10.2147/CMAR.S291181. PMID: 32110102 Free PMC article. Retracted.
-
The clinical value of miR-193a-3p in non-small cell lung cancer and its potential molecular mechanism explored in silico using RNA-sequencing and microarray data.FEBS Open Bio. 2018 Jan 4;8(1):94-109. doi: 10.1002/2211-5463.12354. eCollection 2018 Jan. FEBS Open Bio. 2018. PMID: 29321960 Free PMC article.
-
A review on the role of MiR-193a-5p in oncogenesis and tumor progression.Front Oncol. 2025 Mar 14;15:1543215. doi: 10.3389/fonc.2025.1543215. eCollection 2025. Front Oncol. 2025. PMID: 40161373 Free PMC article. Review.
-
Diagnostic and Prognostic Value of miR-93 in Prostate Cancer: A Meta-Analysis and Bioinformatics Analysis.Iran J Public Health. 2023 Nov;52(11):2260-2271. doi: 10.18502/ijph.v52i11.14026. Iran J Public Health. 2023. PMID: 38106826 Free PMC article. Review.
Cited by
-
Multi-omics characterization of esophageal squamous cell carcinoma identifies molecular subtypes and therapeutic targets.JCI Insight. 2024 Apr 23;9(10):e171916. doi: 10.1172/jci.insight.171916. JCI Insight. 2024. PMID: 38652547 Free PMC article.
-
Machine learning-based integration develops a mitophagy-related lncRNA signature for predicting the progression of prostate cancer: a bioinformatic analysis.Discov Oncol. 2024 Jul 29;15(1):316. doi: 10.1007/s12672-024-01189-5. Discov Oncol. 2024. PMID: 39073679 Free PMC article.
-
microRNA-193a-5p Suppresses the Migratory Ability of Human KATO III Gastric Cancer Cells through Inhibition of Vimentin and MMP-9.Adv Pharm Bull. 2022 Jan;12(1):169-175. doi: 10.34172/apb.2022.018. Epub 2020 Oct 19. Adv Pharm Bull. 2022. PMID: 35517889 Free PMC article.
-
Evaluation of potential anti-metastatic and antioxidative abilities of natural peptides derived from Tecoma stans (L.) Juss. ex Kunth in A549 cells.PeerJ. 2022 Jul 6;10:e13693. doi: 10.7717/peerj.13693. eCollection 2022. PeerJ. 2022. PMID: 35818360 Free PMC article.
-
Constructing and validating of m7G-related genes prognostic signature for hepatocellular carcinoma and immune infiltration: potential biomarkers for predicting the overall survival.J Gastrointest Oncol. 2022 Dec;13(6):3169-3182. doi: 10.21037/jgo-22-1134. J Gastrointest Oncol. 2022. PMID: 36636051 Free PMC article.
References
-
- Armas-Lopez L, Piña-Sánchez P, Arrieta O, de Alba EG, Ortiz-Quintero B, Santillán-Doherty P, Christiani DC, Zúñiga J, Ávila-Moreno F. Epigenomic study identifies a novel mesenchyme homeobox2-GLI1 transcription axis involved in cancer drug resistance, overall survival and therapy prognosis in lung cancer patients. Oncotarget. 2017;8:67056–67081. doi: 10.18632/oncotarget.17715. - DOI - PMC - PubMed
LinkOut - more resources
Full Text Sources
Other Literature Sources
Research Materials
Miscellaneous