

Differential expressions of integrin-linked kinase, β-parvin and cofilin 1 in high-fat diet induced prostate cancer progression in a transgenic mouse model
- PMID: 30250560
- PMCID: PMC6144922
- DOI: 10.3892/ol.2018.9276
Differential expressions of integrin-linked kinase, β-parvin and cofilin 1 in high-fat diet induced prostate cancer progression in a transgenic mouse model
Abstract
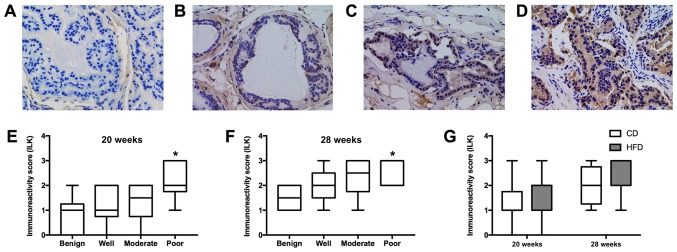
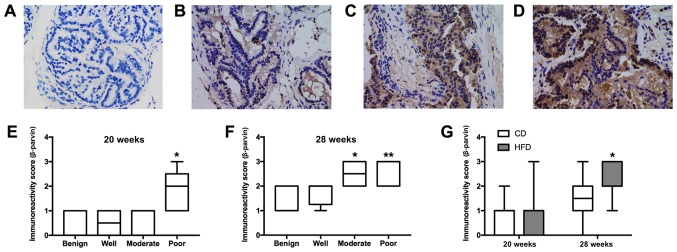
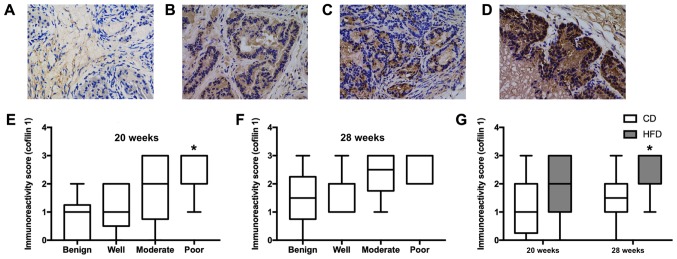
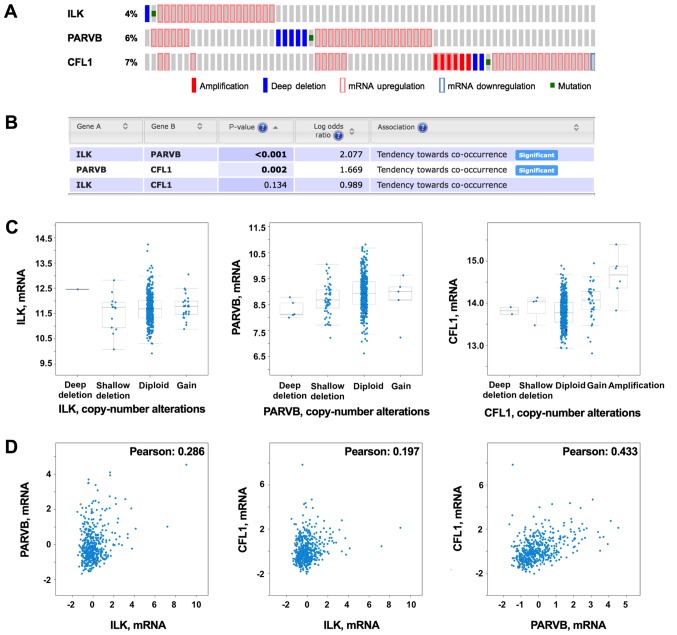
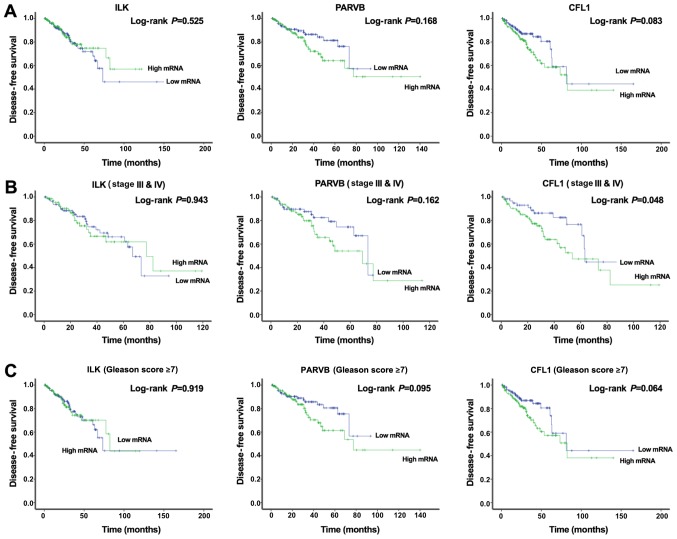
High-fat diet induced obesity was associated with more aggressive prostate cancer. Recent research has demonstrated that integrin-linked kinase (ILK), β-parvin and downstream cofilin 1 jointly affected cancer progression. Meanwhile, these proteins were also involved in energy metabolism. Therefore, the present study was conducted to investigate the potential function of ILK, β-parvin and cofilin 1 in the high-fat diet-induced progression of prostate cancer. Transgenic mice with prostate cancer were employed, fed with different diets and sacrificed at 20 and 28 weeks. Tumor differentiation, extracapsular extension and metastasis were compared between the groups. Expression levels of ILK, β-parvin and cofilin 1 in prostate were evaluated by immunohistochemical analysis and determined by an immunoreactivity score. Public databases were applied for analysis and validation. It was detected that high-fat diet feeding promoted cancer progression in transgenic mice with prostate cancer, with increased expressions of β-parvin (P=0.038) and cofilin 1 (P=0.018). Higher expressions of ILK, β-parvin and cofilin 1 were also associated with poorer cancer differentiation. Additionally, higher mRNA levels of CFL1 were correlated with a worse disease-free survival in patients of certain subgroups from The Cancer Genome Atlas database. Further studies were warranted in discussing the potential roles of ILK, β-parvin and cofilin 1 in high-fat diet feeding induced progression of prostate cancer.
Keywords: cofilin 1; high-fat diet; integrin-linked kinase; prostate carcinoma; β-parvin.
Figures
Similar articles
-
Formation and phosphorylation of the PINCH-1-integrin linked kinase-alpha-parvin complex are important for regulation of renal glomerular podocyte adhesion, architecture, and survival.J Am Soc Nephrol. 2005 Jul;16(7):1966-76. doi: 10.1681/ASN.2004121112. Epub 2005 May 4. J Am Soc Nephrol. 2005. PMID: 15872073
-
Integrin-Linked Kinase in Muscle Is Necessary for the Development of Insulin Resistance in Diet-Induced Obese Mice.Diabetes. 2016 Jun;65(6):1590-600. doi: 10.2337/db15-1434. Epub 2016 Apr 5. Diabetes. 2016. PMID: 27207548 Free PMC article.
-
Functional molecular imaging of ILK-mediated Akt/PKB signaling cascades and the associated role of beta-parvin.J Cell Sci. 2010 Mar 1;123(Pt 5):747-55. doi: 10.1242/jcs.052498. J Cell Sci. 2010. PMID: 20164304
-
Parvin: A hub of intracellular signalling pathways regulating cellular behaviour and disease progression.Acta Histochem. 2022 Oct;124(7):151935. doi: 10.1016/j.acthis.2022.151935. Epub 2022 Aug 4. Acta Histochem. 2022. PMID: 35932544 Review.
-
The PINCH-ILK-parvin complexes: assembly, functions and regulation.Biochim Biophys Acta. 2004 Jul 5;1692(2-3):55-62. doi: 10.1016/j.bbamcr.2004.01.006. Biochim Biophys Acta. 2004. PMID: 15246679 Review.
Cited by
-
Modelling the Tumour Microenvironment, but What Exactly Do We Mean by "Model"?Cancers (Basel). 2023 Jul 26;15(15):3796. doi: 10.3390/cancers15153796. Cancers (Basel). 2023. PMID: 37568612 Free PMC article. Review.
-
Inhibition of the ILK-AKT pathway by upregulation of PARVB contributes to the cochlear cell death in Fascin2 gene knockout mice.Cell Death Discov. 2024 Feb 19;10(1):89. doi: 10.1038/s41420-024-01851-5. Cell Death Discov. 2024. PMID: 38374196 Free PMC article.
-
Downregulation of PARVA promotes metastasis by modulating integrin-linked kinase activity and regulating MAPK/ERK and MLC2 signaling in prostate cancer.Transl Androl Urol. 2021 Feb;10(2):915-928. doi: 10.21037/tau-21-108. Transl Androl Urol. 2021. PMID: 33718092 Free PMC article.
-
Significance of integrin-linked kinase (ILK) in tumorigenesis and its potential implication as a biomarker and therapeutic target for human cancer.Am J Cancer Res. 2019 Jan 1;9(1):186-197. eCollection 2019. Am J Cancer Res. 2019. PMID: 30755822 Free PMC article. Review.
-
Research Evidence on High-Fat Diet-Induced Prostate Cancer Development and Progression.J Clin Med. 2019 Apr 30;8(5):597. doi: 10.3390/jcm8050597. J Clin Med. 2019. PMID: 31052319 Free PMC article. Review.
References
LinkOut - more resources
Full Text Sources
Other Literature Sources
Miscellaneous