The synergistic effect of propofol and ulinastatin suppressed the viability of the human lung adenocarcinoma epithelial A549 cell line
- PMID: 30250587
- PMCID: PMC6144888
- DOI: 10.3892/ol.2018.9283
The synergistic effect of propofol and ulinastatin suppressed the viability of the human lung adenocarcinoma epithelial A549 cell line
Abstract
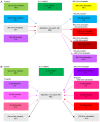
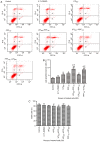
Ulinastatin and propofol (PPF) are recognized for their anticancer properties. The aim of the present study was to evaluate the synergistic antitumor effect of PPF followed by ulinastatin against A549 cells. In MTT assays, PPF (10, 20 and 30 µM) followed by 200 U/ml ulinastatin was more effective at inhibiting A549 cell viability compared with PPF (10, 20 and 30 µM) or 200 U/ml ulinastatin. PPF (10, 20 and 30 µM) followed by 200 U/ml ulinastatin treatments synergistically increased the number of S cells and synergistically reduced the number of G2/M cells associated with PPF stimulation in a dose-dependent manner. Western blot analysis demonstrated that the antitumor effect of PPF followed by 200 U/ml ulinastatin treatments were associated with the downregulated expression of extracellular signal-regulated kinase 1 and 2 phosphorylation (p-ERK1/2) and matrix metalloproteinases 2 (MMP-2). In conclusion, these data demonstrated that PPF (20 and 30 µM) followed by 200 U/ml ulinastatin treatments synergistically stimulated a significant proportion of A549 cells in S phase. Furthermore, the combination synergistically reduced a significant proportion of A549 cells in G2/M phase and synergistically suppressed the viability of A549 cells, which was possibly related regulation of the expression of p-ERK1/2 and MMP-2 in A549 cells.
Keywords: A549 cells; antitumor; extracellular signal-regulated kinase 1 and 2 phosphorylation; matrix metalloproteinases 2; propofol; ulinastatin.
Figures


Similar articles
-
Propofol pretreatment attenuates LPS-induced granulocyte-macrophage colony-stimulating factor production in cultured hepatocytes by suppressing MAPK/ERK activity and NF-kappaB translocation.Toxicol Appl Pharmacol. 2008 Jun 15;229(3):362-73. doi: 10.1016/j.taap.2008.01.044. Epub 2008 Feb 21. Toxicol Appl Pharmacol. 2008. PMID: 18387647
-
Combination of nadroparin with radiotherapy results in powerful synergistic antitumor effects in lung adenocarcinoma A549 cells.Oncol Rep. 2016 Oct;36(4):2200-6. doi: 10.3892/or.2016.4990. Epub 2016 Aug 1. Oncol Rep. 2016. PMID: 27498922
-
Suppression of cell invasion and migration by propofol are involved in down-regulating matrix metalloproteinase-2 and p38 MAPK signaling in A549 human lung adenocarcinoma epithelial cells.Anticancer Res. 2012 Nov;32(11):4833-42. Anticancer Res. 2012. PMID: 23155249
-
Propofol induces apoptosis of non-small cell lung cancer cells via ERK1/2-dependent upregulation of PUMA.Eur Rev Med Pharmacol Sci. 2018 Jul;22(13):4341-4349. doi: 10.26355/eurrev_201807_15431. Eur Rev Med Pharmacol Sci. 2018. PMID: 30024623
-
Effect of ulinastatin on paraquat-induced-oxidative stress in human type II alveolar epithelial cells.World J Emerg Med. 2013;4(2):133-7. doi: 10.5847/wjem.j.issn.1920-8642.2013.02.009. World J Emerg Med. 2013. PMID: 25215107 Free PMC article.
Cited by
-
NEIL3 may act as a potential prognostic biomarker for lung adenocarcinoma.Cancer Cell Int. 2021 Apr 20;21(1):228. doi: 10.1186/s12935-021-01938-4. Cancer Cell Int. 2021. PMID: 33879165 Free PMC article.
-
Dichloroacetate enhances the antitumor effect of pirarubicin via regulating the ROS-JNK signaling pathway in liver cancer cells.Cancer Drug Resist. 2020 Sep 4;3(4):947-958. doi: 10.20517/cdr.2020.32. eCollection 2020. Cancer Drug Resist. 2020. PMID: 35582217 Free PMC article.
-
Ulinastatin attenuates renal fibrosis by regulating AMPK/HIF-1α signaling pathway-mediated glycolysis.Sci Rep. 2024 Nov 14;14(1):28032. doi: 10.1038/s41598-024-78092-0. Sci Rep. 2024. PMID: 39543285 Free PMC article.
-
A preliminary study of influences of hydroxyethyl starch combined with ulinastatin on degree of edema in newborns with capillary leak syndrome.Am J Transl Res. 2021 Apr 15;13(4):2626-2634. eCollection 2021. Am J Transl Res. 2021. PMID: 34017422 Free PMC article.
References
LinkOut - more resources
Full Text Sources
Other Literature Sources
Miscellaneous
