. 2018 Oct;16(4):5339-5348.
doi: 10.3892/ol.2018.9296. Epub 2018 Aug 13.

Fenretinide targeting of human colon cancer sphere cells through cell cycle regulation and stress-responsive activities

Affiliations

Fenretinide targeting of human colon cancer sphere cells through cell cycle regulation and stress-responsive activities

Lanlan Liu et al. Oncol Lett. 2018 Oct.

Abstract

Cancer stem cells (CSCs) are considered to be the main cause of chemoresistance and the resultant low survival rate of patients with cancer. N-(4-hydroxyphenyl)-retinamide, known as fenretinide or 4HPR, is a synthetic derivative of all-trans-retinoic acid. It is a promising anticancer agent, has minimal side effects and synergizes with other anticancer agents to reinforce their anticancer efficacy. The present study investigated whether fenretinide eliminated colon sphere cells. HT29 and HCT116 cells incubated in low-serum culture medium were more sensitive to fenretinide treatment than those incubated in full-serum medium. Colon spheres formed in serum-free medium demonstrated stem-like characteristics. The percentage of cluster of differentiation (CD) 44+ cells was significantly higher in sphere cells compared with parental cells. Sphere cells also demonstrated increased tumorigenic ability in non-obese diabetic/severe combined immunodeficiency mice. Fenretinide inhibited the formation of colon spheres in HT29 and HCT116 cells. Microarray, cell cycle and reverse transcription-quantitative polymerase chain reaction analysis revealed that fenretinide induced genes associated with cell cycle regulation and the stress response in fenretinide-treated HT29 sphere cells. To the best of our knowledge, the present study was the first to investigate the effect of fenretinide on colon stem cells. Fenretinide was demonstrated to preferentially target colon sphere cells, which may possess certain stem-like characteristics. These results are an important addition to the current knowledge concerning fenretinide, and provide a foundation for its clinical application in the treatment of cancer.

Keywords: cancer stem cells; cell cycle; cell stress; colon cancer; fenretinide; sphere.


Figures
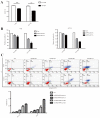
Figure 1.
Figure 1.
Cells cultured in low-serum medium displayed greater sensitivity to 4HPR. (A) Cells grown in low-serum medium were arrested in the G0 phase, with higher ratio of cells in G0/G1. (B) Viability of HT29 and HCT116 cell lines grown in normal or low-serum medium 48 or 72 h following treatment with 4HPR (6 µM), relative to the negative control, as assessed by MTT assay. (C) HT29 and HCT116 cells were cultured in normal or low-serum medium were treated with 6 µM 4HPR for 48 or 72 h, and the proportion of apoptotic cells was assessed using an Annexin V/FITC assay. Data are expressed as the mean ± standard error of the mean and are representative of at least three independent experiments. **P<0.01 and ***P<0.001 vs. 0.5% FBS. 4HPR, fenretinide; FITC, fluorescein isothiocyante; FBS, fetal bovine serum.
Figure 2.
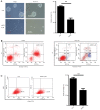
Figure 2.
Spheres from HT29 and HCT116 cells exhibited stem cell-like characteristics in serum-free medium. (A) HT29 and HCT116 cells formed spheres under sphere-forming conditions. The sphere was photographed using an inverted microscope following the culture of a single cell in a 96-well suspension culture plate for 5 days. (B) Representative flow cytometry plots revealing the percentages of cluster of differentiation 44+ cells in HT29 parental cells and sphere cells. (C) Comparison of the tumorigenic ability of HT29 parental cells and sphere cells in immune-deficient mice. (D) Comparison of the relative cell viability of the parental HT29 cells and the sphere cells treated with 5-FU or EPB. Data are expressed as the mean ± standard error of the mean and are representative of three independent experiments. **P<0.01 and ***P<0.001 vs. parental cell line. 5-FU, fluorouracil; EPB, epirubicin; FITC, fluorescein isthiocyanate.
Figure 3.
Figure 3.
Responses of HT29 and HCT116 sphere cells to 4HPR. (A) HT29 and HCT116 cells were seeded in sphere-forming conditions with and without 3 µM 4HPR for 5 days, and the spheres were photographed using an inverted microscope (magnification ×10). The bar chart indicates the sphere-forming rate of HT29 cells in serum-free medium. (B) Representative dot plots revealing the apoptotic status of HT29 and HCT116 sphere cells. Cells were treated with 3 µM 4HPR for 48 h. (C) Percentage of CD44+ cells in HT29 cells treated with or without 3 µm 4HPR for 48 h. Representative dot plots revealing the percentage of CD44+ cells. Data are expressed as the mean ± standard error of the mean and are representative of at least three independent experiments. **P<0.01 vs. Con. 4HPR, fenretinide; CD44, cluster of differentiation 44; Con, control; FITC, fluorescein isthiocyanate.
Figure 4.
Figure 4.
Transcriptome profiles of HT29 enriched sphere cells and parental cells treated with 4HPR. (A) Illustration of transcriptome changes using a Component Plane Presentation, Self-Organizing Map. Each presentation illustrates a sample-specific change, in which the upregulated genes (represented in red), downregulated genes (represented in blue), and moderately regulated genes (represented in yellow and green) are well delineated. The color bar indicates the expression values (log ratio in base 2), and brighter colors indicate higher values. (B) The numbers of regulated genes that were selected based on a 2-fold change threshold in each sample are depicted. (C) Heat map of the microarray data revealing the expression levels of these selected genes. (D) GO and Database for Annotation, Visualization and Integrated Discovery analysis of the selected genes. (E) Heat maps of significant GO clusters, revealing the specific changes in gene regulation. 4HPR, fenretinide; GO, gene oncology; Con, control.
Figure 5.
Figure 5.
Analysis of the cell cycle, cell cycle-associated genes, and stress response-associated genes. (A) Cell cycle analysis of HCT116 and HT29 sphere cells, assessed using flow cytometry, following treatment with 3 µM 4HPR for 24 h. The values are expressed as the mean ± standard deviation (n=3). (B) Reverse transcription-quantitative polymerase chain reaction analysis of the expression of cell cycle-associated genes, and stress response-associated genes. 4HPR, fenretinide; Con, control; CCNE2, cyclin E2; CDC25A, cell division cycle 25A; E2F8, E2F transcription factor 8; BRCA2, BRCA2, DNA repair associated; CCNA2, cyclin A2; SESN2, sestrin 2; TGM2, transglutaminase 2; HERPUD1, homocysteine inducible ER protein with ubiquitin like domain 1; CLGN, calmegin.

References

    1. Siegel R, Naishadham D, Jemal A. Cancer statistics, 2013. CA Cancer J Clin. 2013;63:11–30. doi: 10.3322/caac.21166. - DOI - PubMed
    1. Scopelliti A, Cammareri P, Catalano V, Saladino V, Todaro M, Stassi G. Therapeutic implications of cancer initiating cells. Expert Opin Biol Ther. 2009;9:1005–1016. doi: 10.1517/14712590903066687. - DOI - PubMed
    1. Ricci-Vitiani L, Lombardi DG, Pilozzi E, Biffoni M, Todaro M, Peschle C, De Maria R. Identification and expansion of human colon-cancer-initiating cells. Nature. 2007;445:111–115. doi: 10.1038/nature05384. - DOI - PubMed
    1. Hanahan D, Weinberg RA. Hallmarks of cancer: The next generation. Cell. 2011;144:646–674. doi: 10.1016/j.cell.2011.02.013. - DOI - PubMed
    1. Todaro M, Francipane MG, Medema JP, Stassi G. Colon cancer stem cells: Promise of targeted therapy. Gastroenterology. 2010;138:2151–2162. doi: 10.1053/j.gastro.2009.12.063. - DOI - PubMed