

Modeled state-level estimates of hypertension prevalence and undiagnosed hypertension among US adults during 2013-2015
- PMID: 30251346
- PMCID: PMC8031025
- DOI: 10.1111/jch.13388
Modeled state-level estimates of hypertension prevalence and undiagnosed hypertension among US adults during 2013-2015
Abstract
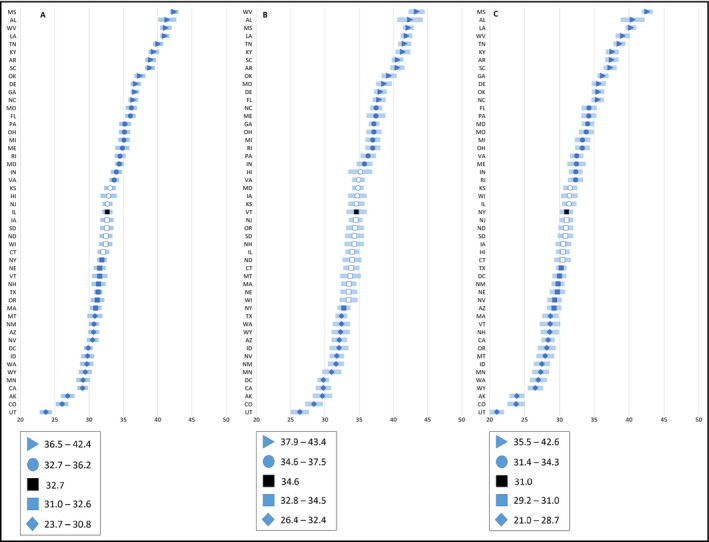
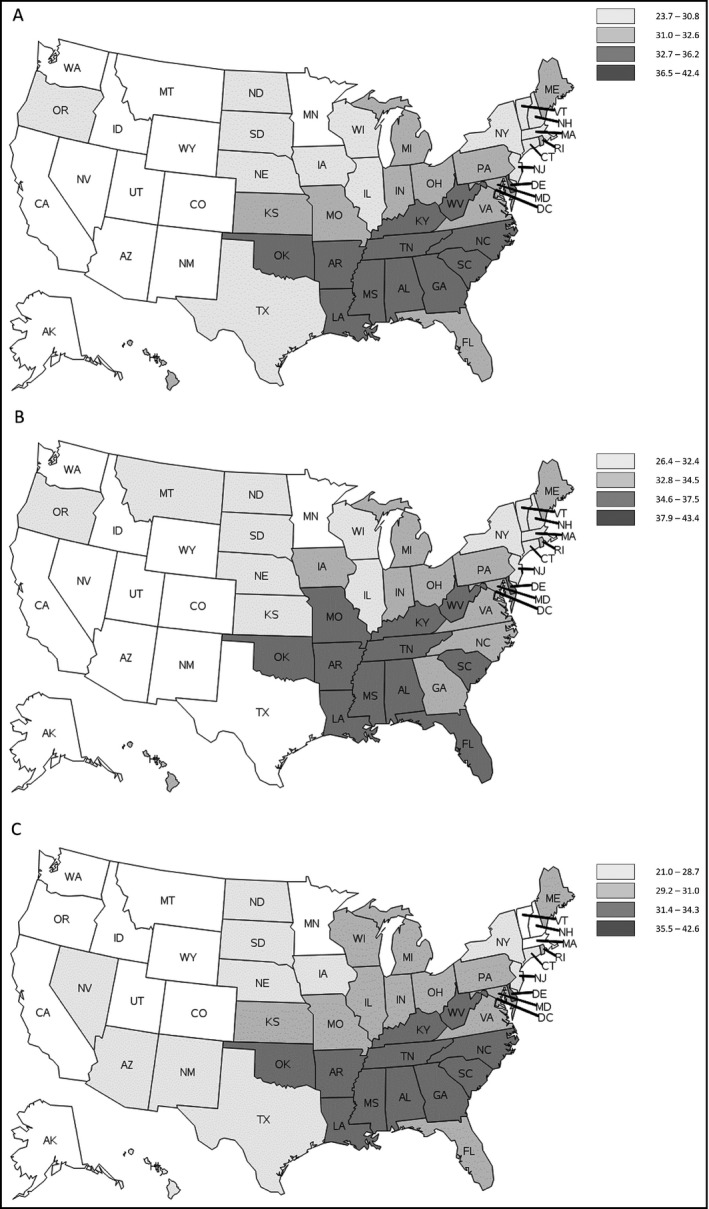
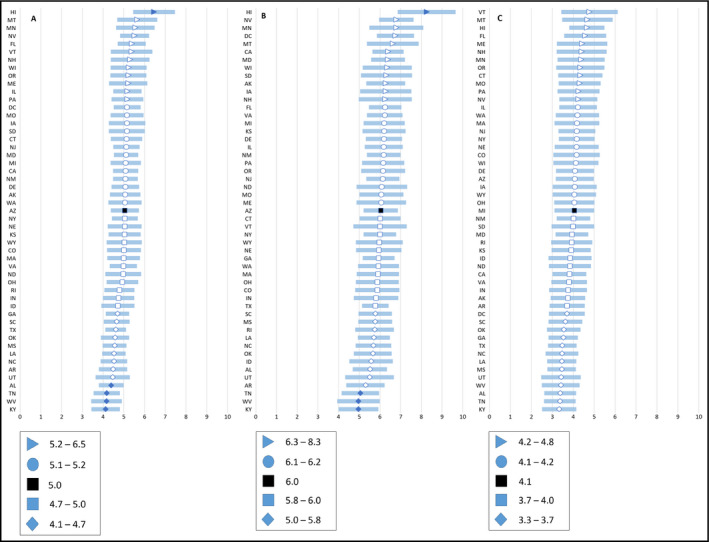
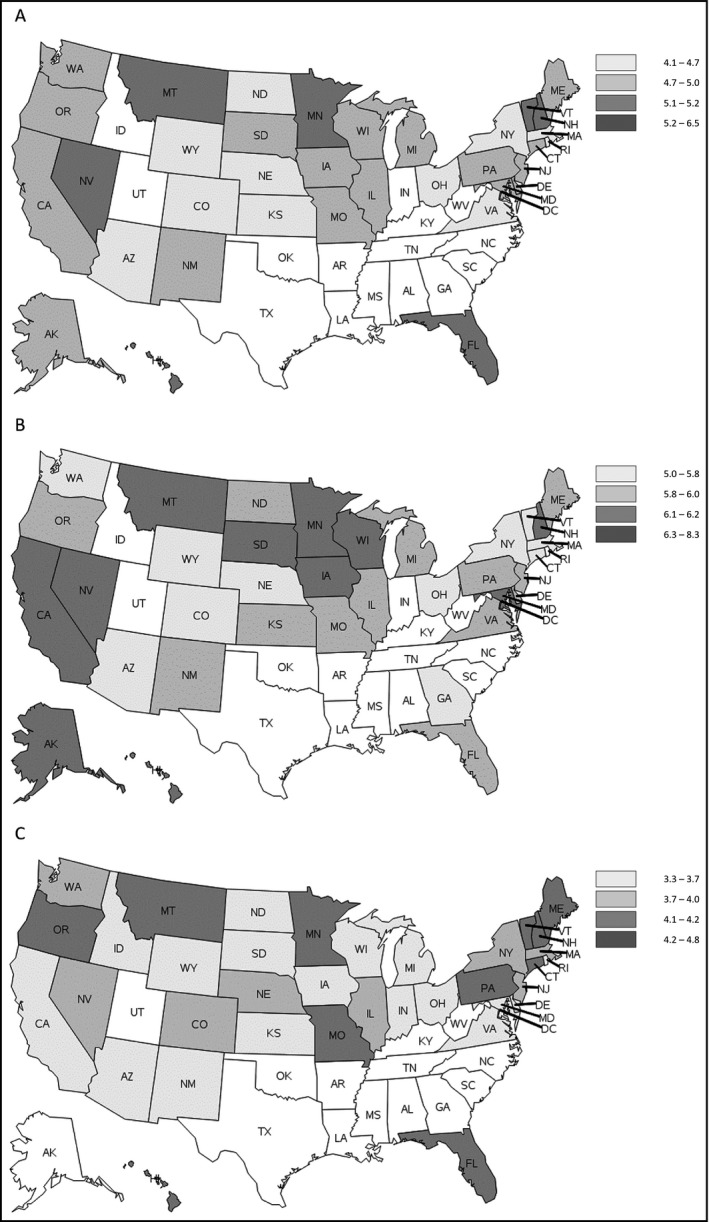
Hypertension affects about one in three US adults, from recent surveillance, or four in nine based on the 2017 ACC/AHA Hypertension Guideline; about half of them have their blood pressure controlled, and nearly one in six are unaware of their hypertension status. National estimates of hypertension awareness, treatment, and control in the United States are traditionally based on measured BP from National Health and Nutrition Examination Survey (NHANES); however, at the state level, only self-reported hypertension awareness and treatment are available from BRFSS. We used national- and state-level representative samples of adults (≥20 years) from NHANES 2011-2014 and BRFSS 2013 and 2015, respectively. The authors generated multivariable logistic regression models using NHANES to predict the probability of hypertension and undiagnosed hypertension and then applied the fitted model parameters to BRFSS to generate state-level estimates. The predicted prevalence of hypertension was highest in Mississippi among adults (42.4%; 95% CI: 41.8-43.0) and among women (42.6%; 41.8-43.4) and highest in West Virginia among men (43.4%; 42.2-44.6). The predicted prevalence was lowest in Utah 23.7% (22.8-24.6), 26.4% (25.0-27.7), and 21.0% (20.0-22.1) for adults, men, and women, respectively. Hypertension predicted prevalence was higher in most Southern states and higher among men than women in all states except Mississippi and DC. The predicted prevalence of undiagnosed hypertension ranged from 4.1% (3.4-4.8; Kentucky) to 6.5% (5.5-7.5; Hawaii) among adults, from 5.0% (4.0-5.9; Kentucky) to 8.3% (6.9-9.7; Hawaii) among men, and from 3.3% (2.5-4.1; Kentucky) to 4.8% (3.4-6.1; Vermont) among women. Undiagnosed hypertension was more prevalent among men than women in all states and DC.
Keywords: blood pressure; hypertension; prevalence; state-level; undiagnosed hypertension; variance.
Published 2018. This article is a U.S. Government work and is in the public domain in the USA.
Conflict of interest statement
The authors report no conflict of interests.
Figures
Similar articles
-
Trends and cardiovascular mortality effects of state-level blood pressure and uncontrolled hypertension in the United States.Circulation. 2008 Feb 19;117(7):905-14. doi: 10.1161/CIRCULATIONAHA.107.732131. Epub 2008 Feb 11. Circulation. 2008. PMID: 18268146
-
Surveillance of certain health behaviors and conditions among states and selected local areas--Behavioral Risk Factor Surveillance System (BRFSS), United States, 2006.MMWR Surveill Summ. 2008 Aug 15;57(7):1-188. MMWR Surveill Summ. 2008. PMID: 18701879
-
State-specific prevalence of selected chronic disease-related characteristics--Behavioral Risk Factor Surveillance System, 2001.MMWR Surveill Summ. 2003 Aug 22;52(8):1-80. MMWR Surveill Summ. 2003. PMID: 14532868
-
National surveillance definitions for hypertension prevalence and control among adults.Circ Cardiovasc Qual Outcomes. 2012 May;5(3):343-51. doi: 10.1161/CIRCOUTCOMES.111.963439. Epub 2012 May 1. Circ Cardiovasc Qual Outcomes. 2012. PMID: 22550130 Free PMC article. Review.
-
Surveillance of Hypertension Among Women of Reproductive Age: A Review of Existing Data Sources and Opportunities for Surveillance Before, During, and After Pregnancy.J Womens Health (Larchmt). 2021 Apr;30(4):466-471. doi: 10.1089/jwh.2020.8977. Epub 2021 Jan 15. J Womens Health (Larchmt). 2021. PMID: 33450166 Free PMC article. Review.
Cited by
-
Discrepancy in Metabolic Dysfunction-Associated Steatotic Liver Disease Prevalence in a Large Northern California Cohort.Gastro Hep Adv. 2025 Jan 28;4(5):100630. doi: 10.1016/j.gastha.2025.100630. eCollection 2025. Gastro Hep Adv. 2025. PMID: 40371233 Free PMC article.
-
Machine learning models identify micronutrient intake as predictors of undiagnosed hypertension among rural community-dwelling older adults in Thailand: a cross-sectional study.Front Nutr. 2024 Jul 16;11:1411363. doi: 10.3389/fnut.2024.1411363. eCollection 2024. Front Nutr. 2024. PMID: 39081680 Free PMC article.
-
Undiagnosed status and associated factors of hypertension among adults living in rural of central, Ethiopia, 2020: Uncovering the hidden magnitude of hypertension.PLoS One. 2022 Dec 15;17(12):e0277709. doi: 10.1371/journal.pone.0277709. eCollection 2022. PLoS One. 2022. PMID: 36520859 Free PMC article.
-
Prevalence of Undiagnosed Hypertension and Its Predictors in Jordan: A Cross-Sectional Study.Int J Gen Med. 2022 Oct 25;15:7919-7928. doi: 10.2147/IJGM.S388121. eCollection 2022. Int J Gen Med. 2022. PMID: 36317098 Free PMC article.
-
Partnering for Integrated Care: A Learning Collaborative for Primary Care and Oral Health Teams.Ann Fam Med. 2023 Feb;21(Suppl 2):S22-S30. doi: 10.1370/afm.2918. Ann Fam Med. 2023. PMID: 36849470 Free PMC article.
References
-
- Yoon SS, Fryar CD, Carroll MD. Hypertension prevalence and control among adults: United States, 2011–2014. NCHS data brief, no 220. Hyattsville, MD: National Center for Health Statistics; 2015. - PubMed
-
- Merai R, Siegel C, Rakotz M, et al. CDC grand rounds: a public health approach to detect and control hypertension. MMWR Morb Mortal Wkly Rep. 2016;65:1261‐1264. - PubMed
-
- Guo F, He D, Zhang W, Walton RG. Trends in prevalence, awareness, management, and control of hypertension among United States adults, 1999 to 2010. JACC. 2012;60(7):599‐606. - PubMed
MeSH terms
LinkOut - more resources
Full Text Sources
Other Literature Sources
Medical
