. 2018 Nov;1864(11):3605-3617.
doi: 10.1016/j.bbadis.2018.08.024. Epub 2018 Aug 18.

Role of p38γ MAPK in regulation of EMT and cancer stem cells

Affiliations

Role of p38γ MAPK in regulation of EMT and cancer stem cells

Mei Xu et al. Biochim Biophys Acta Mol Basis Dis. 2018 Nov.

Abstract

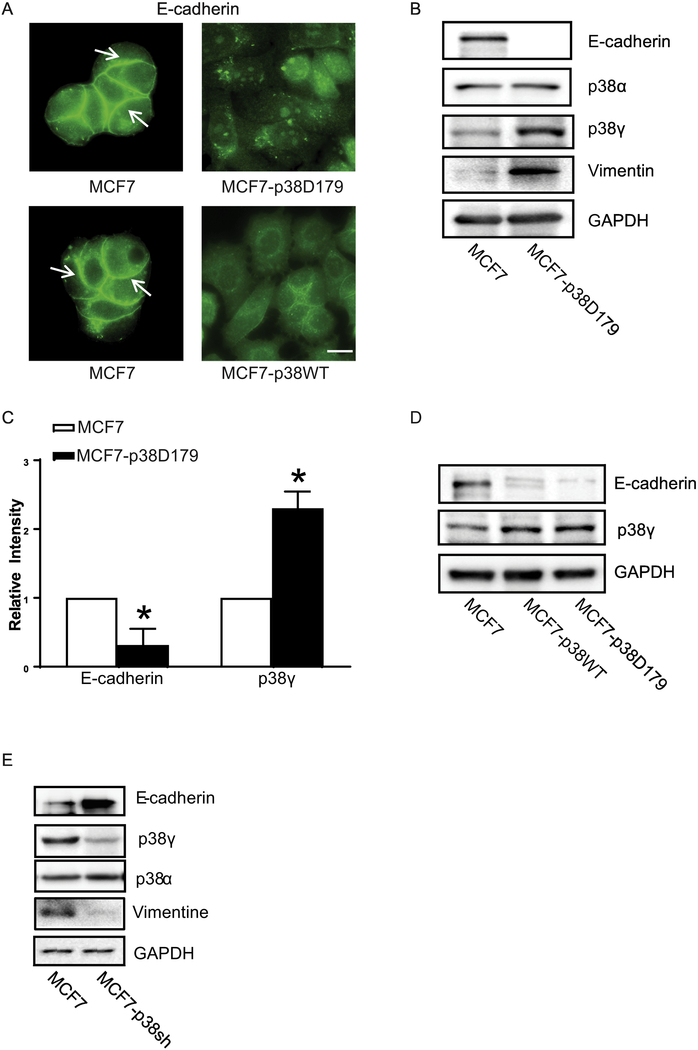
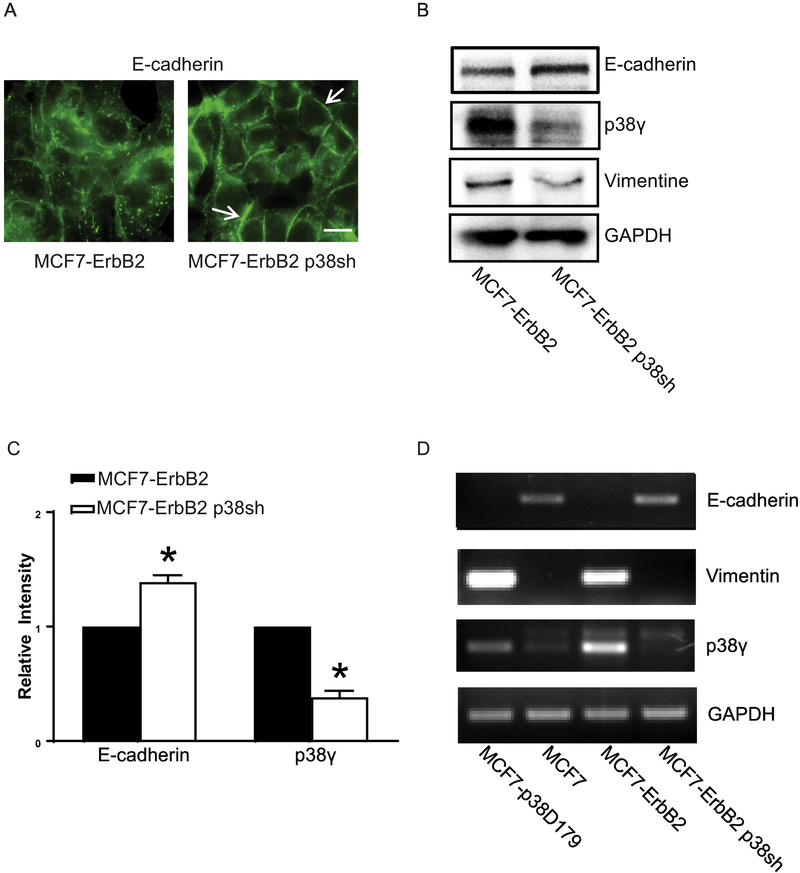
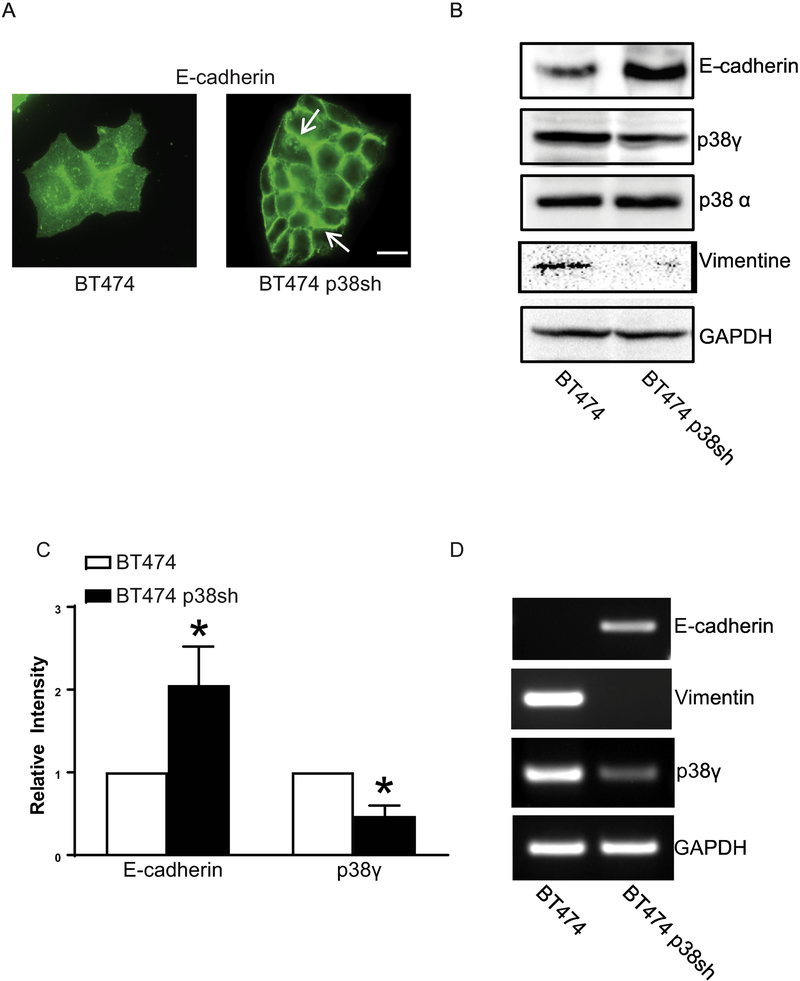
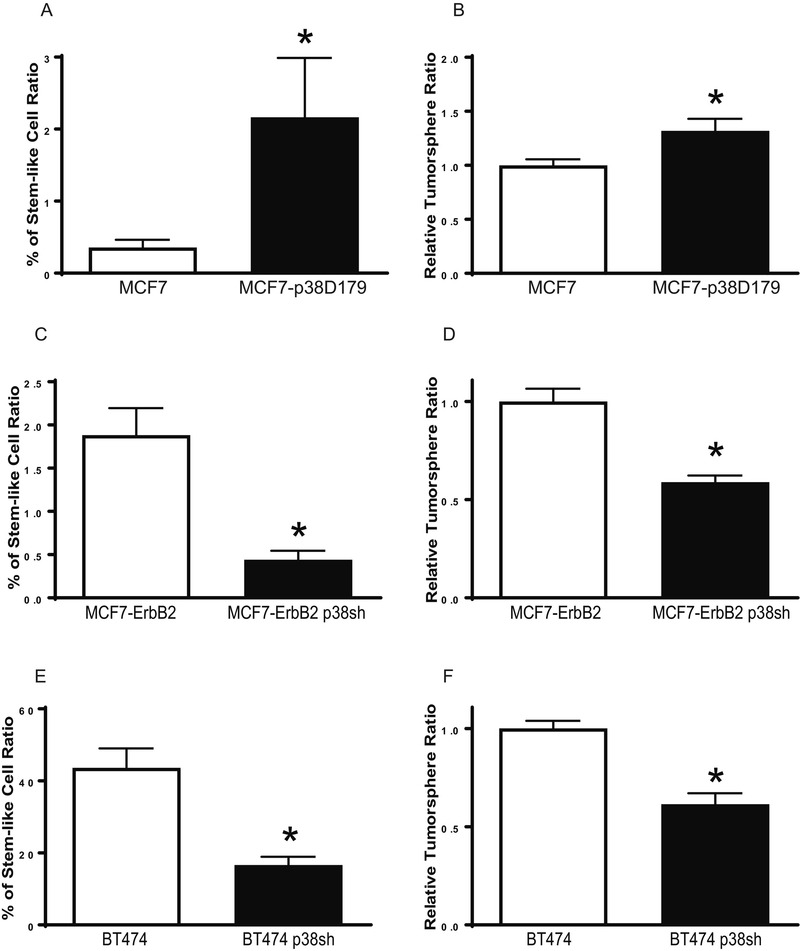
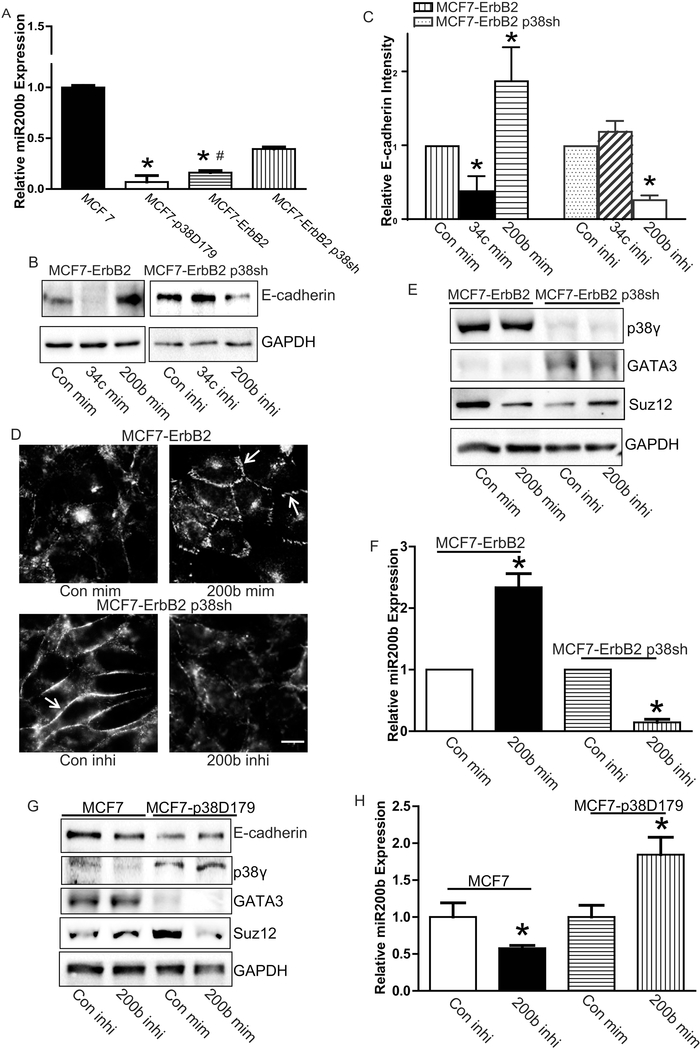
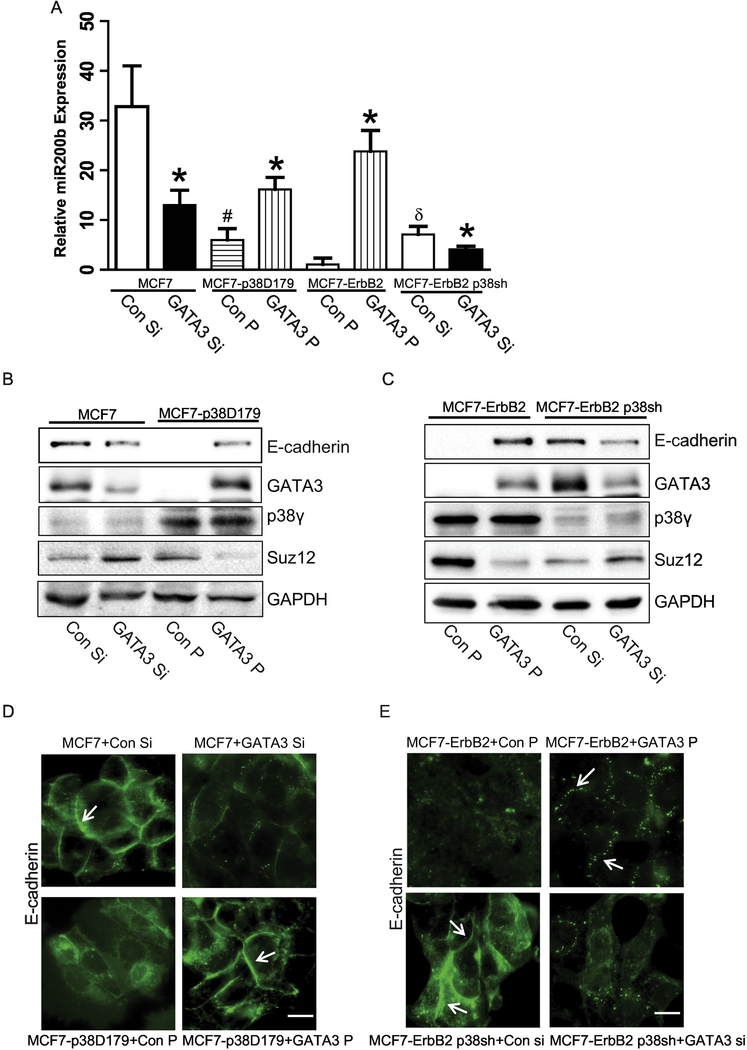
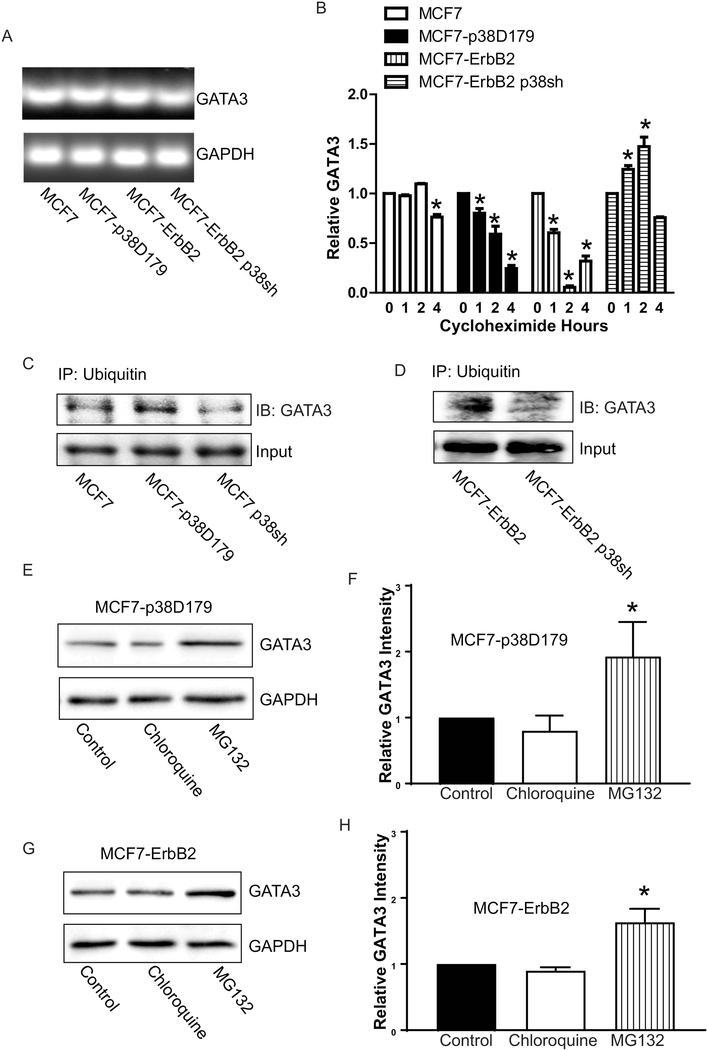
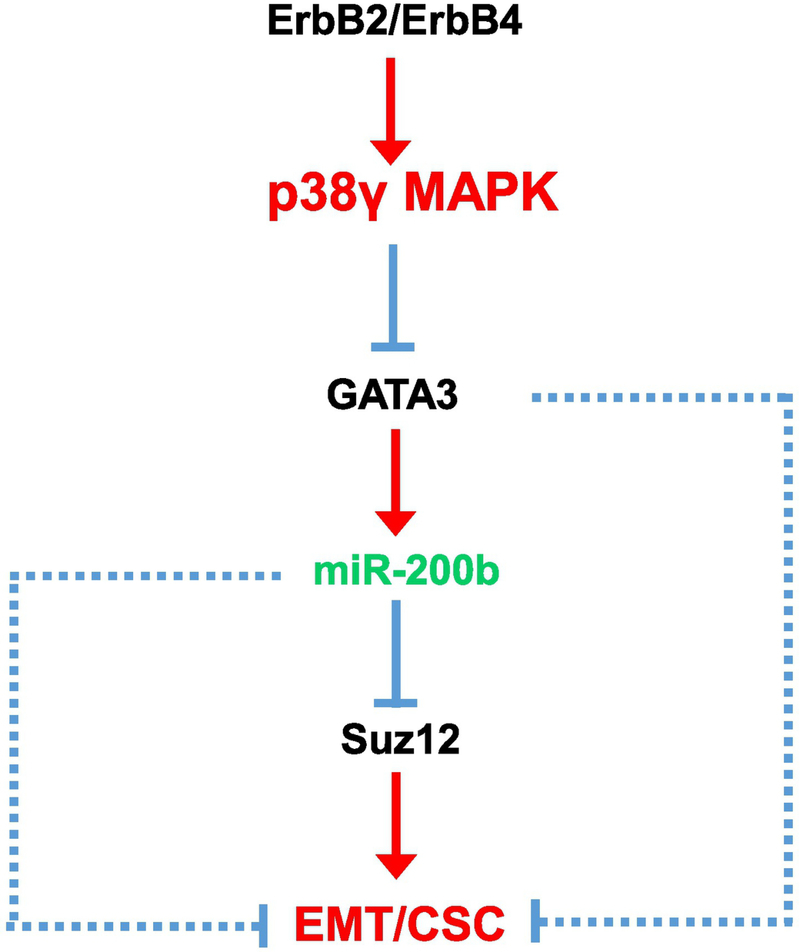
p38γ is a member of p38 MAPK family which contains four isoforms p38α, p38β, p38γ, and p38δ. p38γ MAPK has unique function and is less investigated. Recent studies revealed that p38γ MAPK may be involved in tumorigenesis and cancer aggressiveness. However, the underlying cellular/molecular mechanisms remain unclear. Epithelial-mesenchymal transition (EMT) is a process that epithelial cancer cells transform to facilitate the loss of epithelial features and gain of mesenchymal phenotype. EMT promotes cancer cell progression and metastasis, and is involved in the regulation of cancer stem cells (CSCs) which have self-renewal capacity and are resistant to chemotherapy and target therapy. We showed that p38γ MAPK significantly increased EMT in breast cancer cells; over-expression of p38γ MAPK enhanced EMT while its down-regulation inhibited EMT. Meanwhile, p38γ MAPK augmented CSC population while knock down of p38γ MAPK decreased CSC ratio in breast cancer cells. MicroRNA-200b (miR-200b) was down-stream of p38γ MAPK and inhibited by p38γ MAPK; miR-200b mimics blocked p38γ MAPK-induced EMT while miR-200b inhibitors promoted EMT. p38γ MAPK regulated miR-200b through inhibiting GATA3. p38γ MAPK induced GATA3 ubiquitination, leading to its proteasome-dependent degradation. Suz12, a Polycomb group protein, was down-stream of miR-200b and involved in miR-200b regulation of EMT. Thus, our study established an important role of p38γ MAPK in EMT and identified a novel signaling pathway for p38γ MAPK-mediated tumor promotion.

Keywords: Cancer stem cells; Metastasis; MicroRNA; p38γ MAPK.


Conflict of interest statement

Conflict of interest

The authors declare that they have no competing interests.

Figures

Figure 1.
Figure 1.
Effect of p38γ MAPK on EMT in breast cancer cells. MCF7 cells were stably transfected with either WT p38γ MAPK (MCF7-p38WT) or the active form of p38γ MAPK (MCF7-p38D179) plasmids as described in the Materials and Methods. A: MCF7 and MCF7-p38D179 cells were cultured on coverslips. The expression of E-cadherin was detected by immunofluorescent staining as described in the Materials and Methods. Arrows indicate the E-cadherin on the cell borders. Bar = 20 μM. B and D: Cell lysates of MCF7, MCF7-p38WT or MCF7-p38D179 were collected and the expression of EMT markers (E-cadherin and Vimentin), and p38γ MAPK was analyzed by immunoblotting. GAPDH served as a loading control. C: The expression of E-cadherin and p38γ MAPK was quantified and normalized to the expression of GAPDH. The experiment was replicated at least three time. * denote significant difference from MCF7 cells, p < 0.05. E: MCF7 cells stably expressing control shRNA (MCF7) and p38γ MAPK shRNA (MCF7-p38sh) were established as described in the Materials and Methods. The expression of E-cadherin, Vimentin, p38γ and p38α MAPK was examined with immunoblotting.
Figure 2.
Figure 2.
Effect of p38γ MAPK on EMT in MCF7 cells over-expressing ErbB2. MCF7 cells over-expressing ErbB2 were stably transfected with control shRNA (MCF7-ErbB2) and p38γ MAPK shRNA (MCF7-ErbB2 p38sh) as described in the Methods. A: Cells were cultured on coverslips. The expression of E-cadherin was detected by immunofluorescent staining as described under the Materials and Methods. Arrows indicate the E-cadherin on the cell borders. Bar = 20 μM. B: Cell lysates of MCF7-ErbB2 and MCF7-ErbB2 p38sh cells were collected and the expression of EMT markers (Ecadherin and Vimentin), p38γ MAPK was analyzed by immunoblotting. GAPDH served as a loading control. C: The expression of E-cadherin and p38γ MAPK was quantified and normalized to the expression of GAPDH. The experiment was replicated at least three time. * denote significant difference from MCF7-ErbB2 cells, p < 0.05. D: The mRNA levels of E-cadherin, Vimentin, and p38γ MAPK in MCF7, MCF7-p38D179, MCF7-ErbB2 and MCF7-ErbB2 p38sh cells were examined by RT-PCR. The mRNA level of GAPDH was used as a loading control.
Figure 3.
Figure 3.
Effect of p38γ MAPK on EMT in BT474 breast cancer cells. BT474 breast cancer cells were stably transfected with control shRNA (BT474) and p38γ shRNA (BT474 p38sh). A: The expression of E-cadherin was detected by immunofluorescent staining. Arrows indicate the E-cadherin on the cell borders. Bar = 20 μM. B: Cell lysates of BT474 and BT474 p38sh cells were collected and the expression of Ecadherin, Vimentin, p38γ, p38α MAPK, and GAPDH was analyzed by immunoblotting. C: The expression of E-cadherin and p38γ MAPK was quantified and normalized to the expression of GAPDH. The experiment was replicated at least three time. * denote significant difference from BT474 cells, p < 0.05. D: The mRNA levels of E-cadherin, Vimentin, and p38γ MAPK in BT474 and BT474 p38sh cells were analyzed by RT-PCR. The mRNA level of GAPDH was used as a loading control.
Figure 4.
Figure 4.
Effect of p38γ MAPK on CSCs and tumorsphere formation in breast cancer cells. A: MCF7 and MCF7-p38D179 cells were processed for ALDEFLUOR assay, followed by flow cytometry for the detection of CSCs. CSC population was calculated as percentage of total cells population. Each data point was mean ± SEM of three independent experiments. * p<0.05, denotes significant difference from the control groups. B: Cells (1,000 cells) were cultured on ultra-low attachment plates for assaying tumorsphere formation as described in the Materials and Methods. The number of tumorspheres was counted and calculated relative to MCF7 cells. Each data point was the mean ± SEM of three independent experiments. * p<0.05, denotes significant difference from MCF7 cells. C and D: MCF7-ErbB2 and MCF7-ErbB2 p38sh cells were analyzed for CSCs and tumorsphere formation as described above. * p < 0.05, denotes significant difference from MCF7- ErbB2 cells. E and F: BT474 and BT474 p38sh cells were analyzed for CSCs and tumorsphere formation as described above. * p < 0.05, denotes significant difference from BT474 cells.
Figure 5.
Figure 5.
p38γ MAPK and miR-200b in their regulation of E-cadherin. A: The expression of miR-200b in MCF7, and MCF7-p38D179, MCF7-ErbB2 and MCF7-ErbB2 p38sh cells was analyzed by real-time PCR as described in the Materials and Methods. Each data point was the mean ± SEM of three independent experiments. p< 0.05, * denotes significant difference from MCF7 cells. # denotes significant difference from MCF7-ErbB2 p38shCon Si. B: MCF7-ErbB2 and MCF7-ErbB2 p38sh cells were treated with either controls or mimics/inhibitors for miR-200b or miR-34c (con mim, con inhi,200b mim, 34c mim, 200b inhi or 34c inhi) as described in the Materials and Methods. After 48 hours, E-cadherin levels were analyzed by immunoblotting. C: The expression of E-cadherin was quantified and normalized to the expression of GAPDH. The experiment was replicated at least three time. * denote significant difference from con min or con inhi, p < 0.05. D: MCF7-ErbB2 and MCF7-ErbB2 p38sh cells were treated with miR-200b mimics or inhibitor for 48 hours, then the expression of E-cadherin was detected by immunofluorescent staining. Arrows indicate the E-cadherin on the cell borders. Bar = 20 μM. E: The protein levels of p38γ MAPK, GATA3, and Suz12 were determined by immunoblotting. F: The relative miR-200b levels were determined by real-time PCR. G: MCF7 or MCF7-p38D179 cells were treated with either miRNA-200b inhibitor (200b inhi) or mimics (200b mim) for 48 hours. The expression of E-cadherin, p38γ MAPK, GATA3, Suz12, and GAPDH was examined by immunoblotting. The experiments were replicated three times. H: The relative expression of miRNA-200b was determined by real-time PCR. Each data point was the mean ± SEM of three independent experiments *p < 0.05, denotes significant difference from respective controls.
Figure 6.
Figure 6.
Effect of GATA3 on the expression of E-cadherin and miRNA-200b in breast cancer cells. MCF7 or MCF7-ErbB2 p38sh cells were transiently transfected with GATA3 siRNA for 48 hours. MCF7-p38D179 or MCF7-ErbB2 cells were transfected with GATA3 plasmid for 48 hours. A: The relative levels of miR-200b were determined by real-time PCR. Each data point was the mean ± SEM of three independent experiments. p< 0.05, * denotes significant difference from match controls. # denotes significant difference from MCF7 Con Si. δ is significant difference from MCF7-ErbB2 Con P. B and C: The expression of E-cadherin, GATA3, p38γ MAPK, Suz12, and GAPDH in MCF7, MCF7-p38D179, MCF7-ErbB2, and MCF7-ErbB2 p38sh cells transfected with either GATA3 siRNA or GATA3 plasmid was examined by immunoblotting analysis. D and E: The expression of E-cadherin was examined by immunofluorescent staining. Arrows indicated E-cadherin on the cell borders. Arrows indicate the E-cadherin on the cell borders. Bar = 20 μM. The experiments were replicated three times.
Figure 7.
Figure 7.
Effect of p38γ MAPK GATA3 expression. A: mRNA levels of GATA3 in MCF7, MCF7-p38D179, MCF7-ErbB2 and MCF7-ErbB2 p38sh cells were determined by PCR. B: Changes in the protein levels of GATA3 over a course of time after cycloheximide (50 μg/ml) treatments were determined by immunoblotting. *denotes significant difference from 0 hours. C and D: The cell lysates from MCF7, MCF7-p38D179, MCF7 p38sh, MCF7-ErbB2, and MCF7-ErbB2 p38sh were immunoprecipitated with an antiubiquitin antibody, and then analyzed for GATA3 expression by immunoblotting. E and G: MCF7-p38D179 and MCF7-ErbB2 cells treated with either lysosome inhibitor (chloroquine, 100 μM)) or proteasome inhibitor (MG132, 10 μM) for 6 hours. The expression of GATA3 was then analyzed by immunoblotting. F and H: The expression of GATA3 was quantified and normalized to the expression of GAPDH. The experiment was replicated at least three time. * denote significant difference from respective controls, p < 0.05.
Figure 8.
Figure 8.
Signaling pathway for p38γ MAPK-promoted EMT. p38γ MAPK is activated by its upstream receptor kinases, such as ErbB2 and ErbB4 [4, 5, 57]. The activation of p38γ MAPK destabilizes GATA3 by ubiquitin-proteasome-dependent degradation. Decreased levels of GATA3 causes the down-regulation of miR-200b, a negative regulator of Suz12. Suz12 is a promoter of EMT and CSC in breast cancer cells; therefore, down-regulation of miR-200b may promote EMT and CSC through the induction of Suz12. Alternatively, GATA3 may promote EMT and CSC through other miRNAs or unknown mechanisms (dotted lines)[–50]. miR-200b could also promote EMT in breast cancer cells through mechanisms independent of Suz12 (dotted lines) [46].

Similar articles

Cited by

References

    1. Escós A, Risco A, Alsina-Beauchamp D, Cuenda A, p38γ and p38δ mitogen activated protein kinases (MAPKs), new stars in the MAPK galaxy, Frontiers in cell and developmental biology, 4 (2016) 31. - PMC - PubMed
    1. Meng F, Wu G, Is p38γ MAPK a metastasis-promoting gene or an oncogenic property-maintaining gene?, Cell Cycle, 12 (2013) 2329–2330. - PMC - PubMed
    1. Qi X, Yin N, Ma S, Lepp A, Tang J, Jing W, Johnson B, Dwinell MB, Chitambar CR, Chen G, p38γ MAPK Is a Therapeutic Target for Triple‐Negative Breast Cancer by Stimulation of Cancer Stem‐Like Cell Expansion, Stem cells, 33 (2015) 2738–2747. - PMC - PubMed
    1. Xu M, Ren Z, Wang X, Comer A, Frank JA, Ke Z.-j., Huang Y, Zhang Z, Shi X, Wang S, ErbB2 and p38γ MAPK mediate alcohol-induced increase in breast cancer stem cells and metastasis, Molecular cancer, 15 (2016) 52. - PMC - PubMed
    1. Xu M, Wang S, Ren Z, Frank JA, Yang XH, Zhang Z, Ke ZJ, Shi X, Luo J, Chronic ethanol exposure enhances the aggressiveness of breast cancer: the role of p38gamma, Oncotarget, 7 (2016) 3489–3505. - PMC - PubMed

Publication types

MeSH terms

LinkOut - more resources