. 2018 Nov;1864(11):3708-3722.
doi: 10.1016/j.bbadis.2018.09.002. Epub 2018 Sep 6.

CoQ10 supplementation rescues nephrotic syndrome through normalization of H2S oxidation pathway

Affiliations

CoQ10 supplementation rescues nephrotic syndrome through normalization of H2S oxidation pathway

Giulio Kleiner et al. Biochim Biophys Acta Mol Basis Dis. 2018 Nov.

Abstract

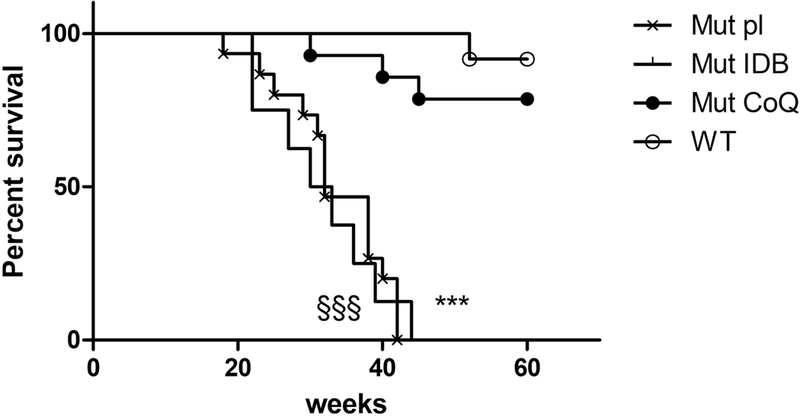
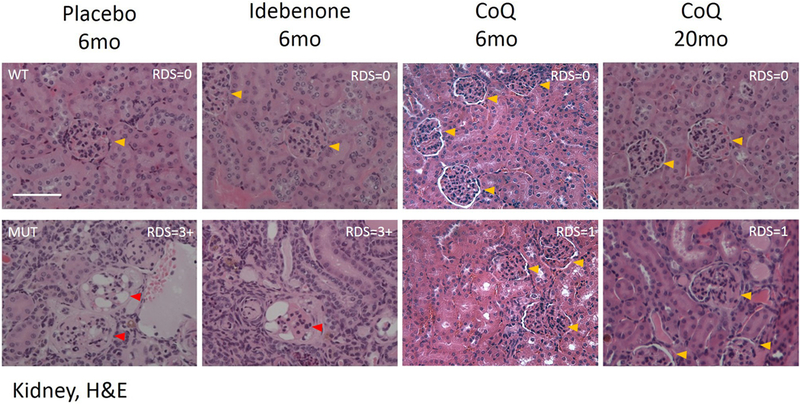
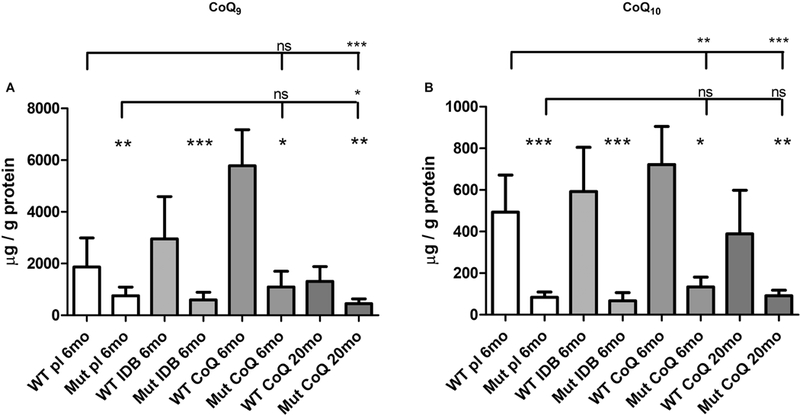
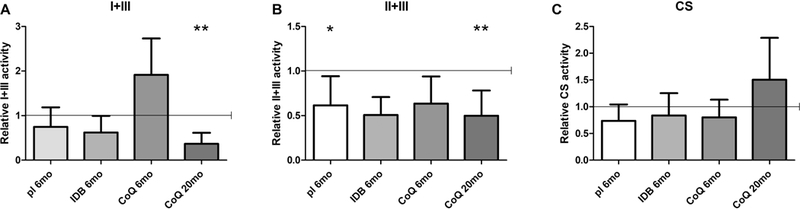
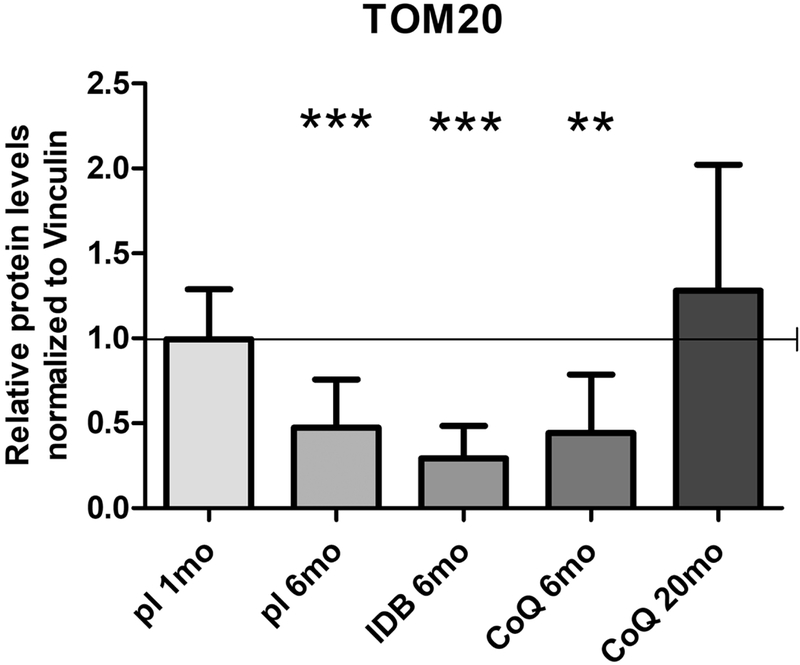
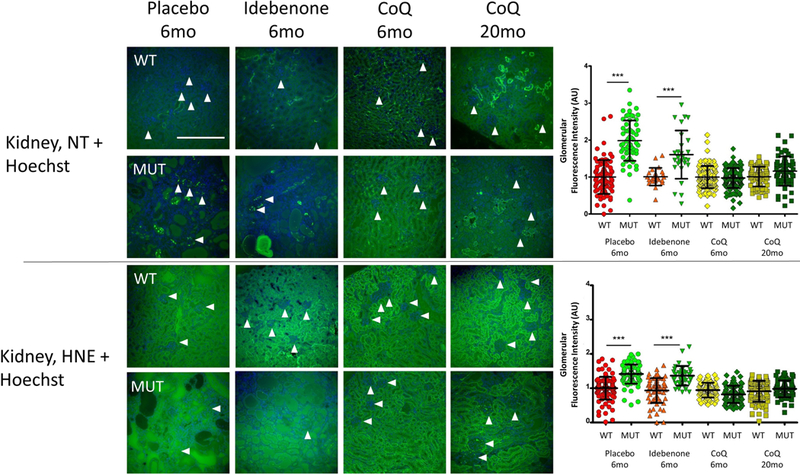
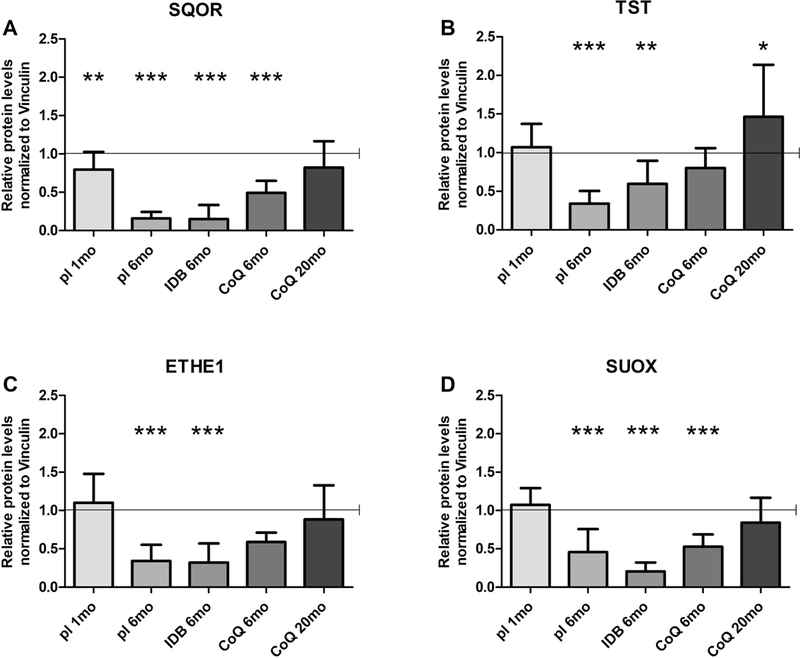
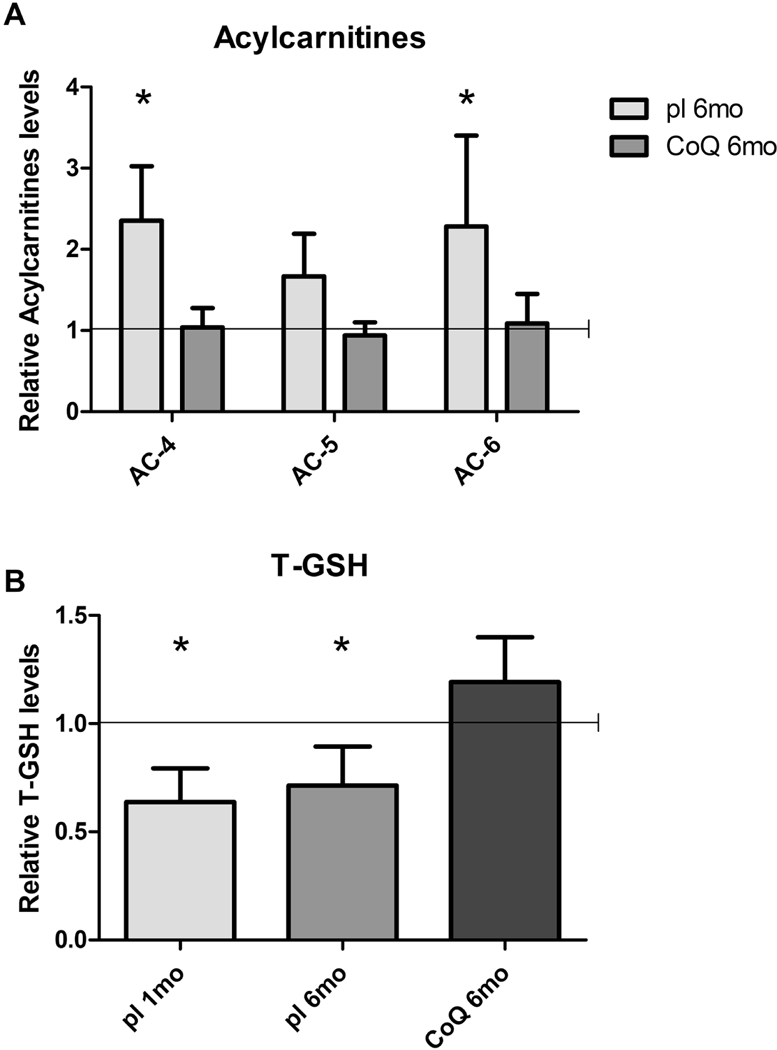
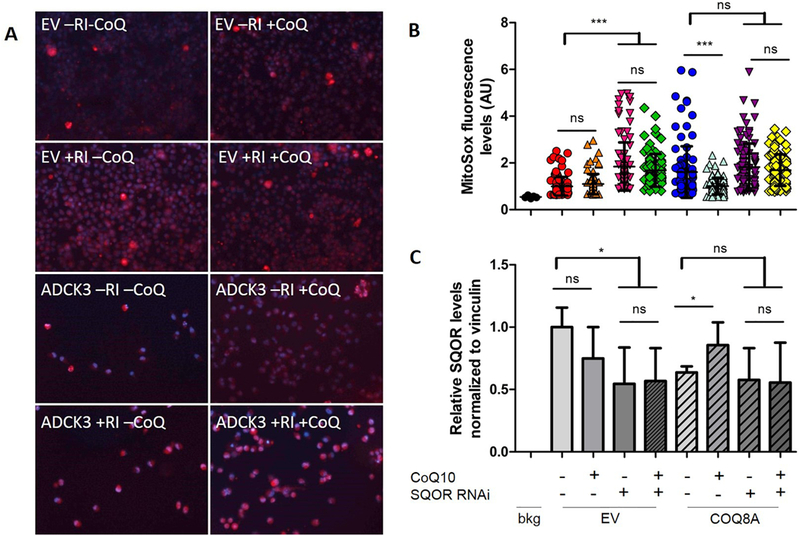
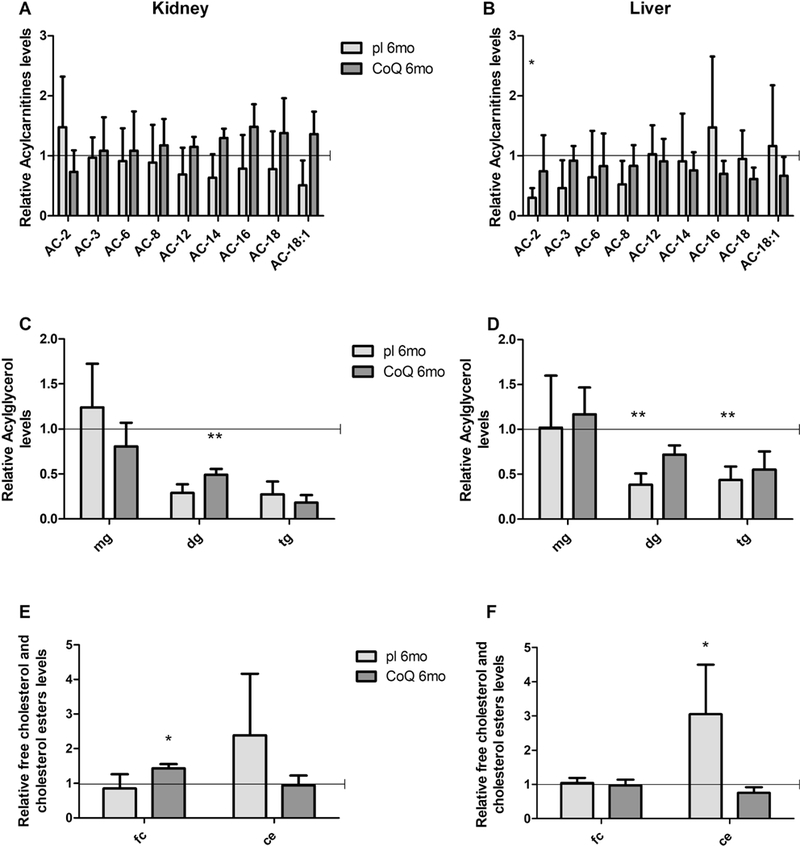
Nephrotic syndrome (NS), a frequent chronic kidney disease in children and young adults, is the most common phenotype associated with primary coenzyme Q10 (CoQ10) deficiency and is very responsive to CoQ10 supplementation, although the pathomechanism is not clear. Here, using a mouse model of CoQ deficiency-associated NS, we show that long-term oral CoQ10 supplementation prevents kidney failure by rescuing defects of sulfides oxidation and ameliorating oxidative stress, despite only incomplete normalization of kidney CoQ levels and lack of rescue of CoQ-dependent respiratory enzymes activities. Liver and kidney lipidomics, and urine metabolomics analyses, did not show CoQ metabolites. To further demonstrate that sulfides metabolism defects cause oxidative stress in CoQ deficiency, we show that silencing of sulfide quinone oxido-reductase (SQOR) in wild-type HeLa cells leads to similar increases of reactive oxygen species (ROS) observed in HeLa cells depleted of the CoQ biosynthesis regulatory protein COQ8A. While CoQ10 supplementation of COQ8A depleted cells decreases ROS and increases SQOR protein levels, knock-down of SQOR prevents CoQ10 antioxidant effects. We conclude that kidney failure in CoQ deficiency-associated NS is caused by oxidative stress mediated by impaired sulfides oxidation and propose that CoQ supplementation does not significantly increase the kidney pool of CoQ bound to the respiratory supercomplexes, but rather enhances the free pool of CoQ, which stabilizes SQOR protein levels rescuing oxidative stress.

Keywords: CoQ deficiency; Coenzyme Q(10); Mitochondria; Oxidative stress; Sulfides.


Conflict of interest statement

Conflict of interest statement

The authors have declared that no conflict of interest exists.

Figures

Fig. 1:
Fig. 1:. Survival curve in Pdss2kd/kd mice: CoQ10 supplementation significantly increases survival of mutant mice.
Mut Placebo vs WT: p<0.001, §§§; Mut IDB vs WT: p<0.001, *** (Mantel-Cox test). Mut placebo =15, Mut IDB = 8, Mut CoQ = 9, WT =15. Mut = mutant; IDB = Idebenone; CoQ = CoQ10; WT = wild type.
Fig. 2:
Fig. 2:. Kidney morphology: CoQ10 supplementation preserves kidney structure in Pdss2kd/kd mutant mice.
Representative images of H&E staining in kidney of wild-type (WT) and mutant (MUT) animals (N= 3 for group). RDS= Renal Damage Score. Yellow arrows indicate healthy glomeruli, red arrows indicate disrupted glomeruli. Magnification: 20×; CoQ = CoQ10; 6mo = 6 months old; 20mo = 20 months old, H&E = Hematoxylin - Eosin; scale bar = 100pm.
Fig. 3:
Fig. 3:. CoQ levels in kidney of Pdss2kd/kd mice: CoQ10 supplementation partially increases CoQ levels in 6 months-old mutant and wild-type mice.
Amount of CoQ9 (A) and CoQ10 (B). Data are represented as mean ± standard deviation (N = 7). Mutant mice (Mut) are compared to age -matched controls (WT) under same treatment (pl = placebo; CoQ = CoQ10; IDB = Idebenone); 6mo = 6 months old; 20mo = 20 months old. * = p<0.05, ** = p<0.01, *** = p<0.001, ns = not significant (Mann Whitney test).
Fig. 4:
Fig. 4:. CoQ-dependent respiratory chain enzymes activities in kidney of Pdss2kd/kd mice: CoQ10 supplementation does not rescue mitochondrial respiratory chain function in mutant mice.
Complexes I+III (A), II+III (B) and citrate synthase (C) measured by spectrophotometric assay in kidney homogenates. Values are represented as fold changes of mutant mice (Mut) compared to age -matched controls (WT) under same treatment (pl = placebo; CoQ = CoQ10; IDB = Idebenone) (all set as 1, horizontal bar); CS = citrate synthase; I+II = complexes I+II; II+III = complexes II+III; 6mo = 6 months old; 20mo = 20 months old. Data are represented as mean ± standard deviation (N = 7 for group). * = p<0.05, ** = p<0.01 (Mann Whitney test).
Fig. 5:
Fig. 5:. Mitochondrial mass in kidney of Pdss2kd/kd mice: Decrease of mitochondrial mass is a secondary effect of CoQ10 deficiency.
The levels of TOM20 were normalized to vinculin and represented as fold changes of mutant mice (Mut) compared to age -matched controls (WT) under same treatment (pl = placebo; CoQ = CoQ10; IDB = Idebenone) (all set as 1, horizontal bar), 1mo = 1 month-old, 6mo = 6 months old; 20mo = 20 months old. Data are represented as mean ± standard deviation (N = 4 for group). ** = p<0.01, *** = p<0.001 (Mann Whitney test).
Fig. 6:
Fig. 6:. Oxidative stress in kidney of Pdss2kd/kd mice: CoQ10 supplementation improves oxidative stress.
Representative images of anti- Nitrotyrosine and anti Hydroxynonenal staining to detect protein and lipid oxidation, and Hoechst to detect nuclei in mutant and control animals (N=3 for group). White arrows indicate single glomeruli. Magnification: 20×; NT = Nitrotyrosine; HNE = 4 Hydroxynonenal; WT = wild type; Mut = mutant; CoQ = CoQ10; 6mo= 6 months old; 20 mo = 20 months old; scale bar = 100μm. The graphics show the fluorescence intensity in the glomeruli. Data are represented as scatter plot measurements of single glomeruli fluorescence after background subtraction. Bars represent Mean ± standard deviation. *** = p<0.001 (One-way ANOVA with Tukey Post test). A.U. = Arbitrary Unit.
Fig. 7:
Fig. 7:. Protein levels of the enzymes of the H2S oxidation pathway in kidney of Pdss2kd/kd mice: CoQ10 supplementation rescues H2S oxidation impairment.
Protein amounts of SQOR (A), TST (B) ETHE1 (C) and SQOX (D) normalized to vinculin and represented as fold changes of mutant mice (Mut) compared to age -matched controls (WT) under same treatment (pl = placebo; CoQ = CoQ10; IDB = Idebenone) (all set as 1, horizontal bar), 1mo = 1 month-old, 6mo = 6 months old; 20mo = 20 months old. Data are represented as mean ± standard deviation (N=5 per group). * = p<0.05, ** = p<0.01, *** = p<0.001 (Mann Whitney test).
Fig 8:
Fig 8:. Short-chain acylcarnitines in plasma and T-GSH in kidney of Pdss2kd/kd mice. CoQ10 supplementation rescues detrimental effects of H2S oxidation impairment.
Levels of C4, C5 and C6 acylcarnitines (A) and levels of total GSH (B) are represented as fold changes of mutant mice (Mut) compared to age -matched controls (WT) under same treatment (pl = placebo; CoQ = CoQ10) (all set as 1, horizontal bar), lmo = 1 month-old, 6mo = 6 months old, T-GSH = total glutathione. Data are represented as mean ± standard deviation (N=5 for group). * = p<0.05 (Mann-Whitney test).
Fig. 9:
Fig. 9:. Effects of CoQ10 supplementation on ROS levels in SQOR and COQ8A depleted Hela cells: SQOR knock-down causes increase of ROS in wild-type cells and prevents antioxidant effects of CoQ10 in COQ8A depleted cells.
Representative images of HeLa cells stained with MitoSOX (red signal) to detect ROS, and Hoechst (blue signal) to detect nuclei (A). Quantification of red staining intensity. Data are represented as mean ± standard deviation (99 total readings from 3 independent experiments), ns = not significant; *** = p<0.001 (One way ANOVA test) (B). Protein amounts of SQOR normalized to vinculin and represented as fold changes compared to untreated EV (C). Bkg = background; EV = empty vector; RI = SQOR RNA interference; CoQ = CoQ10.
Fig. 10:
Fig. 10:. Acylcarnitines, acylglycerols and cholesterols levels in kidney and liver of Pdss2kd/kd mice: CoQ deficiency leads to fatty acids and cholesterol metabolism alterations.
Levels of acylcarnitines (A, B), acylglycerols (C, D) free cholesterol and cholesterol esters (E, F) in kidney (A, C, E) and liver (B, D, F) are represented as fold changes of mutant mice (Mut) compared to age -matched controls (WT) under same treatment (pl = placebo; CoQ = CoQ10) (all set as 1, horizontal bar). 6mo = 6 months old, AC = acylcarnitine, mg = monoacylglycerol, dg = diacylglycerol, tg = triacylglycerol, fc = free cholesterol, ce = cholesterol esters. Data are represented as mean ± standard deviation (N=5 for group). * = p<0.05, ** = p<0.01 (Mann-Whitney test).

Similar articles

Cited by

References

    1. Emma F, Salviati L. Mitochondrial cytopathies and the kidney. Nephrol Ther. 2017:13 Suppl 1:S23–S8. - PubMed
    1. Bentinger M, Dallner G, Chojnacki T, Swiezewska E. Distribution and breakdown of labeled coenzyme Q10 in rat. Free Radic Biol Med. 2003:34(5):563–75. - PubMed
    1. Zhang Y, Aberg F, Appelkvist EL, Dallner G, Ernster L. Uptake of dietary coenzyme Q supplement is limited in rats. J Nutr. 1995:125(3):446–53. - PubMed
    1. Stefely JA, Pagliarini DJ. Biochemistry of Mitochondrial Coenzyme Q Biosynthesis. Trends Biochem Sci. 2017:42(10):824–43. - PMC - PubMed
    1. Acosta MJ, Vazquez Fonseca L, Desbats MA, Cerqua C, Zordan R. Trevisson E, et al. Coenzyme Q biosynthesis in health and disease. Biochimica et biophysica acta. 2016:1857(8):1079–85. - PubMed

Publication types

MeSH terms

Supplementary concepts