

Parsing brain structural heterogeneity in males with autism spectrum disorder reveals distinct clinical subtypes
- PMID: 30251763
- PMCID: PMC6865602
- DOI: 10.1002/hbm.24400
Parsing brain structural heterogeneity in males with autism spectrum disorder reveals distinct clinical subtypes
Abstract
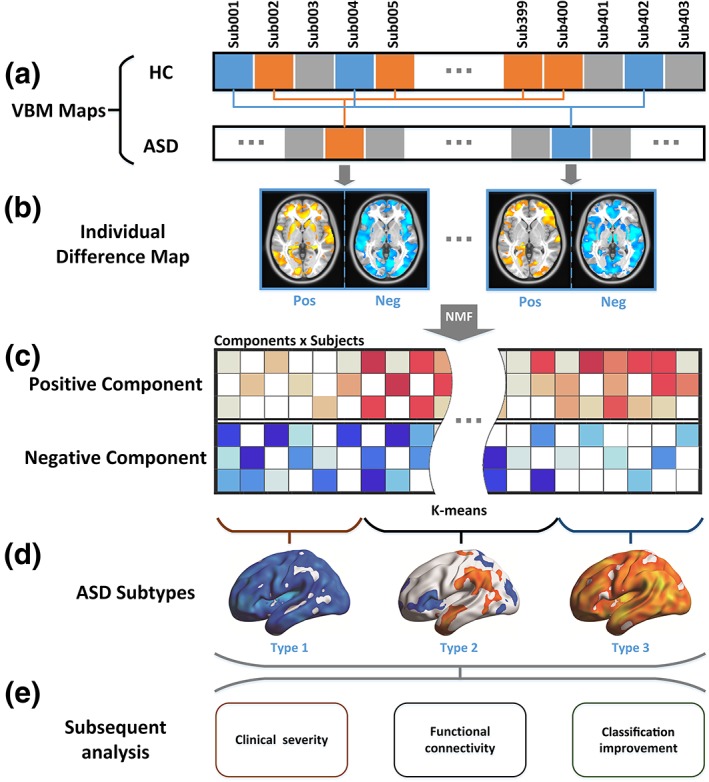
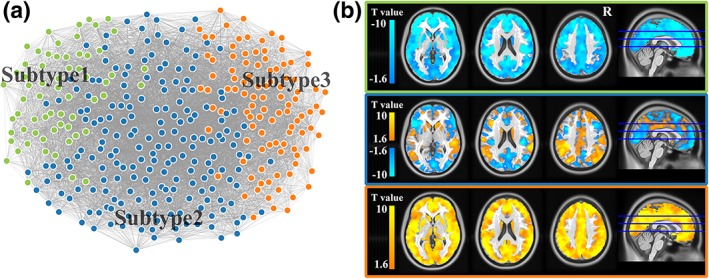
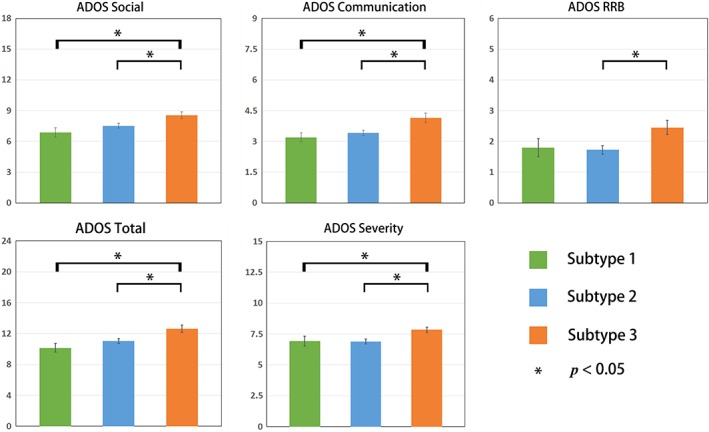
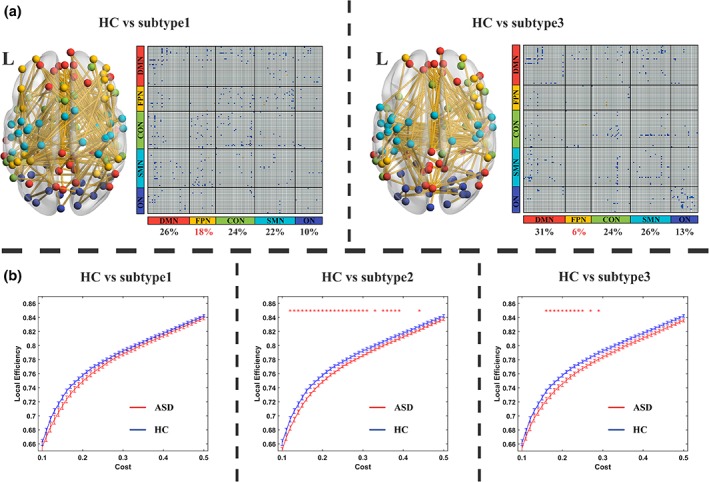
Autism spectrum disorder (ASD) is a neurodevelopmental disorder with considerable neuroanatomical heterogeneity. Thus, how and to what extent the brains of individuals with ASD differ from each other is still unclear. In this study, brain structural MRI data from 356 right-handed, male subjects with ASD and 403 right-handed male healthy controls were selected from the Autism Brain Image Data Exchange database (age range 5-35 years old). Voxel-based morphometry preprocessing steps were conducted to compute the gray matter volume maps for each subject. Individual neuroanatomical difference patterns for each ASD individual were calculated. A data-driven clustering method was next utilized to stratify individuals with ASD into several subtypes. Whole-brain functional connectivity and clinical severity were compared among individuals within the ASD subtypes identified. A searchlight analysis was applied to determine whether subtyping ASD could improve the classification accuracy between ASD and healthy controls. Three ASD subtypes with distinct neuroanatomical difference patterns were revealed. Different degrees of clinical severity and atypical brain functional connectivity patterns were observed among these three subtypes. By dividing ASD into three subtypes, the classification accuracy between subjects of two out of the three subtypes and healthy controls was improved. The current study confirms that ASD is not a disorder with a uniform neuroanatomical signature. Understanding neuroanatomical heterogeneity in ASD could help to explain divergent patterns of clinical severity and outcomes.
Keywords: autism spectrum disorder; data-driven; neuroanatomical heterogeneity; searchlight classification.
© 2018 Wiley Periodicals, Inc.
Figures
References
-
- Amaral, D. G. , Schumann, C. M. , & Nordahl, C. W. (2008). Neuroanatomy of autism. Trends in Neurosciences, 31, 137–145. - PubMed
-
- American Psychiatric Association . (2013). The Diagnostic and Statistical Manual of Mental Disorders: DSM 5. bookpointUS (p. 991). Washington, DC: Author.
-
- Aylward, E. H. , Minshew, N. J. , Field, K. , Sparks, B. F. , & Singh, N. (2002). Effects of age on brain volume and head circumference in autism. Neurology, 59, 175–183. - PubMed
-
- Bourgeron, T. (2015). From the genetic architecture to synaptic plasticity in autism spectrum disorder. Nature Reviews. Neuroscience, 16, 551–563. - PubMed
Publication types
MeSH terms
Grants and funding
- 2672018ZYGX2018J079/Fundamental Research Funds for the Central Universities/International
- 2018M631962/china postdoctoral science foundation/International
- 2015AA020505/863 project/International
- R01 MH107549/MH/NIMH NIH HHS/United States
- ZYGX2016J187/Fundamental Research Funds for the Central Universities/International
LinkOut - more resources
Full Text Sources
Other Literature Sources
Medical
