. 2018 Oct;16(7):384-396.
doi: 10.1089/adt.2018.868. Epub 2018 Sep 22.

A Pharmacochaperone-Based High-Throughput Screening Assay for the Discovery of Chemical Probes of Orphan Receptors

Affiliations

A Pharmacochaperone-Based High-Throughput Screening Assay for the Discovery of Chemical Probes of Orphan Receptors

Camilo J Morfa et al. Assay Drug Dev Technol. 2018 Oct.

Abstract

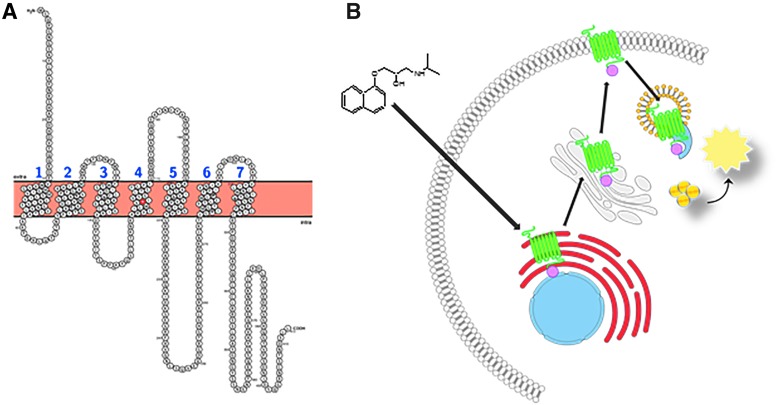
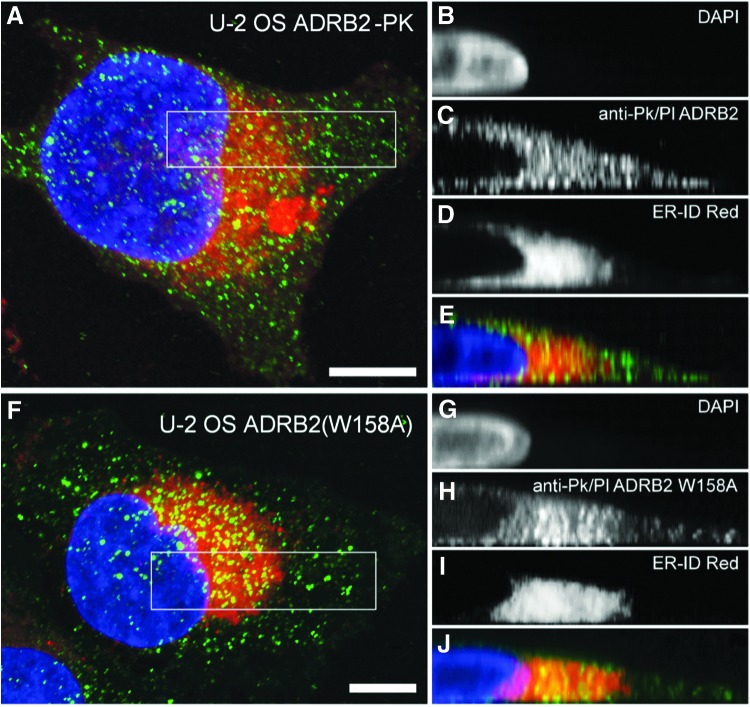
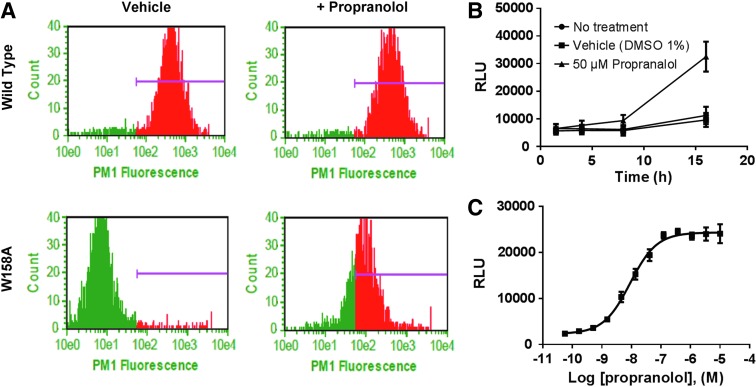
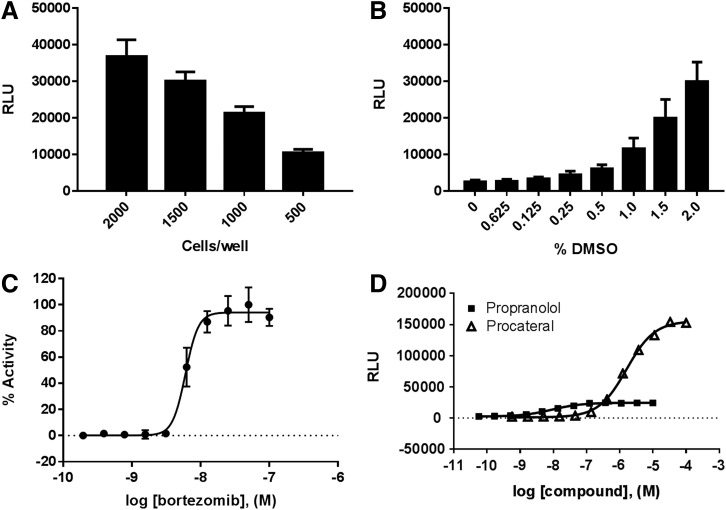
G-protein-coupled receptors (GPCRs) have varying and diverse physiological roles, transmitting signals from a range of stimuli, including light, chemicals, peptides, and mechanical forces. More than 130 GPCRs are orphan receptors (i.e., their endogenous ligands are unknown), representing a large untapped reservoir of potential therapeutic targets for pharmaceutical intervention in a variety of diseases. Current deorphanization approaches are slow, laborious, and usually require some in-depth knowledge about the receptor pharmacology. In this study we describe a cell-based assay to identify small molecule probes of orphan receptors that requires no a priori knowledge of receptor pharmacology. Built upon the concept of pharmacochaperones, where cell-permeable small molecules facilitate the trafficking of mutant receptors to the plasma membrane, the simple and robust technology is readily accessible by most laboratories and is amenable to high-throughput screening. The assay consists of a target harboring a synthetic point mutation that causes retention of the target in the endoplasmic reticulum. Coupled with a beta-galactosidase enzyme-fragment complementation reporter system, the assay identifies compounds that act as pharmacochaperones causing forward trafficking of the mutant GPCR. The assay can identify compounds with varying mechanisms of action including agonists and antagonists. A universal positive control compound circumvents the need for a target-specific ligand. The veracity of the approach is demonstrated using the beta-2-adrenergic receptor. Together with other existing assay technologies to validate the signaling pathways and the specificity of ligands identified, this pharmacochaperone-based approach can accelerate the identification of ligands for these potentially therapeutically useful receptors.

Keywords: chemical biology; deorphanization; orphan GPCR; pharmacochaperone; proteasome inhibitor.


Conflict of interest statement

J.L. and D.B. are employees of Eurofins DiscoverX. At the time this work was initiated, T.W. was employed by Eurofins DiscoverX. He is currently employed by PrimityBio.

Figures

<b>Fig. 1.</b>
Fig. 1.
Snake plot of ADRB2. Full-length snake plot showing the amino acid sequence of the human ADRB2 receptor. The tryptophan residue residing in the fourth transmembrane domain (W158) that is mutated to facilitate ER retention is highlighted in red. Membrane spanning domains are numbered sequentially (N-term to C-term) in blue (A). Diagram of the cell-based ADRB2 pharmacochaperone assay. Mutated ADRB2 harboring the single amino acid substitution (W158A) and the pro-link tag is retained in the ER by the cell's quality control systems. Upon binding to the target, a cell-permeable ligand (such as propranolol, given here) induces forward trafficking through the ER (red) and Golgi (gray), and ultimately to the plasma membrane. There it is internalized through the endosome (yellow) where the PK-tagged receptor can physically interact with the EA reconstituting a functional β-gal enzyme. The addition of lysis buffer and substrate produces light (B). ADRB2, beta-2-adrenergic receptor; β-gal, beta-galactosidase; EA, enzyme acceptor; ER, endoplasmic reticulum; PK, ProLink.
<b>Fig. 2.</b>
Fig. 2.
Localization of wild-type and mutant ADRB2 in U-2 OS cells. Confocal images in the Z and Y planes of wild-type U-2 OS ADRB2 (A–E) and ADRB2(W158A) (F–J) in U-2 OS cells harboring the β-gal EFC components. The distribution of ADRB2(W158A) and co-localization with the ER-specific dye verify retention of mutant receptors within the ER. Boxes indicate regions of interest selected for Y-axis projections inset. ADRB2 receptor (green) was visualized using an anti-PK-tag primary and Alexa-488-conjugated secondary antibody. The ER is stained red. Nuclei stained with DAPI are given in blue. Scale bar size is 10 μm. DAPI, 4′,6-diamidino-2-phenylindole, dihydrochloride; EFC, enzyme-fragment complementation.
<b>Fig. 3.</b>
Fig. 3.
Cell surface distribution of wild-type and mutant ADRB2. (A) U-2 OS Endo-EA cells expressing wild-type ADRB2-PK (top row) or mutant ADRB2(W158A) (bottom row) were treated with vehicle or 10 μM propranolol for 1.5 h. Cells were stained for surface expression of ADRB2 with an anti-ADRB2 antibody (Cat. No. ab36956; Abcam) and evaluated by flow cytometry using a Guava flow cytometer. Purple bar represents the range of cell surface fluorescence. Time-course response of ADRB2(W158) to propranolol (B) and propranolol concentration response curve (C) in the EFC trafficking assay. U-2 OS Endo-EA cells expressing ADRB2(W158A)-PK were treated with an 11-point dose response of propranolol, each dose run in quadruplicate, for 16 h at 37°C. The lowest dose in the curve corresponds to vehicle only. Each data point represents the mean RLU ± SEM of triplicate data points from at least two independent experiments. Curves represent the best fit of a four-parameter logistic generated using GraphPad Prism 7. RLU, raw luminescence units; SEM, standard error of the mean.
<b>Fig. 4.</b>
Fig. 4.
Optimization of pharmacochaperone assay in 1,536 well plates. (A) Cell-seeding density: U-2 OS-ADRB2(W158A) (black bars) were seeded at the indicated densities and exposed to control compounds for 16 h. (B) DMSO tolerance: U-2 OS-ADRB2(W158A) cells were seeded at 1,500 cells/well and allowed to attach for 4 h. Cells were incubated in the presence of bortezomib (100 nM) and the corresponding amounts of DMSO indicated as final percent v/v for 16 h. (C) Bortezomib concentration–response curve, each dose run in triplicate. (D) Procaterol and propranolol in the EFC trafficking assay: U-2 OS-ADRB2(W158A)-PK were incubated in the presence of various concentrations (11-point curve) of propranolol or procaterol, each dose run in quadruplicate, for 16 h at 37°C. Note, the Y-axis here is plotted as raw luminescence units rather than normalized percent activity (as in C). This is to better illustrate the higher maximal response elicited by procaterol versus propranolol. The lowest dose in the curve corresponds to vehicle only. Data plotted are mean ± SEM of triplicate data points from at least two independent experiments. Curves represent the best fit of a four-parameter logistic generated using GraphPad Prism 7. DMSO, dimethylsulfoxide.
<b>Fig. 5.</b>
Fig. 5.
HTS results. Histogram showing the distribution of hits from the proof-of-concept pilot screen of the LOPAC. Positive control (bortezomib 20 nM) is given in red. Negative control DMSO (1%) is given in yellow. Compounds are given in blue. A three-dimensional scatter plot of the same data (inset) is provided as an alternative view of the data. HTS, high-throughput screening; LOPAC, library of pharmacologically active compounds.
<b>Fig. 6.</b>
Fig. 6.
Hit confirmation. Freshly prepared dry powders of both formoterol (A) and propranolol (B) were subjected to reconfirmation in the primary assay. Both compounds exhibited concentration-dependent responses in the U-2 OS-ADRB-2(W158) cells. (C) The agonist formoterol exhibited a significantly higher maximal signal relative to the antagonist propranolol. Data plotted are mean ± SEM of triplicate data points from at least two independent experiments. Curves represent the best fit of a four-parameter logistic generated using GraphPad Prism 7.
<b>Fig. 7.</b>
Fig. 7.
Proposed workflow for a pharmacochaperone HTS to identify surrogate ligands of oGPCRs.

Similar articles

Cited by

  • Soluble CD13 induces inflammatory arthritis by activating the bradykinin receptor B1.
    Tsou PS, Lu C, Gurrea-Rubio M, Muraoka S, Campbell PL, Wu Q, Model EN, Lind ME, Vichaikul S, Mattichak MN, Brodie WD, Hervoso JL, Ory S, Amarista CI, Pervez R, Junginger L, Ali M, Hodish G, O'Mara MM, Ruth JH, Robida AM, Alt AJ, Zhang C, Urquhart AG, Lawton JN, Chung KC, Maerz T, Saunders TL, Groppi VE, Fox DA, Amin MA. Tsou PS, et al. J Clin Invest. 2022 Jun 1;132(11):e151827. doi: 10.1172/JCI151827. J Clin Invest. 2022. PMID: 35439173 Free PMC article.
  • Orphan G protein-coupled receptors: the ongoing search for a home.
    Jobe A, Vijayan R. Jobe A, et al. Front Pharmacol. 2024 Feb 29;15:1349097. doi: 10.3389/fphar.2024.1349097. eCollection 2024. Front Pharmacol. 2024. PMID: 38495099 Free PMC article. Review.

References

    1. Hopkins AL, Groom CR: The druggable genome. Nat Rev Drug Discov 2002;1:727–730 - PubMed
    1. Bjarnadottir TK, Gloriam DE, Hellstrand SH, Kristiansson H, Fredriksson R, Schioth HB: Comprehensive repertoire and phylogenetic analysis of the G protein-coupled receptors in human and mouse. Genomics 2006;88:263–273 - PubMed
    1. Fredriksson R, Schioth HB: The repertoire of G-protein-coupled receptors in fully sequenced genomes. Mol Pharmacol 2005;67:1414–1425 - PubMed
    1. Vassilatis DK, Hohmann JG, Zeng H, et al. : The G protein-coupled receptor repertoires of human and mouse. Proc Natl Acad Sci U S A 2003;100:4903–4908 - PMC - PubMed
    1. Edwards AM, Isserlin R, Bader GD, Frye SV, Willson TM, Yu FH: Too many roads not taken. Nature 2011;470:163–165 - PubMed

Publication types

MeSH terms

LinkOut - more resources