. 2019 Jan 1;28(1):28-43.
doi: 10.1089/scd.2018.0058. Epub 2018 Nov 22.

Immunological Properties of Neural Crest Cells Derived from Human Induced Pluripotent Stem Cells

Affiliations

Immunological Properties of Neural Crest Cells Derived from Human Induced Pluripotent Stem Cells

Shota Fujii et al. Stem Cells Dev. .

Abstract

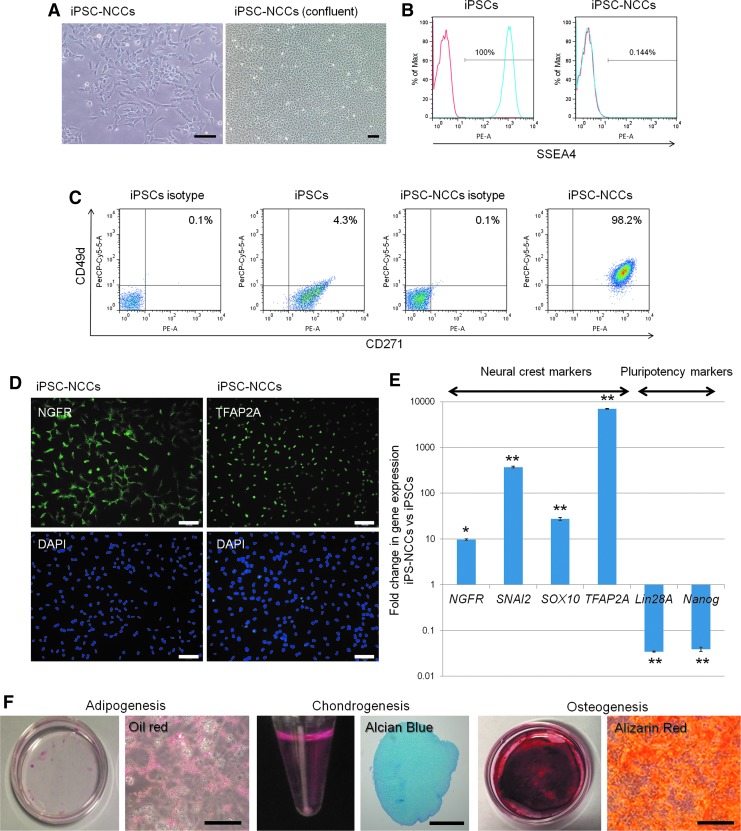
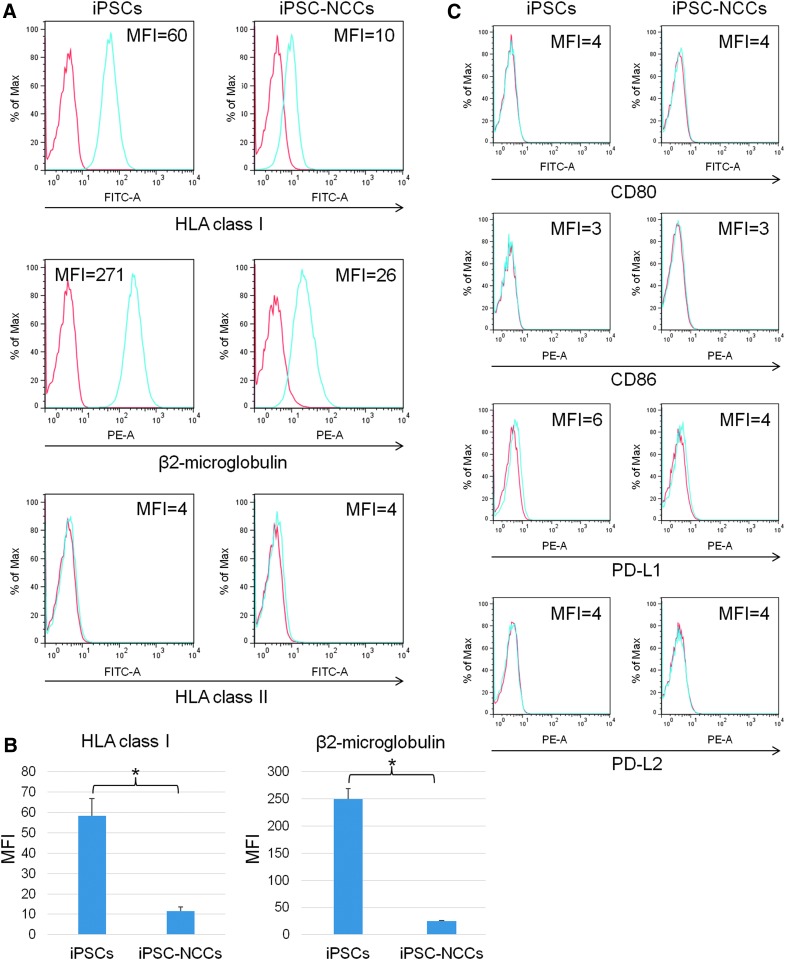
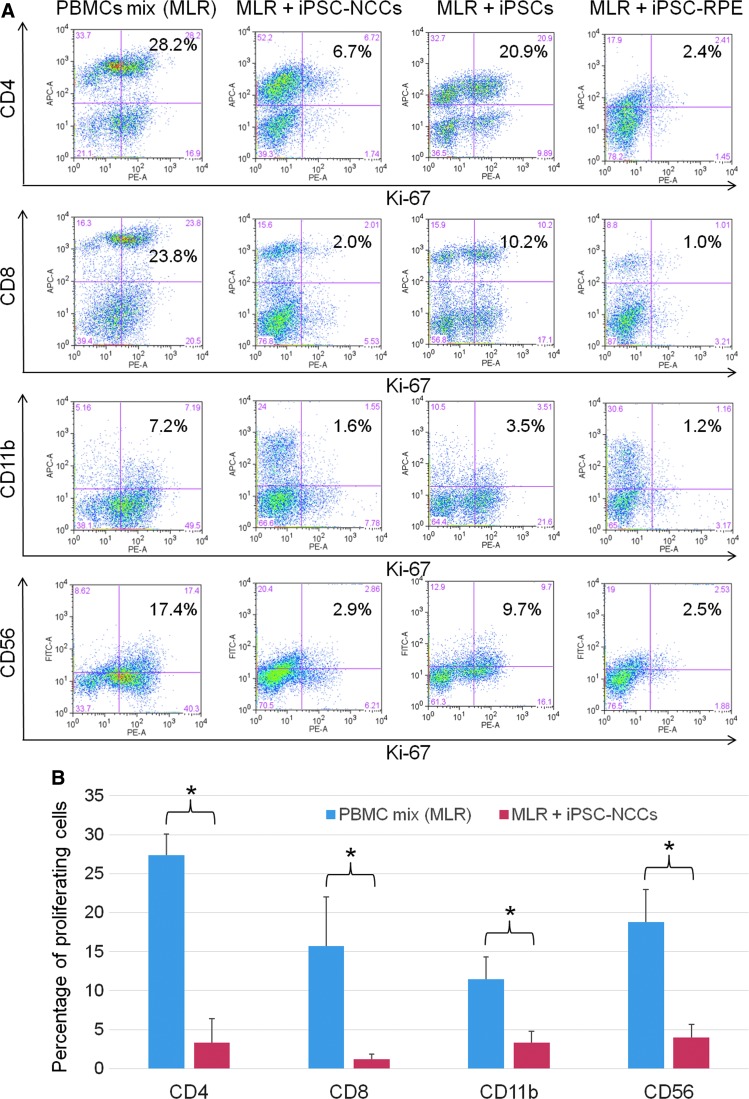
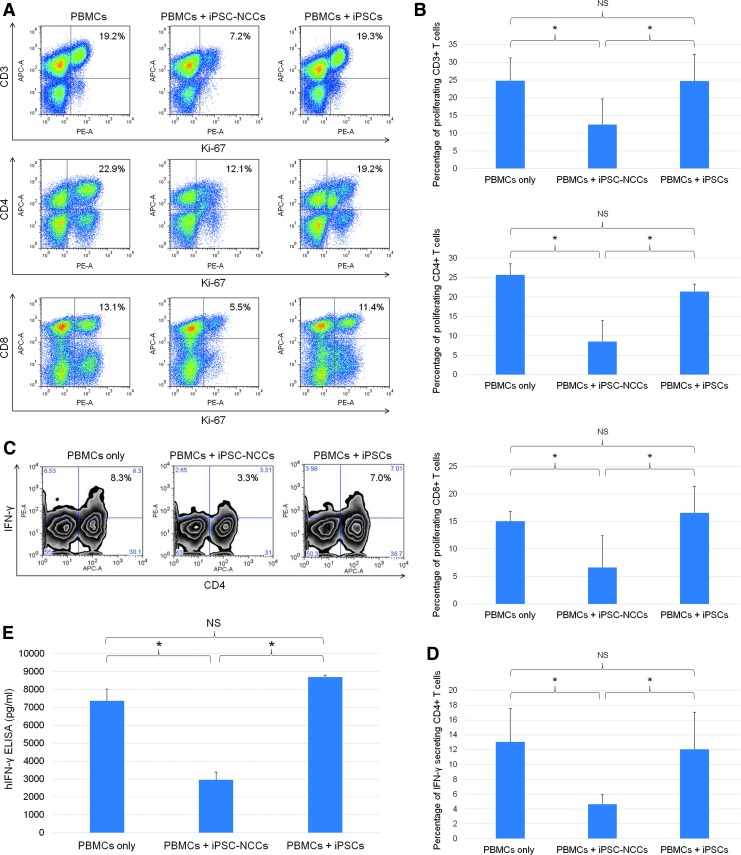
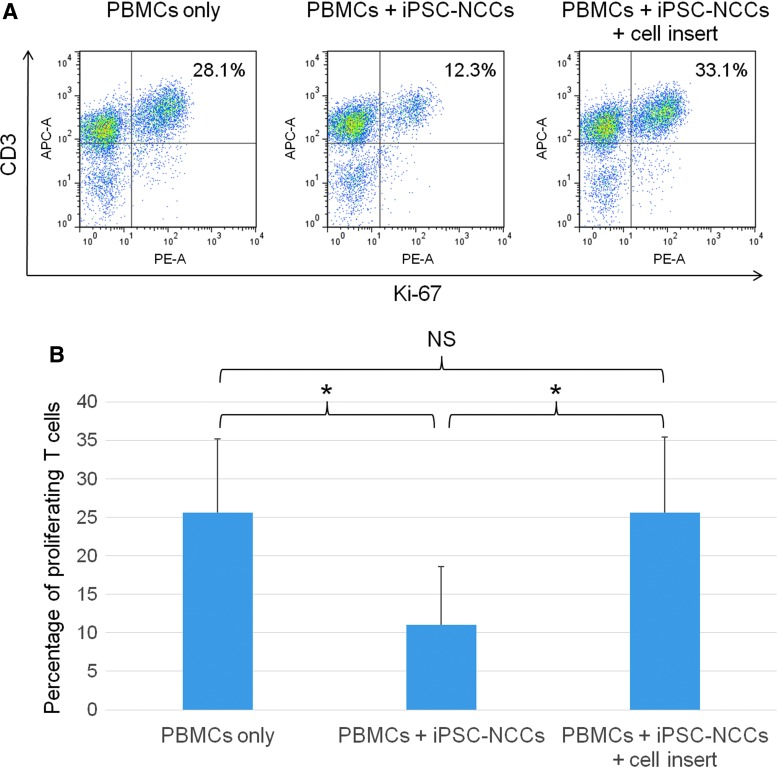
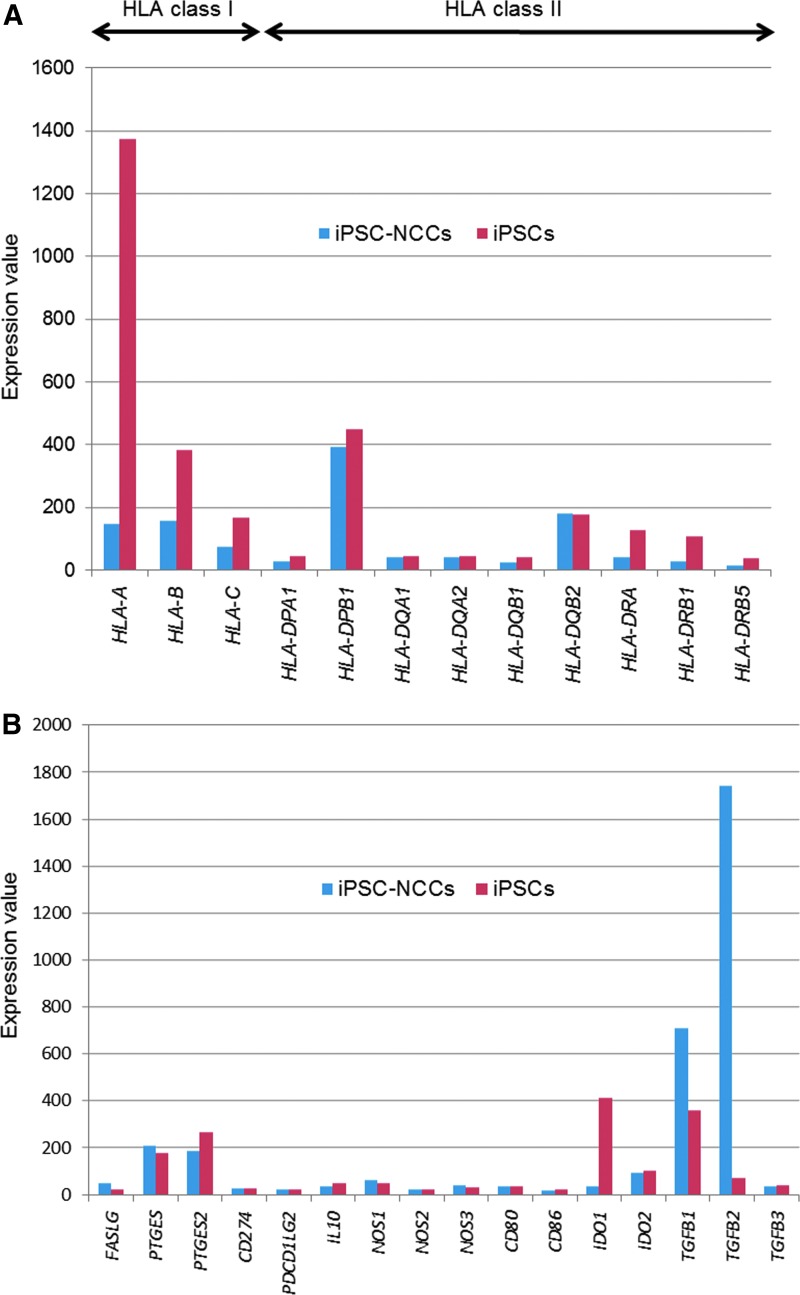
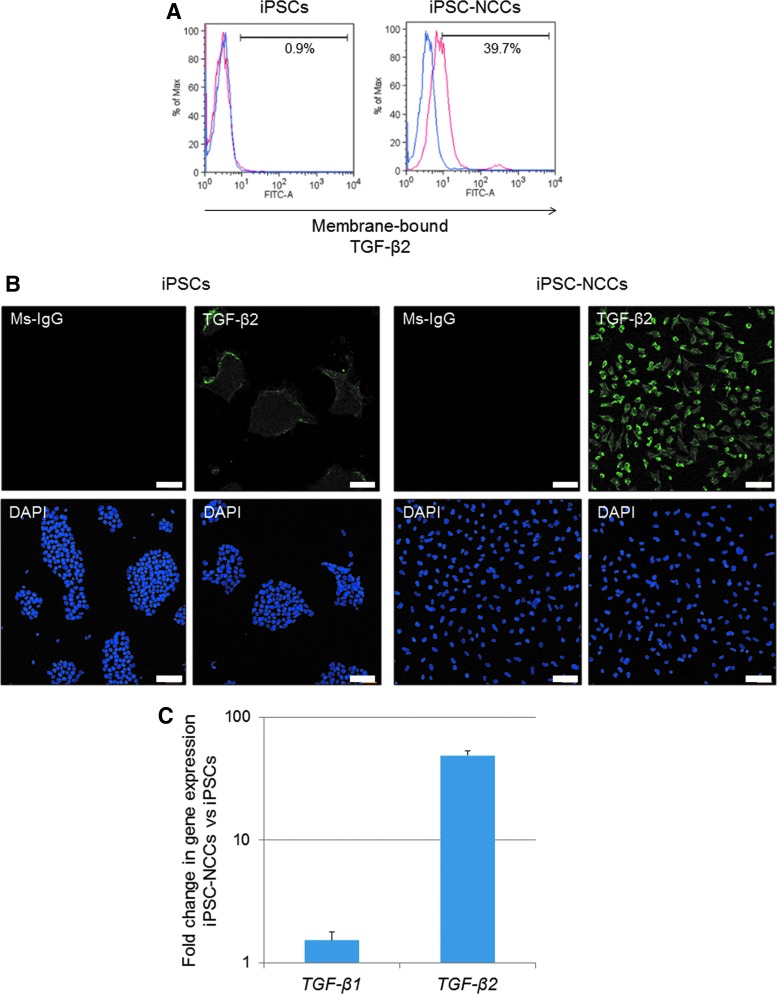
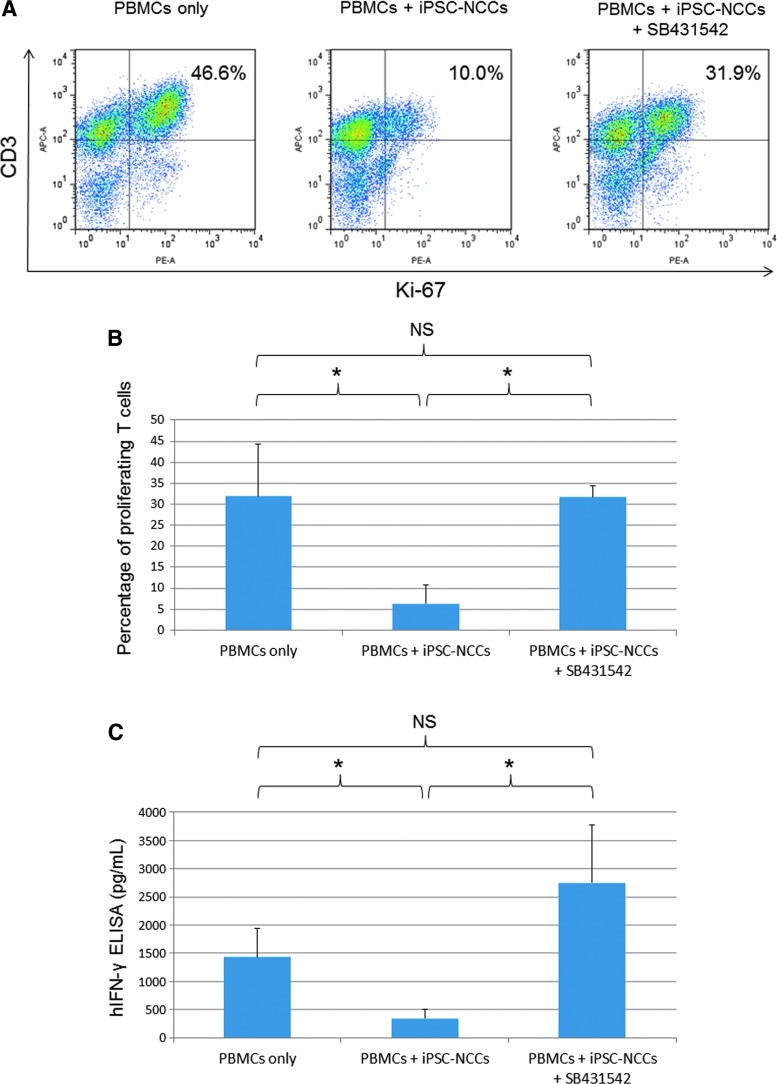
Collecting sufficient quantities of primary neural crest cells (NCCs) for experiments is difficult, as NCCs are embryonic transient tissue that basically does not proliferate. We successfully induced NCCs from human induced pluripotent stem cells (iPSCs) in accordance with a previously described method with some modifications. The protocol used in this study efficiently produced large amounts of iPSC-derived NCCs (iPSC-NCCs). Many researchers have recently produced large amounts of iPSC-NCCs and used these to examine the physiological properties, such as migratory activity, and the potential for medical uses such as wound healing. Immunological properties of NCCs are yet to be reported. Therefore, the purpose of this study was to assess the immunological properties of human iPSC-NCCs. Our current study showed that iPSC-NCCs were hypoimmunogenic and had immunosuppressive properties in vitro. Expression of HLA class I molecules on iPSC-NCCs was lower than that observed for iPSCs, and there was no expression of HLA class II and costimulatory molecules on the cells. With regard to the immunosuppressive properties, iPSC-NCCs greatly inhibited T cell activation (cell proliferation and production of inflammatory cytokines) after stimulation. iPSC-NCCs constitutively expressed membrane-bound TGF-β, and TGF-β produced by iPSC-NCCs played a critical role in T cell suppression. Thus, cultured human NCCs can fully suppress T cell activation in vitro. This study may contribute to the realization of using stem cell-derived NCCs in cell-based medicine.

Keywords: T cells; eye; immunosuppression; neural crest cells.


Conflict of interest statement

No competing financial interests exist.

Figures

<b>FIG. 1.</b>
FIG. 1.
Differentiation of NCCs from human iPS cells. (A) Bright-field image of iPSC-NCCs. Scale bars, 100 μm. (B) Expression of SSEA4 in iPSCs and iPSC-NCCs by flow cytometry analysis. iPSCs are positive, and iPSC-NCCs are negative for SSEA4. Red histogram; isotype control. (C) In the FACS analysis, iPSCs are negative for CD49 d and slightly positive for CD271 expression. iPSC-NCCs are clearly positive for CD49 d and CD271. Numbers in the FACS histograms indicate double positive cells. (D) Expression of NCC marker NGFR and TFAP2A. Immunocytochemistry analysis shows that iPSC-NCCs are positive for NGFR and TFAP2A. Cell nuclei were counterstained with DAPI. Scale bars, 100 μm. (E) Expression of NCC markers: qRT-PCR data showing the expression of NGFR, SNAI2, SOX10, TFAP2A, Lin28A, and Nanog in iPSC-NCCs (n = 3) relative to iPSCs (n = 3). NGFR, SNAI2, SOX10, and TFAP2A are significantly upregulated in iPSC-NCCs, while Lin28A and Nanog are significantly downregulated in iPSC-NCCs when the detection of mRNA is compared in these cells. *P < 0.05, **P < 0.01, when comparing the two groups. (F) Characterization and differentiation into adipocytes, chondrocytes, and osteocytes of iPSC-NCCs. iPSC-NCCs were differentiated into adipocytes. In adipocyte-differentiated cells, the accumulation of oil red O-stained lipid drops was observed. Scale bar, 200 μm. iPSC-NCCs were differentiated into chondrocytes. The pellet was verified by Alcian blue staining of cartilage proteoglycans. Scale bar, 500 μm. iPSC-NCCs were differentiated into osteocytes and exhibited enhanced calcium deposition by alizarin red S staining. Scale bar, 200 μm. iPSC, induced pluripotent stem cell; NCC, neural crest cell; qRT-PCR, quantitative real-time polymerase chain reaction.
<b>FIG. 2.</b>
FIG. 2.
Expression of HLA class I, class II, and costimulatory molecules on iPSC-NCCs. (A) For the flow cytometry analysis, HLA class I expression of iPSC-NCCs is lower compared with the iPSCs. Expression of β2-microglobulin of the iPSC-NCCs is lower compared with iPSCs. Expression of HLA class II is not detected in either of the cells. MFI, mean fluorescence intensity. (B) MFI of HLA class I and β2-microglobulin was also examined. Data are the mean ± SD of three experiments. * P < 0.01, comparing two groups. (C) Expressions of CD80 (B7-1), CD86 (B7-2), CD274 (PD-L1), and CD273 (PD-L2) failed to be detected in the iPSCs and iPSC-NCCs. Red histogram; isotype control.
<b>FIG. 3.</b>
FIG. 3.
Capacity of iPSC-NCCs to suppress MLR. (A) PBMC mix (healthy donors, n = 5) was cocultured with iPSC-NCCs for 5 days. iPSCs and iPSC-RPE cells were also used as controls. After the cultures, PBMCs exposed to iPSC-NCCs were harvested for flow cytometry analysis (Ki-67 FACS). Numbers in the histogram indicate double-positive cells (eg, CD4-Ki-67). These data are representative of three experiments. (B) Percentages of the proliferating cells (double-positive cells of PBMC mix [MLR] and MLR + iPSC-NCCs in Fig. 3A) were also examined. Data are the mean ± SD of 3 experiments. *P < 0.01, comparing two groups. MLR, mixed lymphocyte reaction; PBMC, peripheral blood mononuclear cell; RPE, retinal pigment epithelial.
<b>FIG. 4.</b>
FIG. 4.
Capacity of iPSC-NCCs to suppress activation of T cells. (A) PBMCs (a healthy donor) in the presence of anti-CD3 and anti-CD28 antibodies were cocultured with iPSC-NCCs for 3 days. After 3 days, the PBMCs exposed to iPSC-NCCs were harvested for Ki-67 FACS analysis. Numbers in the FACS dot plots indicate double-positive cells (eg, CD3-Ki-67). These data are representative of three experiments. (B) Percentages of the proliferating T cells (double-positive cells in A) were also examined. Data are the mean ± SD of three experiments. * P < 0.05, compared to the two groups. NS, not significant. (C) FACS density plots represent the expression of IFN-γ on CD4+ T cells in the presence of iPSC-NCCs or control iPSCs. PBMCs were stained with anti-CD4 and anti-IFN-γ. Numbers in the density plots indicate the percentage of cells double positive for CD4/IFN-γ. These data are representative of three experiments. (D) Percentages of the IFN-γ secreting CD4+ T cells (double-positive cells in C) were also examined. Data are the mean ± SD of 3 experiments. * P < 0.05, compared to the two groups. NS, not significant. (E) Concentrations of IFN-γ in supernatant (MLR plus iPSC-NCCs) were examined by human IFN-γ ELISA. We also collected control samples: MLR without iPSC-NCCs and MLR plus iPSCs. Data are the mean ± SD of three ELISA determinations. * P < 0.01, compared to the two groups. NS, not significant.
<b>FIG. 5.</b>
FIG. 5.
Ability of iPSC-NCCs to suppress T cells through cell contact molecules. (A) iPSC-NCCs were first cultured in 12-well plates. Transwell cell inserts were placed in these wells, and each transwell contained PBMCs plus anti-CD3 and anti-CD28 antibodies to block cell-to-cell contact between the NCCs and CD3 positive T cells in PBMCs. The numbers in the FACS histograms indicate CD3-Ki-67 double-positive cells. These data are representative of three experiments. (B) Percentages of the proliferating T cells (double-positive cells in A) were also examined. Data are the mean ± SD of three experiments. *P < 0.05, compared to the two groups. NS, not significant.
<b>FIG. 6.</b>
FIG. 6.
Expression of mRNA for HLA-related molecules and immunosuppressive factors in iPSC-NCCs as assessed by DNA microarray. Total RNA of iPSCs (n = 2, red bars) and iPSC-NCCs (n = 2, blue bars) was extracted and analyzed by microarray. (A) HLA class I and HLA class II expression. (B) Immunosuppressive molecules. FASLG, Fas ligand; PTGES, prostaglandin E synthase; PTGES2, prostaglandin E synthase 2; PDCD1LG2, programmed death 1 ligand 2; IL10, interleukin 10; NOS1, nitric oxide synthase 1; NOS2, nitric oxide synthase 2; NOS3, nitric oxide synthase 3; IDO1, indoleamine 2,3-dioxygenase 1; IDO2, indoleamine 2,3-dioxygenase 2; TGFB1, transforming growth factor beta 1; TGFB2, transforming growth factor beta 2; TGFB3, transforming growth factor beta 3.
<b>FIG. 7.</b>
FIG. 7.
Expression of membrane-bound TGF-β2 on iPSC-derived NCCs. (A) Detection of membrane-bound TGF-β2 on iPSC-NCCs by flow cytometry analysis. We also prepared iPSCs as a control. These cells were stained with anti-human TGF-β2 abs. Blue histograms represent isotype control staining. (B) Detection of TGF-β2 in iPSC-NCCs by immunostaining. iPSC-NCCs, but not control iPSCs, clearly expressed TGF-β2 on their surface. Cell nuclei were counterstained with DAPI. Scale bars, 100 μm. (C) iPSC-NCCs or control iPSCs were harvested and examined for expression of TGF-β1, β2 mRNA by qRT-PCR. Results indicate the relative expression of these molecules (ΔΔCt: control iPSCs = 1.0).
<b>FIG. 8.</b>
FIG. 8.
Effect of TGF-β produced by iPSC-NCCs on suppression of T cell activation. (A) PBMCs plus anti-CD3 and anti-CD28 antibodies were cocultured with iPSC-NCCs in the presence of 10 μM of SB431542 and PBMC-NCCs without SB431542 (middle panel) and evaluated by Ki-67 FACS analysis. Numbers in the histogram indicate double-positive cells. These data are representative of three experiments. (B) Percentages of proliferating T cells (the double-positive cells in A) are examined. Data are the mean ± SD of three experiments. *P < 0.05, compared to the two groups. NS, not significant. (C) Concentrations of IFN-γ in supernatant are examined by human IFN-γ ELISA. We collected samples of PBMCs only and PBMC plus iPSC-NCCs with or without SB431542. Data are the mean ± SD of three ELISA determinations. *P < 0.05, comparing two groups. NS, not significant.

Similar articles

Cited by

References

    1. Williams AL. and Bohnsack BL. (2015). Neural crest derivatives in ocular development: discerning the eye of the storm. Birth Defects Res C Embryo Today 105:87–95 - PMC - PubMed
    1. Reneker LW, Silversides DW, Xu L. and Overbeek PA. (2000). Formation of corneal endothelium is essential for anterior segment development - a transgenic mouse model of anterior segment dysgenesis. Development 127:533–542 - PubMed
    1. Xu X, Chen C, Akiyama K, Chai Y, Le AD, Wang Z. and Shi S. (2013). Gingivae contain neural-crest- and mesoderm-derived mesenchymal stem cells. J Dent Res 92:825–832 - PMC - PubMed
    1. Fournier BP, Loison-Robert LS, Ferré FC, Owen GR, Larjava H. and Häkkinen L. (2016). Characterisation of human gingival neural crest-derived stem cells in monolayer and neurosphere cultures. Eur Cells Mater 31:40–58 - PubMed
    1. Davies LC, Lönnies H, Locke M, Sundberg B, Rosendahl K, Götherström C, Le Blanc K. and Stephens P. (2012). Oral mucosal progenitor cells are potently immunosuppressive in a dose-independent manner. Stem Cells Dev 21:1478–1487 - PMC - PubMed

Publication types