. 2018 Oct 15;526(15):2428-2443.
doi: 10.1002/cne.24502. Epub 2018 Sep 25.

Input-output organization of the mouse claustrum

Affiliations

Input-output organization of the mouse claustrum

Brian Zingg et al. J Comp Neurol. .

Abstract

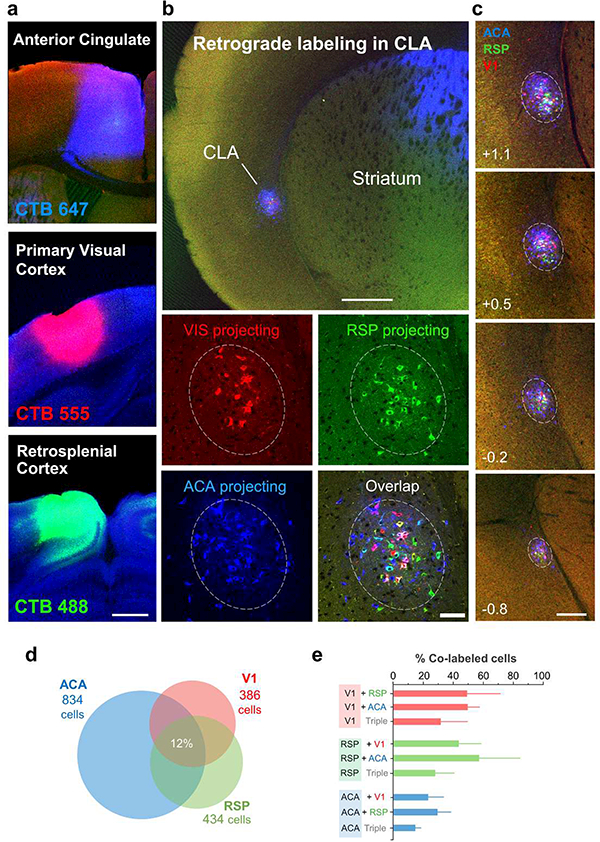
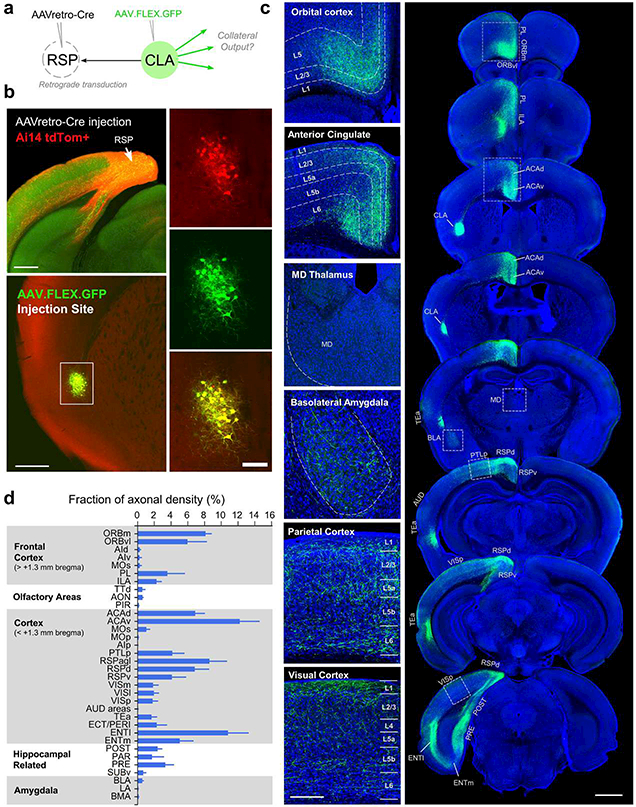
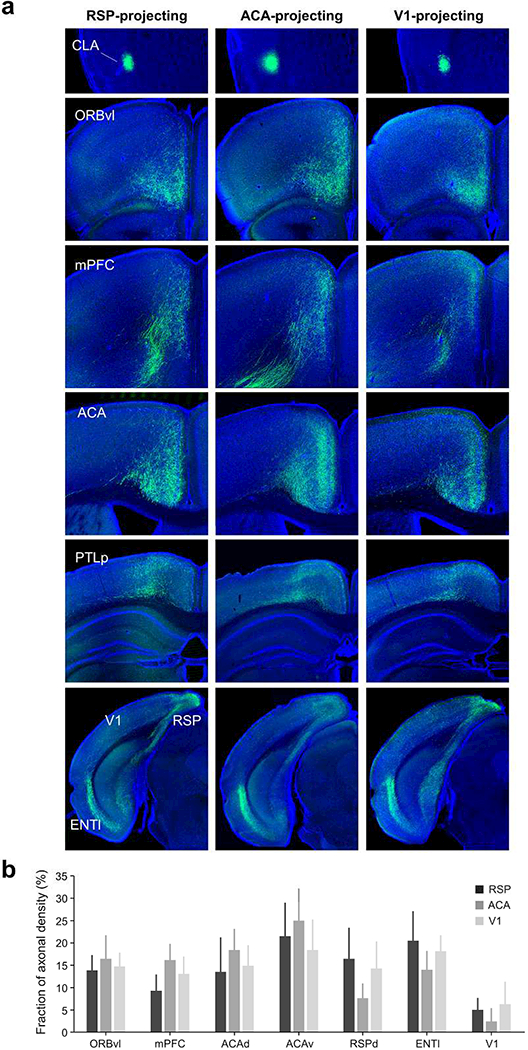
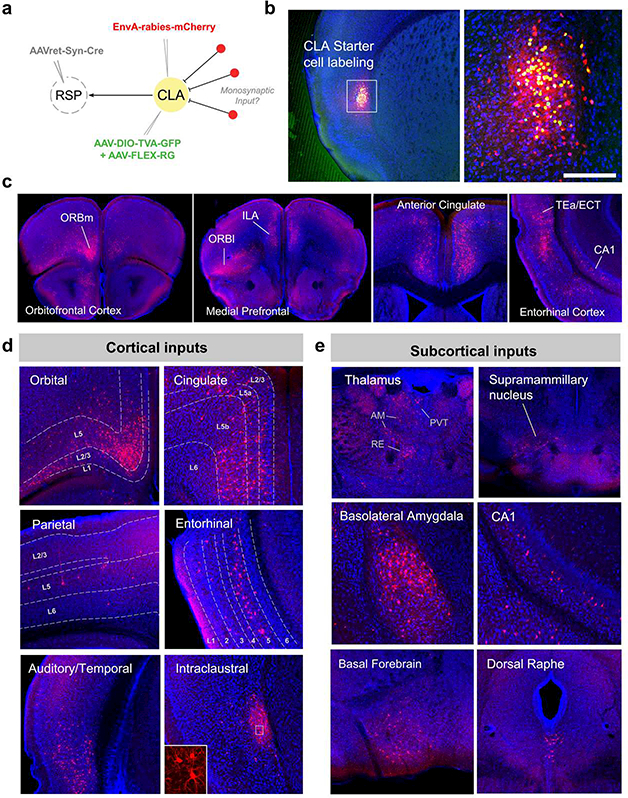
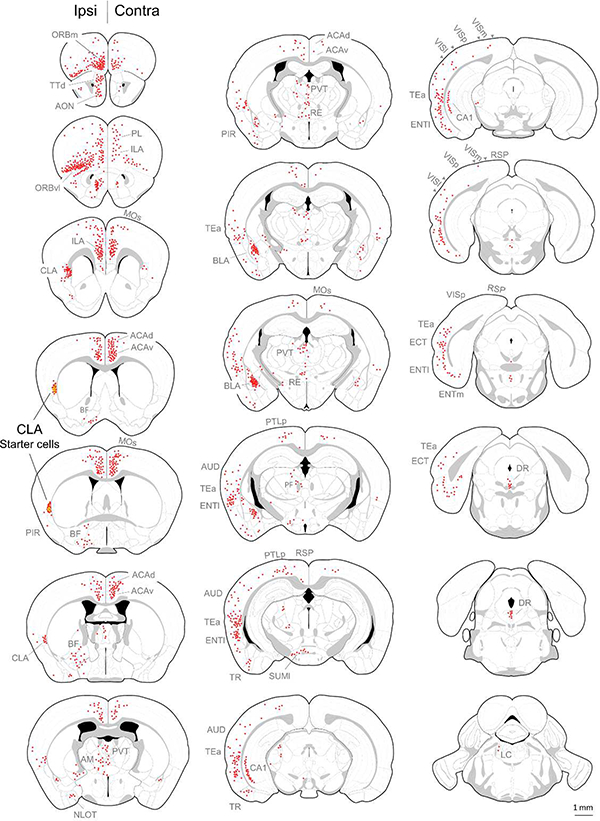
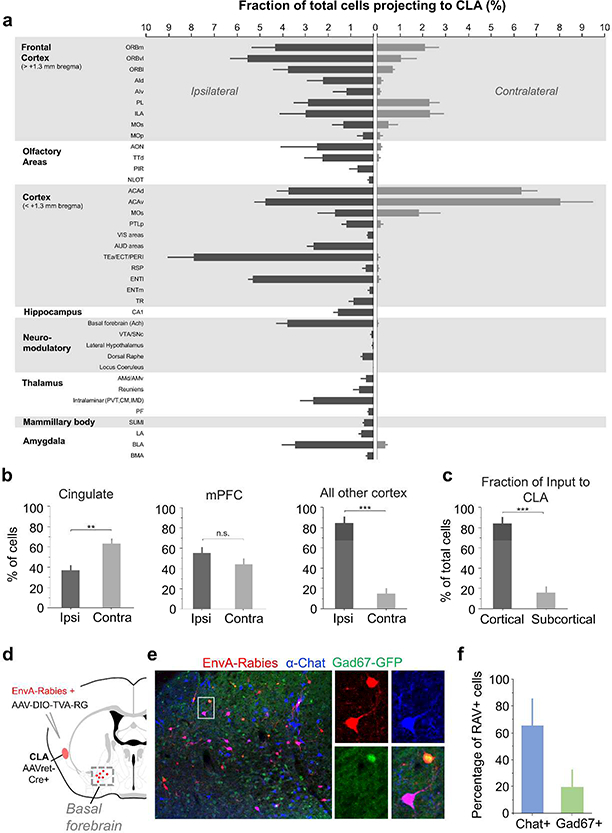
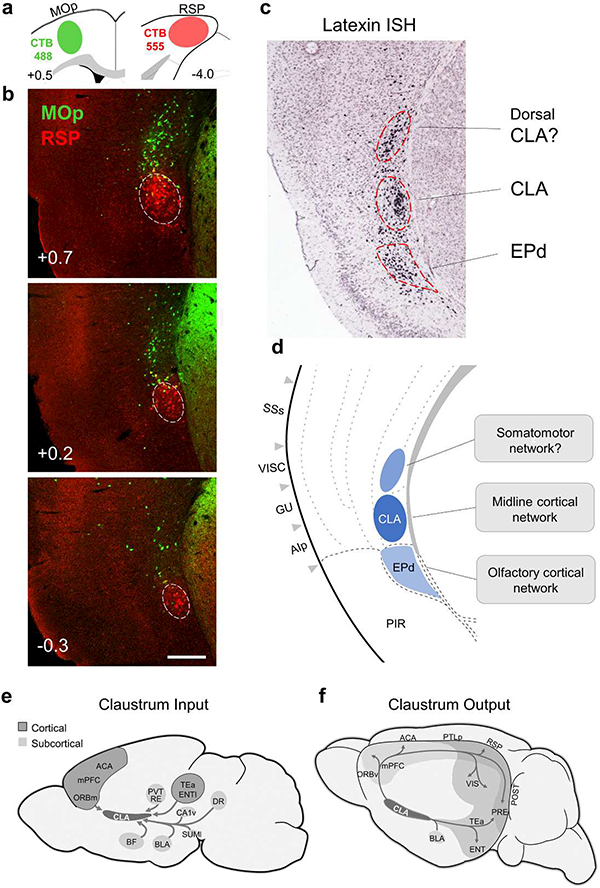
Progress in determining the precise organization and function of the claustrum (CLA) has been hindered by the difficulty in reliably targeting these neurons. To overcome this, we used a projection-based targeting strategy to selectively label CLA principal neurons. Combined with adeno-associated virus (AAV) and monosynaptic rabies tracing techniques, we systematically examined the pre-synaptic input and axonal output of this structure. We found that CLA neurons projecting to retrosplenial cortex (RSP) collateralize extensively to innervate a variety of higher-order cortical regions. No subcortical labeling was found, with the exception of sparse terminals in the basolateral amygdala (BLA). This pattern of output was similar to cingulate- and visual cortex-projecting CLA neurons, suggesting a common targeting scheme among these projection-defined populations. Rabies virus tracing directly demonstrated widespread synaptic inputs to RSP-projecting CLA neurons from both cortical and subcortical areas. The strongest inputs arose from classically defined limbic regions, including medial prefrontal cortex, anterior cingulate, BLA, ventral hippocampus, and neuromodulatory systems such as the dorsal raphe and cholinergic basal forebrain. These results suggest that the CLA may integrate information related to the emotional salience of stimuli and may globally modulate cortical state by broadcasting its output uniformly across a variety of higher cognitive centers.

Keywords: AAV; RRID:AB_141844; RRID:AB_2079751; RRID:AB_2572212; claustro-cortical network; claustrum; connectivity; frontal cortex; limbic; neuromodulatory; rabies; retrograde tracing.


Figures

Figure 1.
Figure 1.
Co-localization of projection-defined claustrum neurons. (a) Injection site locations in anterior cingulate (ACA, CTB 647, blue), primary visual cortex (V1, CTB 555, red), and retrosplenial cortex (RSP, CTB 488, green). Scale bar: 500 μm. (b) Retrograde labeling in claustrum (CLA). Bottom panels, 40X magnification of V1, RSP, and ACA projecting CLA neurons. Scale bars: 500 μm, top panel; 50 μm, bottom panels. (c) Distribution of retrogradely labeled cells along the claustrum axis for each injection site. Values in mm relative to bregma. Scale bar: 250 μm. (d) Fraction of co-labeling for total population of CLA neurons quantified for all 3 animals. 12% of the entire population of cells project to all three injection sites (see Table 2 for cell counts for each animal). (e) Quantification of co-labeling for V1, RSP, and ACA-projecting CLA neuron populations (n = 3 mice, error bar = 95% CI).
Figure 2.
Figure 2.
Axonal output of RSP-projecting CLA neurons. (a) Viral injection strategy for labeling CLA neurons. (b) Example injection of AAVretro-Cre in RSP (top left panel) and AAV1-FLEX-GFP in CLA (bottom left panel) in an Ai14 tdTomato Cre-reporter mouse. Retrogradely labeled Cre+ neurons (red) are found in CLA, but not surrounding brain structures, and co-express GFP (green, right panels). Scale bars: 500 μm, left panels; 100 μm, right panels. (c) Overview of axonal projection pattern for RSP-projecting CLA neurons (right panel). No subcortical labeling was observed, except in the basolateral amygdala. Density of axonal termination was greatest in layers (L)2/3 and L5 of orbital cortex and L1, L5a, and L6 of cingulate, but was more diffuse in parietal and visual cortical areas (left panels). Scale bars: 1 mm, right panel; 250 μm, left panels. (d) Quantification of axonal fluorescence density expressed as a percentage of the total for all brain regions containing labeled axons (n = 3 animals, error bar = 95% CI).
Figure 3.
Figure 3.
Comparison of output for different projection-defined CLA neurons. (a) Claustrum injection sites (top panels, green) and example axonal labeling in several cortical regions for RSP-, ACA-, and V1-projecting claustrum populations. (b) Quantification of fluorescent axon density expressed as a fraction of the total density found for 7 sampled areas for RSP-, ACA-, and V1-projecting claustrum populations. Two-way ANOVA showed no significant difference in overall targeting preference between each population (n = 3 animals for each group, error bar = 95% CI).
Figure 4.
Figure 4.
Monosynaptic input to RSP-projecting CLA neurons. (a) Viral injection strategy for mapping pre-synaptic input to RSP-projecting CLA neurons. (b) Example injection site showing CLA starter cell population (yellow) co-expressing rabies glycoprotein (RG), TVA receptor, GFP and rabies-mCherry (red). Scale bar = 200 μm. (c) Example images of presynaptic rabies-mCherry labeling (red) in orbital, medial prefrontal, cingulate, and entorhinal regions. (d) Example images of cortical input to claustrum. Labeled cells were most prominent in layers (L)2/3 and L5 of orbital and cingulate cortex (top panels), and L5 of parietal and entorhinal cortex (middle panels). More diffuse labeling was seen across deep layers of temporal cortex (bottom left panel). Presynaptic labeling was also observed within the claustrum in sections more posterior to the starter population (bottom right panel). Higher magnification confirmed many of these cells were principal neurons with dendritic spines (inset). (e) Examples images of subcortical input to the claustrum.
Figure 5.
Figure 5.
Summary of brain-wide input to RSP-projecting CLA neurons. Example labeling for one case plotted on corresponding coronal atlas sections. Red dots indicate location of retrogradely labeled cell bodies and yellow dots indicate extent of starter cell population. See table 1 for list of abbreviations.
Figure 6.
Figure 6.
Quantification of presynaptic input to RSP-projecting CLA neurons. (a) Number of cells projecting to CLA from ipsilateral (left) and contralateral (right) brain regions expressed as a percentage of the total number of labeled cells quantified for the entire brain for each case (n = 4 animals, error bar = 95% CI). See Table 3 for summary of cell counts. (b) Quantification of bilateral asymmetry in the number of cells projecting to CLA from ipsilateral and contralateral cingulate, medial prefrontal cortex (mPFC), and all other cortical regions. Percentages reflect the number of cells quantified for ipsilateral or contralateral regions divided by the total number of cells quantified for that specific region for each case (n = 4 animals; error bar = 95% CI; n.s., not significant, **p < 0.01, ***p < 0.001; paired t-test). (c) Fraction of total cells projecting to CLA from cortical versus subcortical brain regions (n = 4 animals, error bar = 95% CI, ***p < 0.001, paired t-test). (d) Schematic of monosynaptic rabies virus injection strategy for labeling basal forebrain neurons that project to CLA in GAD67-GFP mice. (e) Retrograde labeling in basal forebrain (red). Cells co-localized with both GAD67-GFP inhibitory neurons (green) and cholinergic neurons (ChAT+ immunostaining, blue). (f) Quantification of co-localization with ChAT+ and GAD67+ neurons expressed as a percentage of total RAV+ neurons in the basal forebrain for each case (n = 3 mice, error bar = 95% CI, total cell counts for all 3 mice: 424 ChAT+/663 RAV+ cells, 137 GAD67+/663 RAV+ cells).
Figure 7.
Figure 7.
Claustrum boundaries and summary of brain-wide connectivity. (a) Schematic of cholera toxin subunit B (CTB) injection sites in primary motor (MOp) and retrosplenial cortex (RSP). Values shown in mm relative to bregma. (b) Retrograde labeling in CLA (dashed circle) following injection of CTB 555 in RSP (red) and CTB 488 in MOp (green) in the same animal. MOp projecting cells cluster just dorsal to the CLA region defined by RSP-projecting cells. Values shown in mm relative to bregma. Scale bar 250 μm. (c) Gene expression pattern for latexin, a known genetic marker for CLA and endopiriform (EPd) cell types (see Watakabe et al., 2014). Gene expression is enriched in a dorsal population of cells that may correspond to motor cortex projecting CLA neurons. In situ hybridization (ISH) data from the Allen Brain Atlas database (www.brain-map.org, Experiment #72340108). (d) Schematic showing distinct network relationships for EPd and CLA as well as the potential inclusion of a dorsal CLA region that interacts specifically with somatosensory and motor cortex (see Smith & Alloway, 2014; Watson et al., 2017; but also see Mathur et al., 2009; Wang et al., 2016). (e) Schematic representation of major inputs to CLA characterized in this study. Major inputs include medial prefrontal, cingulate, and retrohippocampal cortical regions (dark gray); and neuromodulatory (BF, DR), midline thalamic (PVT, RE), amygdalar (BLA), supramammillary (SUMl), and ventral hippocampal (CA1v) subcortical regions (light gray). (f) Summary of claustrum output. Axonal projections are predominately restricted to ipsilateral cortex, except for a sparse subcortical projection to basolateral amygdala (BLA). Dense projections are found along midline cortical regions, including orbital, medial prefrontal, cingulate, and retrosplenial areas, as well as more laterally located temporal (TEa), entorhinal (ENT), and retrohippocampal (PRE, POST) regions. Substantial projections were also found diffusely throughout posterior parietal (PTLp) and visual (VIS) cortical regions.

Similar articles

Cited by

References

    1. Atlan G, Terem A, Peretz-Rivlin N, Groysman M, & Citri A (2016). Mapping synaptic cortico-claustral connectivity in the mouse. The Journal of Comparative Neurology, 520, 633–655. 10.1002/cne.23997 - DOI - PubMed
    1. Beyeler A, Chang C-J, Silvestre M, Lévêque C, Namburi P, Wildes CP, & Tye KM (2018). Organization of Valence-Encoding and Projection-Defined Neurons in the Basolateral Amygdala. Cell Reports, 22(4), 905–918. 10.1016/j.celrep.2017.12.097 - DOI - PMC - PubMed
    1. Billwiller F, Renouard L, Clement O, Fort P, & Luppi PH (2017). Differential origin of the activation of dorsal and ventral dentate gyrus granule cells during paradoxical (REM) sleep in the rat. Brain Structure and Function, 222(3), 1495–1507. 10.1007/s00429-016-1289-7 - DOI - PMC - PubMed
    1. Brown Solange P; Brian Mathur; Olsen Shawn R; Pierre-Herve Luppi; Bickford Martha E; Citri A. (2017). New Breakthroughs in Understanding the Role of Functional Interactions between the Neocortex and the Claustrum. The Journal of Neuroscience, 37(45), 10877–10881. http://doi.org/DOI:10.1523/JNEUROSCI.1837-17.2017 - DOI - PMC - PubMed
    1. Burgos-Robles A, Kimchi EY, Izadmehr EM, Porzenheim MJ, Ramos-Guasp WA, Nieh EH, Tye KM (2017). Amygdala inputs to prefrontal cortex guide behavior amid conflicting cues of reward and punishment. Nature Neuroscience, 20(6), 824–835. 10.1038/nn.4553 - DOI - PMC - PubMed

Publication types

MeSH terms

LinkOut - more resources