. 2019 Feb/Mar;11(2):335-349.
doi: 10.1080/19420862.2018.1527665. Epub 2018 Oct 22.

Comprehensive manipulation of glycosylation profiles across development scales

Affiliations

Comprehensive manipulation of glycosylation profiles across development scales

Sven Loebrich et al. MAbs. 2019 Feb/Mar.

Abstract

The extent and pattern of glycosylation on therapeutic antibodies can influence their circulatory half-life, engagement of effector functions, and immunogenicity, with direct consequences to efficacy and patient safety. Hence, controlling glycosylation patterns is central to any drug development program, yet poses a formidable challenge to the bio-manufacturing industry. Process changes, which can affect glycosylation patterns, range from manufacturing at different scales or sites, to switching production process mode, all the way to using alternative host cell lines. In the emerging space of biosimilars development, often times all of these aspects apply. Gaining a deep understanding of the direction and extent to which glycosylation quality attributes can be modulated is key for efficient fine-tuning of glycan profiles in a stage appropriate manner, but establishment of such platform knowledge is time consuming and resource intensive. Here we report an inexpensive and highly adaptable screening system for comprehensive modulation of glycans on antibodies expressed in CHO cells. We characterize 10 media additives in univariable studies and in combination, using a design of experiments approach to map the design space for tuning glycosylation profile attributes. We introduce a robust workflow that does not require automation, yet enables rapid process optimization. We demonstrate scalability across deep wells, shake flasks, AMBR-15 cell culture system, and 2 L single-use bioreactors. Further, we show that it is broadly applicable to different molecules and host cell lineages. This universal approach permits fine-tuned modulation of glycan product quality, reduces development costs, and enables agile implementation of process changes throughout the product lifecycle.

Keywords: ADC; DoE; feed additives; glycosylation; media development; multivariate analysis; product quality; scalability.


Figures
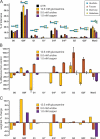
Figure 1.
Figure 1.
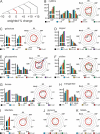
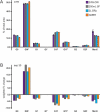
A) Glycosylation profile of CHO cells at the end of fed-batch culture in 24-well deep well plates. Cells were either given control feed without additives (CTR), or a single additive at the indicated concentration. Percent of total signal is shown for each of the nine aspects of the glycosylation profile. Sketches above each aspect illustrate biochemical composition, according to key in top right box. Error bars represent standard deviation of the means of at least three independent experiments, each with at least two pseudo replicates. (B) Deflection from control values is shown, expressed as percent difference from control for each of the three additives across the entire glycosylation profile. (C) Average weighted percent changes are shown, taking into account the contribution of each attribute to the overall glycosylation profile. Note, that for each feed additive the sum of all weighted percent changes across the entire profile is zero.
Figure 2.
Figure 2.
A) Segment of spider web plot illustrating quantitative weighted percent change values for each concentric nonagon. Red line indicates no change from control. Reductions from control value are plotted toward the center of the plot, increases toward the periphery. (B) Effect of cytidine on glycosylation profile. Left: Bar graphs indicate percent of total signal for select aspects of the glycosylation profile. Black bars are control conditions without feed additive. Colored bars indicate applied cytidine concentration. Note, that effects of cytidine show linear dose-response relationship. Error bars represent standard deviation of the means of at least three independent experiments, each with at least two pseudo replicates. Right: Nonagonal spider web plot showing all data points for all tested cytidine concentrations. The red nonagon represents the control profile without cytidine. Data points inside the red nonagon represent reductions from control value; data points outside the red nonagon are increases over control. (C) Bar graphs and spider web plot for galactose. (D) Bar graphs and spider web plot for copper. (E) Bar graphs and spider web plot for glucosamine. (F) Bar graphs and spider web plot for uridine. (G) Bar graphs and spider web plot for fucose. (H) Bar graphs and spider web plot for manganese. (I) Bar graphs and spider web plot for ManNAc. (J) Spider web plot for glycerol. No bar graph is shown because deflections from control were minimal. (K) Spider web plot for NANA. No bar graph is shown because deflections from control were minimal.
Figure 3.
Figure 3.
A) Data distribution for total afucosylated species. Each experiment is represented by a black dot. Cumulative probabilities are given as numerical values inside top box. Box-and-whisker-plot and histogram are shown at the bottom. Numbers along histogram denote % afucosylated species in each experiment. Note that data is normally distributed. (B) Residual over predicted plot showing variability after modeling. Numbers along x-axis denote % afucosylated species. Note that residual data is randomly distributed. (C) Residuals of afucosylated species plotted by row number, showing randomized DOE setup. (D) Data distribution for culture viability at D14. Each experiment is represented by a black dot. Cumulative probabilities are given as numerical values inside top box. Box-and-whisker-plot and histogram are shown at the bottom. Numbers along histogram denote % culture viability in each experiment. Note that this data set is not normally distributed, and viabilities fall into three distinct groups. (E) Residual over predicted plot showing variability after modeling. Numbers along x-axis denote % culture viability. Residuals show a pattern of three groups which largely occupy viability ranges not observed in the data set. (F) Residuals of D14 viability plotted by row number, showing randomized DOE setup. (G) Actual over predicted plot showing ability of the model to predict G0 species. (H) Half normal plot for G0 species, showing feed additives that are significant factors in modulating G0. Note that in addition to main effects the interaction of cytidine with fucose has significant influence on G0.
Figure 4.
Figure 4.
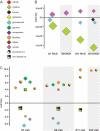
A) Symbols for model terms: Colored diamonds represent main effects of feed additives, Ying-yang symbols signify two-factor interactions, and hatched squares indicate non-aliased two-factor interactions. The position of each symbol along the y-axis denotes the magnitude of the estimate. The size of each symbol encodes the t-ratio (estimate divided by the standard error of the given estimate), to indicate robustness of the effect. All statistically significant effects are depicted. (B) Estimates impacting IVCD throughout the duration of the experiment. Note, that beneficial effects of uridine are relatively constant, whereas the detrimental effects of cytidine are getting greater during the experiment. Only main effects are significant for IVCD. (C) Estimates impacting culture viability. Note that several positive effects are observed throughout the entire experiment, including main effects and two-factor interactions. Negative effects are seen mid-experiment, but not toward the later days.
Figure 5.
Figure 5.
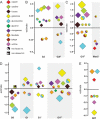
A) Symbols for model terms: Each model term was assigned a color. Colored diamonds represent main effects of feed additives, Ying-yang symbols signify two-factor interactions, and hatched squares indicate non-aliased two-factor interactions. The position of each symbol along the y-axis denotes the magnitude of the estimate. The size of each symbol encodes the t-ratio (estimate divided by the standard error of the given estimate), to indicate robustness of the effect. All statistically significant effects are depicted. (B) Estimates impacting G2 and G2F species. Note, that numerous main effects and interactions modulate the species to varying degrees and with different robustness, allowing for exquisite fine-tuning of the product quality profile. (C) Estimates impacting G1F and Man5 species. (D) Estimates impacting G0, G1, G1ʹ, and G1F’ species. (E) Estimates impacting G0F species.
Figure 6.
Figure 6.
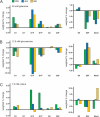
A) Weighted percent changes for a targeted glycosylation profile tuning experiment, across three different cell lineages expressing different mAbs. Experiment 30 contains glucosamine, ManNAc, manganese, and copper. Note that both valence and magnitude of the effects are largely consistent among the three cell lines. (B) Weighted percent changes for another targeted glycosylation profile tuning experiment. Experiment 01 contains uridine, fucose, manganese and copper. Note that for most profile attributes deflections from control are consistent between cell lines and mAbs in valence but not necessarily in magnitude. Of note, the deflection of Man5 is starkly different between cell lines.
Figure 7.
Figure 7.
A) Weighted percent changes from control profile for 20 mM galactose feeding on three different cell lineages producing different mAbs (2D9, 404, and 386). Note that for all profile attributes deflections from control are consistent between cell lines and mAbs, with respect to their valence. Differences in effect magnitudes exist between cell lines. (B) Weighted percent changes from control profile for 12.5 mM glucosamine feeding. Note that for all profile attributes deflections from control are consistent between cell lines and mAbs, with respect to their valence. Differences in effect magnitudes exist between cell lines. (C) Weighted percent changes from control profile for 7.5 mM uridine. Note that uridine has dramatically different effects on G1F, G1F’, G0 and Man5 species across cell lines.
Figure 8.
Figure 8.
A) Glycosylation profile of 2D9 cells under control conditions at different development scales; 24W-DW, 24-well deep well; SF, shake flasks; 2L BRx, 2 L single-use bioreactors; AMBR, AMBR-15 cell culture system. Error bars represent standard deviation of the means of at least three vessels. (B) Targeted experiment to modulate glycosylation profile. Weighted percent change is shown for the same experiment across development scales.

Similar articles

Cited by

References

    1. Hossler P, Khattak SF, Li ZJ.. Optimal and consistent protein glycosylation in mammalian cell culture. Glycobiology. 2009;19(9):936–949. doi:10.1093/glycob/cwp079. - DOI - PubMed
    1. Butler M. Optimisation of the cellular metabolism of glycosylation for recombinant proteins produced by mammalian cell systems. Cytotechnology. 2006;50(1–3):57–76. doi:10.1007/s10616-005-4537-x. - DOI - PMC - PubMed
    1. Boyd PN, Lines AC, Patel AK. The effect of the removal of sialic acid, galactose and total carbohydrate on the functional activity of Campath-1H. Mol Immunol. 1995;32(17–18):1311–1318. doi:10.1016/0161-5890(95)00118-2. - DOI - PubMed
    1. Shields RL, Lai J, Keck R, O’Connell LY, Hong K, Gloria Meng Y, Weikert SHA, Presta LG. Lack of fucose on human IgG1 N-linked oligosaccharide improves binding to human FcγRIII and antibody-dependent cellular toxicity. J Biol Chem. 2002;277(30):26733–26740. doi:10.1074/jbc.M202069200. - DOI - PubMed
    1. Shinkawa T, Nakamura K, Yamane N, Shoji-Hosaka E, Kanda Y, Sakurada M, Uchida K, Anazawa H, Satoh M, Yamasaki M, et al. The absence of fucose but not the presence of galactose or bisecting N-acetylglucosamine of human IgG1 complex-type oligosaccharides shows the critical role of enhancing antibody-dependent cellular cytotoxicity. J Biol Chem. 2003;278(5):3466–3473. doi:10.1074/jbc.M210665200. - DOI - PubMed