

Diagnostic Assessment of Assumptions for External Validity: An Example Using Data in Metastatic Colorectal Cancer
- PMID: 30252687
- PMCID: PMC6269648
- DOI: 10.1097/EDE.0000000000000926
Diagnostic Assessment of Assumptions for External Validity: An Example Using Data in Metastatic Colorectal Cancer
Abstract
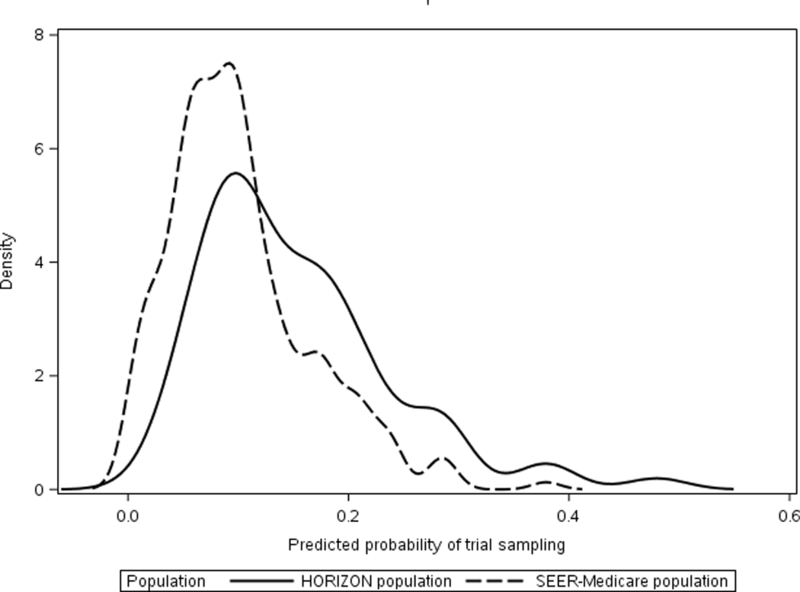
Background: Methods developed to estimate intervention effects in external target populations assume that all important effect measure modifiers have been identified and appropriately modeled. Propensity score-based diagnostics can be used to assess the plausibility of these assumptions for weighting methods.
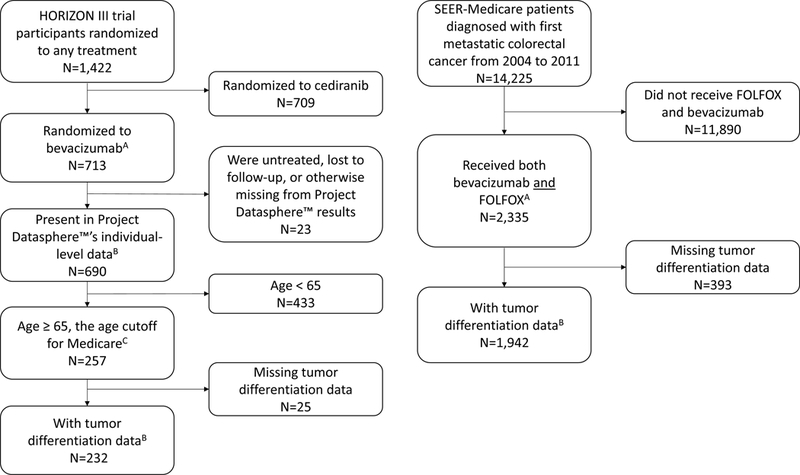
Methods: We demonstrate the use of these diagnostics when assessing the transportability of treatment effects from the standard of care for metastatic colorectal cancer control arm in a phase III trial (HORIZON III) to a target population of 1,942 Medicare beneficiaries age 65+ years.
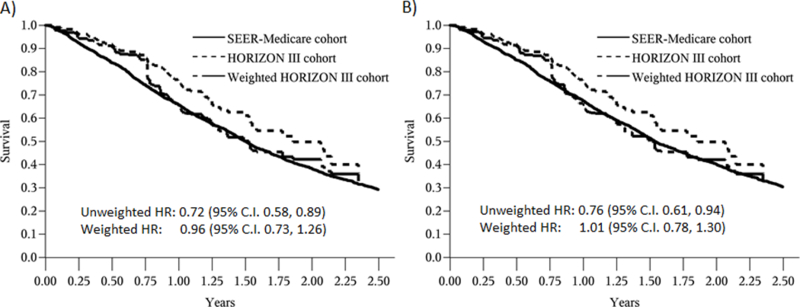
Results: In an unadjusted comparison, control arm participants had lower mortality compared with target population patients treated with the standard of care therapy (trial vs. target hazard ratio [HR] = 0.72, 95% confidence interval [CI], 0.58, 0.89). Applying inverse odds of sampling weights attenuated the trial versus target HR (weighted HR = 0.96, 95% CI = 0.73, 1.26). However, whether unadjusted or weighted, hazards did not appear proportional. At 6 months of follow-up, mortality was lower in the weighted trial population than the target population (weighted trial vs. target risk difference [RD] = -0.07, 95% CI = -0.13, -0.01), but not at 12 months (weighted RD = 0.00, 95% CI = -0.09, 0.09).
Conclusion: These diagnostics suggest that direct transport of treatment effects from HORIZON III to the Medicare population is not valid. However, the proposed sampling model might allow valid transport of the treatment effects on longer-term mortality from HORIZON III to the Medicare population treated in clinical practice. See video abstract at, http://links.lww.com/EDE/B435.
Conflict of interest statement
No other potential conflicts of interest were reported by the authors.
Figures
Similar articles
-
Reweighting Oranges to Apples: Transported RE-LY Trial Versus Nonexperimental Effect Estimates of Anticoagulation in Atrial Fibrillation.Epidemiology. 2020 Sep;31(5):605-613. doi: 10.1097/EDE.0000000000001230. Epidemiology. 2020. PMID: 32740469
-
Propensity Score Weighting Using Overlap Weights: A New Method Applied to Regorafenib Clinical Data and a Cost-Effectiveness Analysis.Value Health. 2019 Dec;22(12):1370-1377. doi: 10.1016/j.jval.2019.06.010. Epub 2019 Aug 20. Value Health. 2019. PMID: 31806193
-
A Population-Based Cohort Analysis of Chemoradiation Versus Radiation Alone for Definitive Treatment of Stage I Anal Cancer in Older Patients.Dis Colon Rectum. 2018 Jul;61(7):787-794. doi: 10.1097/DCR.0000000000001103. Dis Colon Rectum. 2018. PMID: 29771796 Free PMC article.
-
Bevacizumab in combination with fluoropyrimidine-based chemotherapy for the first-line treatment of metastatic colorectal cancer.Health Technol Assess. 2010 Oct;14(Suppl. 2):47-53. doi: 10.3310/hta14suppl2/07. Health Technol Assess. 2010. PMID: 21047491 Review.
-
Survival Advantage of Laparoscopic Versus Open Resection For Colorectal Liver Metastases: A Meta-analysis of Individual Patient Data From Randomized Trials and Propensity-score Matched Studies.Ann Surg. 2020 Aug;272(2):253-265. doi: 10.1097/SLA.0000000000003672. Ann Surg. 2020. PMID: 32675538 Review.
Cited by
-
Reweighting Randomized Controlled Trial Evidence to Better Reflect Real Life - A Case Study of the Innovative Medicines Initiative.Clin Pharmacol Ther. 2020 Oct;108(4):817-825. doi: 10.1002/cpt.1854. Epub 2020 May 30. Clin Pharmacol Ther. 2020. PMID: 32301116 Free PMC article.
-
Visualizing External Validity: Graphical Displays to Inform the Extension of Treatment Effects from Trials to Clinical Practice.Epidemiology. 2024 Mar 1;35(2):241-251. doi: 10.1097/EDE.0000000000001694. Epub 2023 Jan 30. Epidemiology. 2024. PMID: 38290143 Free PMC article.
-
A sibling study of the prenatal and perinatal risks for cerebral palsy.Pediatr Res. 2025 May 2. doi: 10.1038/s41390-025-04055-4. Online ahead of print. Pediatr Res. 2025. PMID: 40316681
-
Target validity: Bringing treatment of external validity in line with internal validity.Curr Epidemiol Rep. 2020 Sep;7(3):117-124. doi: 10.1007/s40471-020-00239-0. Epub 2020 Jun 30. Curr Epidemiol Rep. 2020. PMID: 33585162 Free PMC article.
-
Two-stage matching-adjusted indirect comparison.BMC Med Res Methodol. 2022 Aug 8;22(1):217. doi: 10.1186/s12874-022-01692-9. BMC Med Res Methodol. 2022. PMID: 35941551 Free PMC article.
References
-
- Sesso HD, Gaziano JM, VanDenburgh M, Hennekens CH, Glynn RJ, Buring JE. Comparison of baseline characteristics and mortality experience of participants and nonparticipants in a randomized clinical trial: the Physicians’ Health Study. Controlled Clinical Trials. 2002;23(6):686–702. - PubMed
Publication types
MeSH terms
Grants and funding
LinkOut - more resources
Full Text Sources
Other Literature Sources
Medical
Miscellaneous
