

Humidity as a non-pharmaceutical intervention for influenza A
- PMID: 30252890
- PMCID: PMC6155525
- DOI: 10.1371/journal.pone.0204337
Humidity as a non-pharmaceutical intervention for influenza A
Abstract
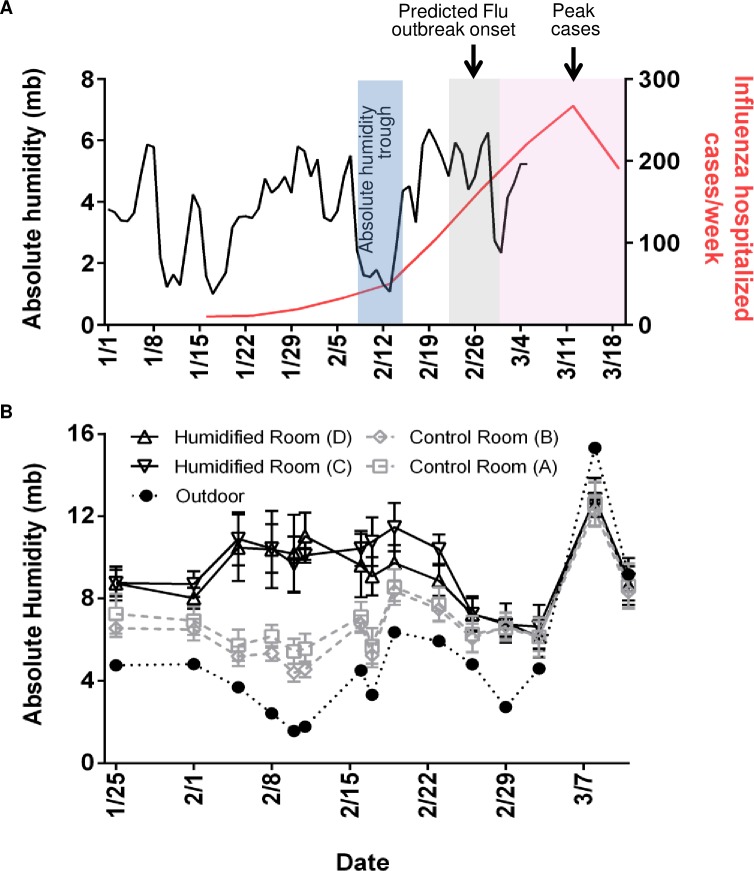
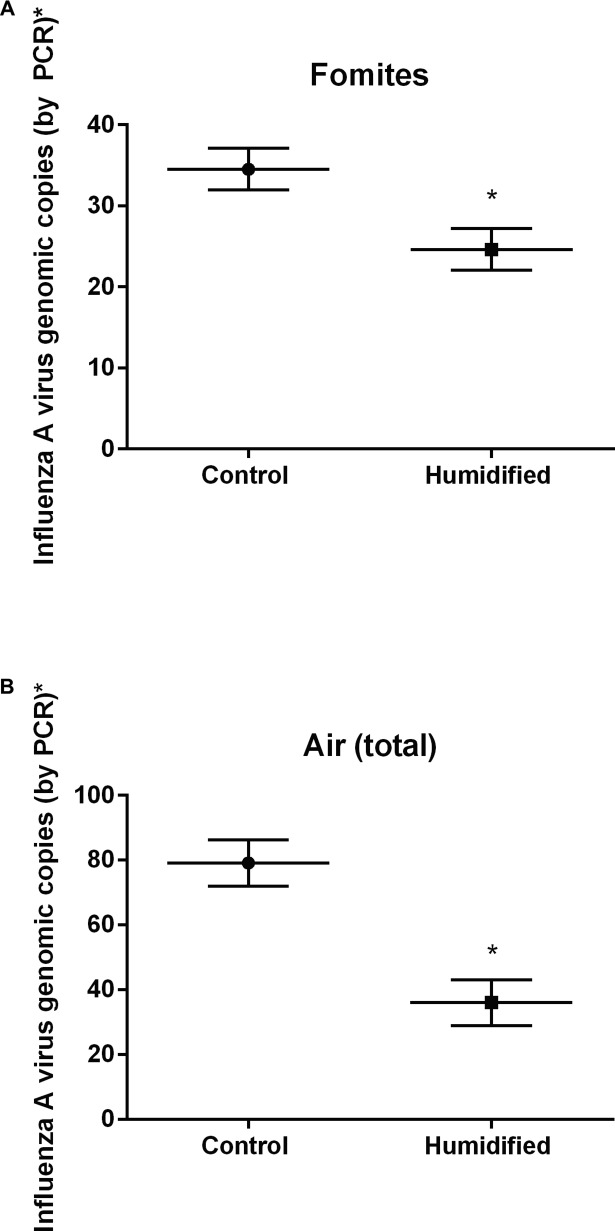
Influenza is a global problem infecting 5-10% of adults and 20-30% of children annually. Non-pharmaceutical interventions (NPIs) are attractive approaches to complement vaccination in the prevention and reduction of influenza. Strong cyclical reduction of absolute humidity has been associated with influenza outbreaks in temperate climates. This study tested the hypothesis that raising absolute humidity above seasonal lows would impact influenza virus survival and transmission in a key source of influenza virus distribution, a community school. Air samples and objects handled by students (e.g. blocks and markers) were collected from preschool classrooms. All samples were processed and PCR used to determine the presence of influenza virus and its amount. Additionally samples were tested for their ability to infect cells in cultures. We observed a significant reduction (p < 0.05) in the total number of influenza A virus positive samples (air and fomite) and viral genome copies upon humidification as compared to control rooms. This suggests the future potential of artificial humidification as a possible strategy to control influenza outbreaks in temperate climates. There were 2.3 times as many ILI cases in the control rooms compared to the humidified rooms, and whether there is a causal relationship, and its direction between the number of cases and levels of influenza virus in the rooms is not known. Additional research is required, but this is the first prospective study suggesting that exogenous humidification could serve as a scalable NPI for influenza or other viral outbreaks.
Conflict of interest statement
Phil Lilja is employed by DriSteem, a manufacturer of commercial humidification equipment. This does not alter our adherence to PLOS ONE policies on sharing data and materials.
Figures
References
-
- WHO. Influenza (Seasonal) Fact Sheet N°211. 2014. [updated March 2014; cited 2015 October 15]. Available from: http://www.who.int/mediacentre/factsheets/fs211/en/.
-
- Minnesota Department of Health Weekly Influenza & Respiratory Illness Activity Report- Summary of 2014–15 Influenza Season. 2015. [updated October 6, 2016; cited 2015 September 10]. Available from: http://www.health.state.mn.us/divs/idepc/diseases/flu/stats/2014summary.pdf.
Publication types
MeSH terms
Grants and funding
LinkOut - more resources
Full Text Sources
Other Literature Sources
Medical
