Comparative Study
. 2018 Sep 25;13(9):e0204629.
doi: 10.1371/journal.pone.0204629. eCollection 2018.

Deciphering intra-species bacterial diversity of meat and seafood spoilage microbiota using gyrB amplicon sequencing: A comparative analysis with 16S rDNA V3-V4 amplicon sequencing

Affiliations
Comparative Study

Deciphering intra-species bacterial diversity of meat and seafood spoilage microbiota using gyrB amplicon sequencing: A comparative analysis with 16S rDNA V3-V4 amplicon sequencing

Simon Poirier et al. PLoS One. .

Abstract

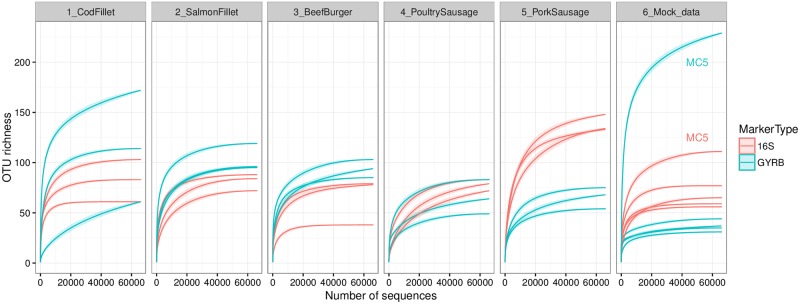
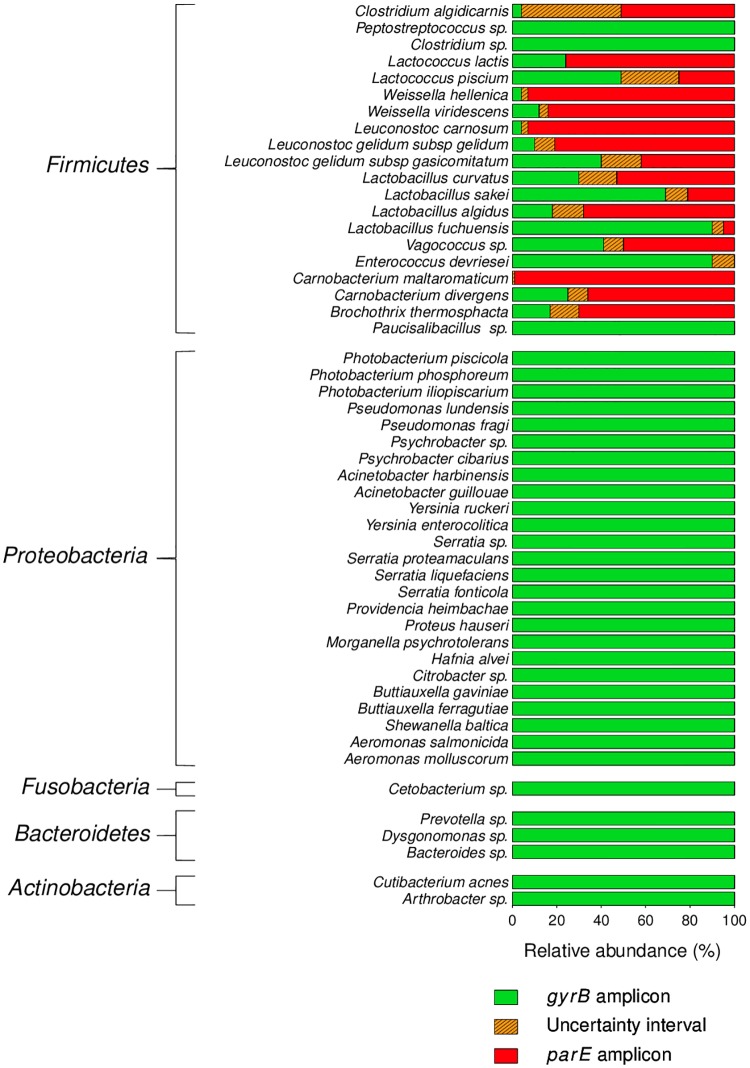
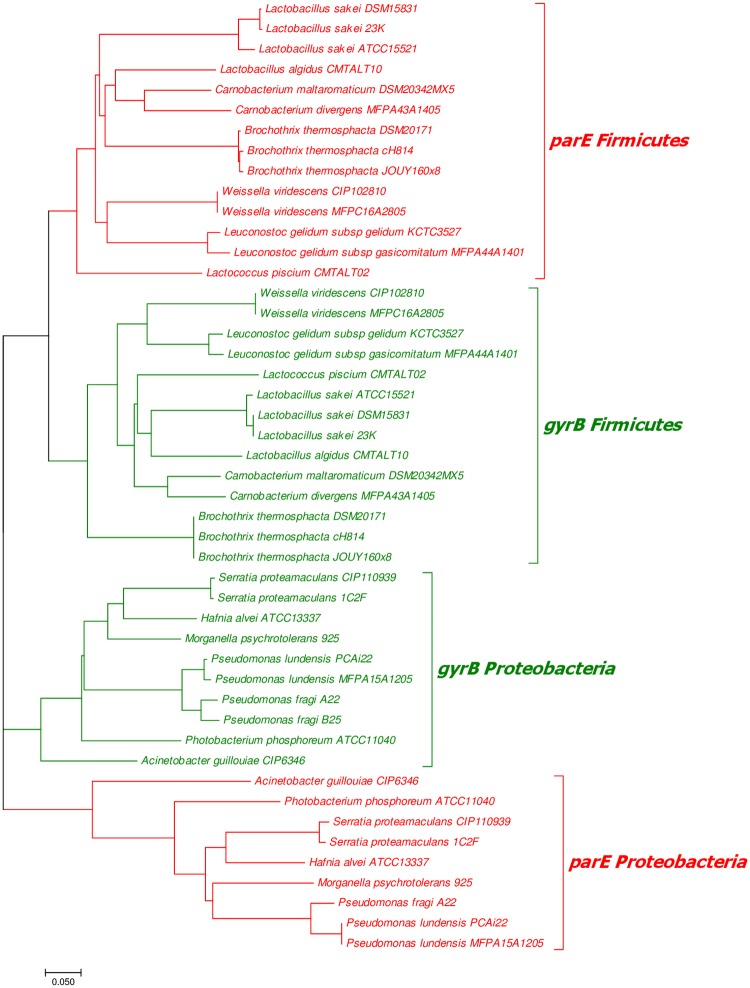
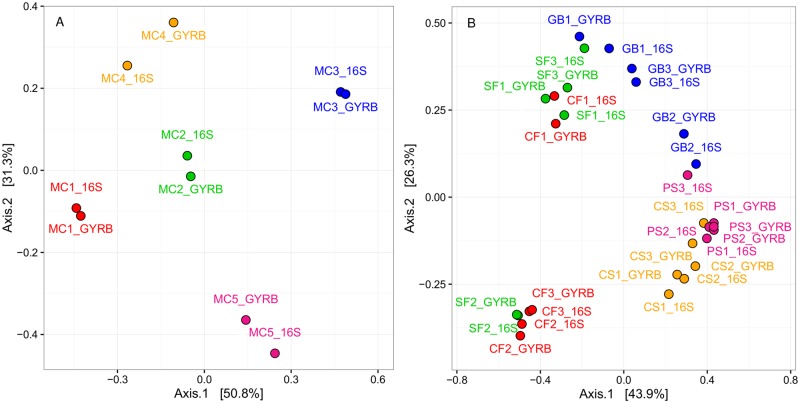
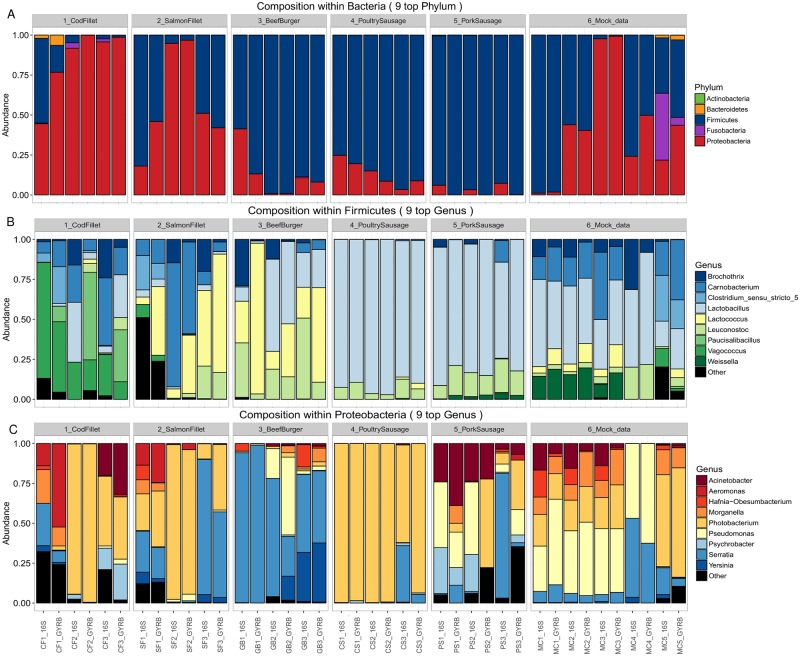
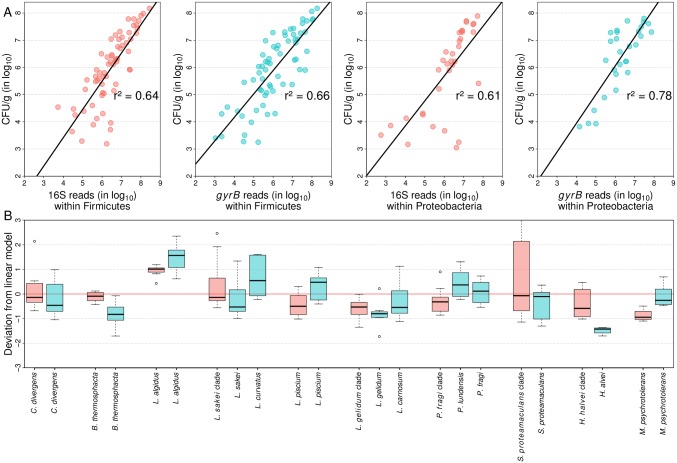
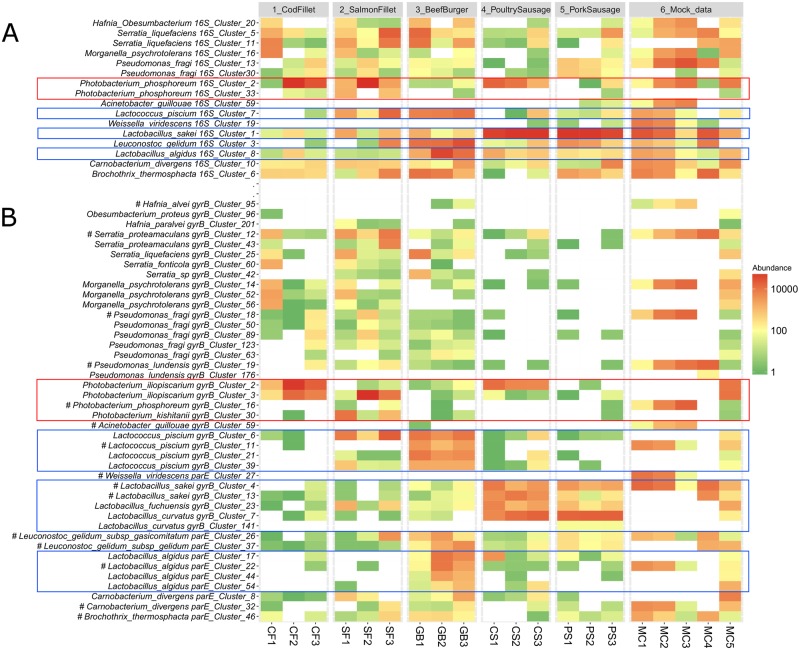
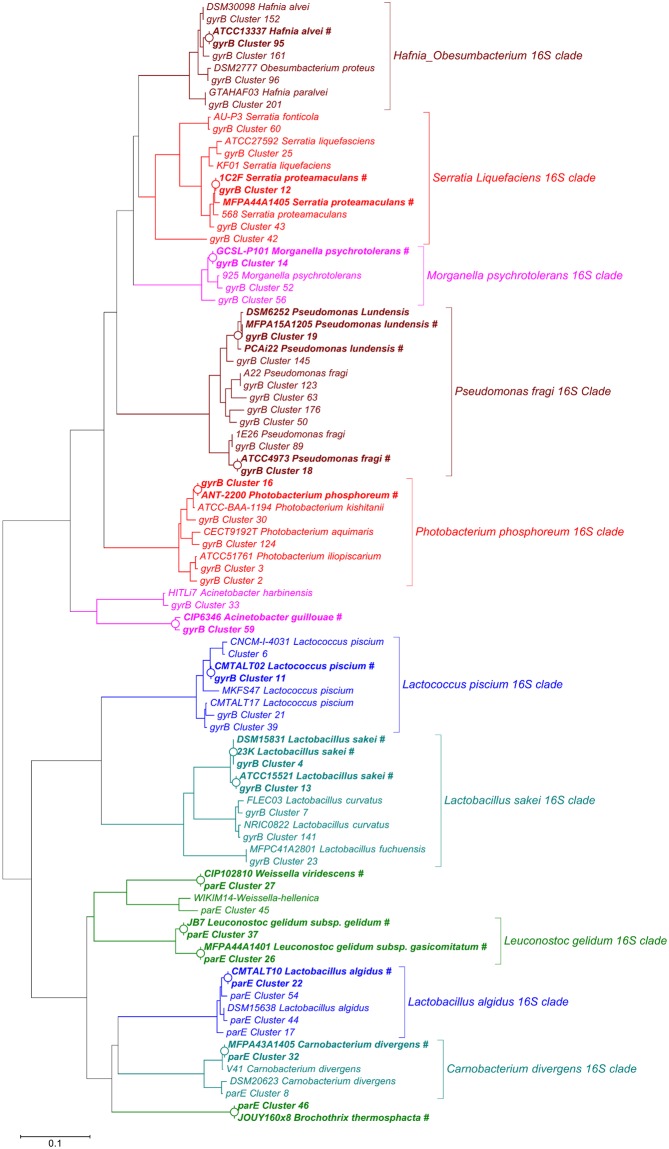
Meat and seafood spoilage ecosystems harbor extensive bacterial genomic diversity that is mainly found within a small number of species but within a large number of strains with different spoilage metabolic potential. To decipher the intraspecies diversity of such microbiota, traditional metagenetic analysis using the 16S rRNA gene is inadequate. We therefore assessed the potential benefit of an alternative genetic marker, gyrB, which encodes the subunit B of DNA gyrase, a type II DNA topoisomerase. A comparison between 16S rDNA-based (V3-V4) amplicon sequencing and gyrB-based amplicon sequencing was carried out in five types of meat and seafood products, with five mock communities serving as quality controls. Our results revealed that bacterial richness in these mock communities and food samples was estimated with higher accuracy using gyrB than using16S rDNA. However, for Firmicutes species, 35% of putative gyrB reads were actually identified as sequences of a gyrB paralog, parE, which encodes subunit B of topoisomerase IV; we therefore constructed a reference database of published sequences of both gyrB and pare for use in all subsequent analyses. Despite this co-amplification, the deviation between relative sequencing quantification and absolute qPCR quantification was comparable to that observed for 16S rDNA for all the tested species. This confirms that gyrB can be used successfully alongside 16S rDNA to determine the species composition (richness and evenness) of food microbiota. The major benefit of gyrB sequencing is its potential for improving taxonomic assignment and for further investigating OTU richness at the subspecies level, thus allowing more accurate discrimination of samples. Indeed, 80% of the reads of the 16S rDNA dataset were represented by thirteen 16S rDNA-based OTUs that could not be assigned at the species-level. Instead, these same clades corresponded to 44 gyrB-based OTUs, which differentiated various lineages down to the subspecies level. The increased ability of gyrB-based analyses to track and trace phylogenetically different groups of strains will generate improved resolution and more reliable results for studies of the strains implicated in food processes.


Conflict of interest statement

The authors have declared that no competing interests exist.

Figures

Fig 1
Fig 1. Rarefaction curves obtained from16S rDNA and gyrB amplicon sequencing of the three repeats for each food sample and the five mock communities.
The x-axis represents the sequencing depth in number of reads while the y-axis represents an estimation of the OTU richness detected. Samples are presented separately, with each panel representing data from one food type or the mock communities. Rarefaction curves for the MC5 community are specifically indicated on the far-right panel.
Fig 2
Fig 2. Relative abundance of gyrB and parE sequences assigned to the fifty most-abundant genera recovered in the food samples and mock communities.
The limits of the uncertainty intervals correspond to the upper and lower standard deviation of the average proportion of gyrB reads obtained across the various samples in which each taxon was detected.
Fig 3
Fig 3. Unrooted phylogenetic tree constructed with the partial gyrB and parE sequences extracted from the genomes of bacterial species present in the mock communities.
Branch length scale indicates the number of nucleotide substitutions per site. The tree is divided into three main branches: parE genes from Proteobacteria, gyrB genes from Proteobacteria, and parE/gyrB genes from Firmicutes. The two sub-branches discriminating between parE and gyrB genes from Firmicutes are equally distant from the gyrB branch of Proteobacteria.
Fig 4
Fig 4. Principal coordinates analyses (PCoAs) based on Bray-Curtis distances among communities recovered by16S rRNA and gyrB gene sequencing of (A) mock communities and (B) food samples.
All OTUs within the communities were identified to the level of genus. The first and second axes of the PCoA performed for MC samples explained a high degree of the influence of OTUs on communities, with respectively 50.8% and 31.3% of the total variance. Similarly, the first and second axes of the PCoA performed on food sample communities explained, respectively, 43.9% and 26.3% of the total variance.
Fig 5
Fig 5. Composition plots of relative abundances of OTUs generated by 16S rRNA and gyrB sequencing (A) within Bacteria at the phylum level, (B) within Firmicutes at genus level, and (C) within Proteobacteria at genus level.
Samples from a given food product are presented together (subpanels within A-C) and the two marker analyses for each sample are presented next to each other. Within each panel, the ratio of each taxon was estimated from the sum of all taxa (within all phyla, within Firmicutes, or within Proteobacteria, respectively).
Fig 6
Fig 6. Comparative analysis of quantification of bacterial species by qPCR versus the estimated absolute number of reads obtained by amplicon sequencing.
(A) Results obtained with 16S rDNA and gyrB amplicon sequencing are shown in the upper plots (in pink and cyan, respectively) with data separated by phylum: Firmicutes (left) and Proteobacteria (right). (B) Boxplot showing the deviation from the linear regression model of the quantification obtained with 16S rDNA (pink) or gyrB (dark cyan) for several bacterial species in the food samples. For the purpose of quantification of the 16S rDNA data, species were merged to genus or broad infra-genus phylogenetic clades because the obtained OTUs could only be assigned to these levels (see main text on subspecies-level bacterial richness).
Fig 7
Fig 7. Heatmap showing the ability of (A) 16S rDNA and (B) gyrB amplicon analysis to estimate intraspecies population levels.
Samples are ordered from left to right according to the sample type. The scale on the right of the heatmap depicts the color palette associated with the relative numbers of reads of the various OTUs. OTUs are labeled with their cluster number and the taxonomic assignment at the species level. The gyrB/parE OTUs associated with the strains used in the mock communities are labeled with (#). Boxes are drawn around the main phylogenetic clades that are detailed in the text.
Fig 8
Fig 8. Unrooted neighbor-joining phylogenetic tree showing the evolutionary relationship between gyrB or parE sequences from OTUs in the current study and those from the published genomes of sequenced strains.
OTUs are labeled with their cluster numbers; sequences extracted from published genomes are labeled with the strain name followed by the species name. Strains used in the mock communities are indicated in bold type and tagged with (#). The tree nodes where OTUs and strain sequences cluster are indicated by an open circle (O). Brackets drawn on the right of major gyrB/parE clades indicate the identities of the corresponding 16S phylogenetic clades.

References

    1. Chaillou S, Chaulot-Talmon A, Caekebeke H, Cardinal M, Christieans S, Denis C, et al. Origin and ecological selection of core and food-specific bacterial communities associated with meat and seafood spoilage. The ISME journal. 2015;9(5):1105–18. 10.1038/ismej.2014.202 - DOI - PMC - PubMed
    1. Pothakos V, Devlieghere F, Villani F, Bjorkroth J, Ercolini D. Lactic acid bacteria and their controversial role in fresh meat spoilage. Meat science. 2015;109:66–74. 10.1016/j.meatsci.2015.04.014 - DOI - PubMed
    1. Ercolini D. High-throughput sequencing and metagenomics: moving forward in the culture-independent analysis of food microbial ecology. Applied and environmental microbiology. 2013;79(10):3148–55. 10.1128/AEM.00256-13 - DOI - PMC - PubMed
    1. Doulgeraki AI, Ercolini D, Villani F, Nychas GJ. Spoilage microbiota associated to the storage of raw meat in different conditions. International journal of food microbiology. 2012;157(2):130–41. 10.1016/j.ijfoodmicro.2012.05.020 - DOI - PubMed
    1. Nieminen TT, Koskinen K, Laine P, Hultman J, Sade E, Paulin L, et al. Comparison of microbial communities in marinated and unmarinated broiler meat by metagenomics. International journal of food microbiology. 2012;157(2):142–9. 10.1016/j.ijfoodmicro.2012.04.016 - DOI - PubMed

Publication types

MeSH terms

LinkOut - more resources