

HDAC2 dysregulation in the nucleus basalis of Meynert during the progression of Alzheimer's disease
- PMID: 30252960
- PMCID: PMC6433556
- DOI: 10.1111/nan.12518
HDAC2 dysregulation in the nucleus basalis of Meynert during the progression of Alzheimer's disease
Abstract
Aims: Alzheimer's disease (AD) is characterized by degeneration of cholinergic basal forebrain (CBF) neurons in the nucleus basalis of Meynert (nbM), which provides the major cholinergic input to the cortical mantle and is related to cognitive decline in patients with AD. Cortical histone deacetylase (HDAC) dysregulation has been associated with neuronal degeneration during AD progression. However, whether HDAC alterations play a role in CBF degeneration during AD onset is unknown. We investigated global HDAC protein levels and nuclear HDAC2 immunoreactivity in tissue containing the nbM, changes and their association with neurofibrillary tangles (NFTs) during the progression of AD.
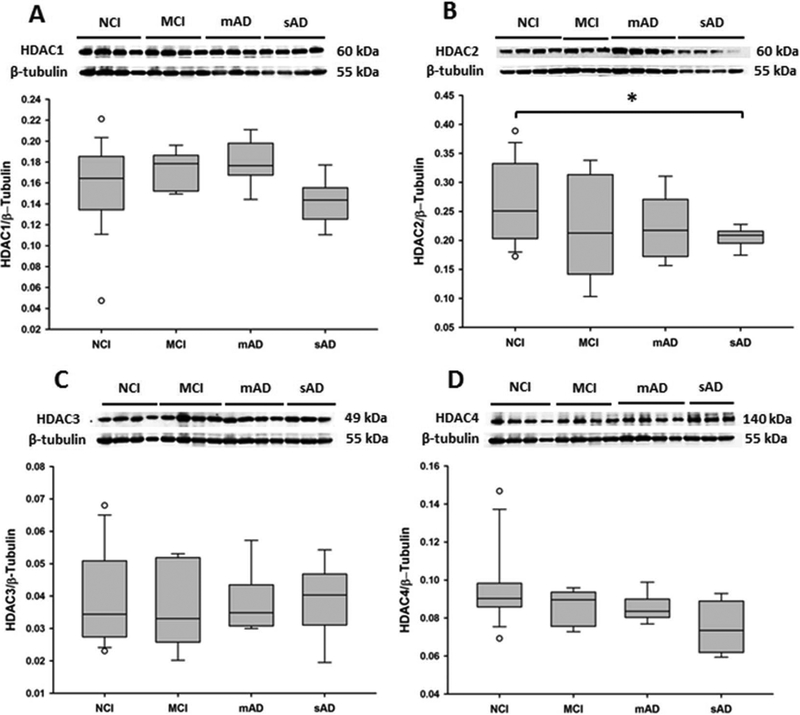
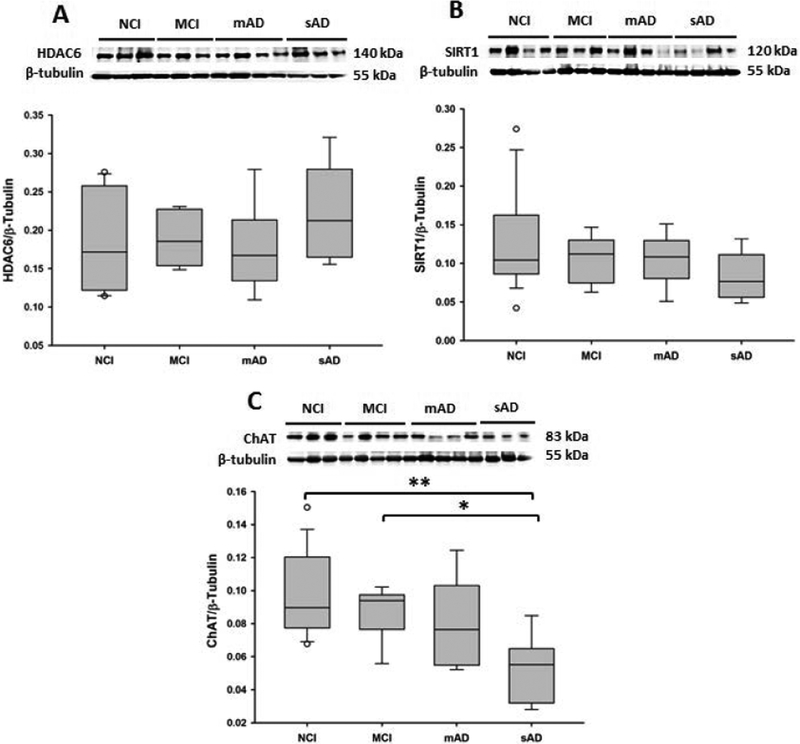
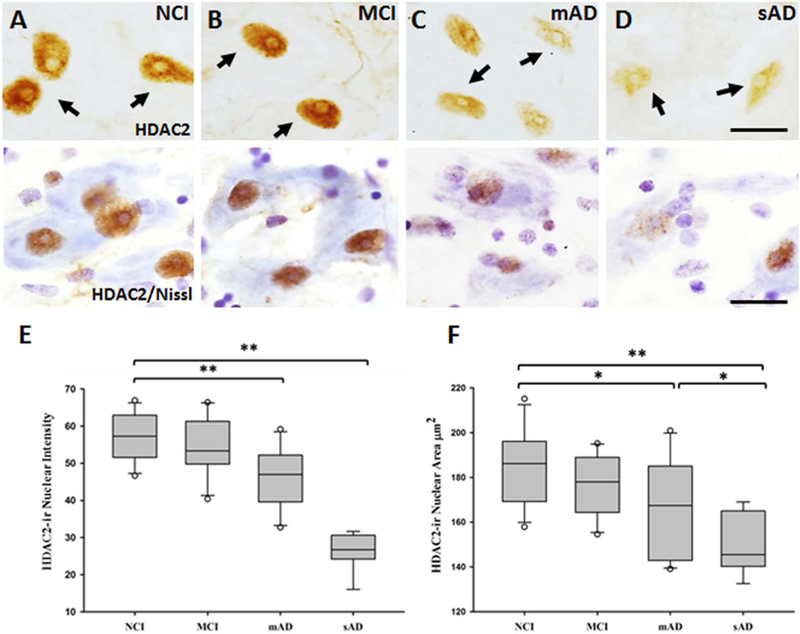
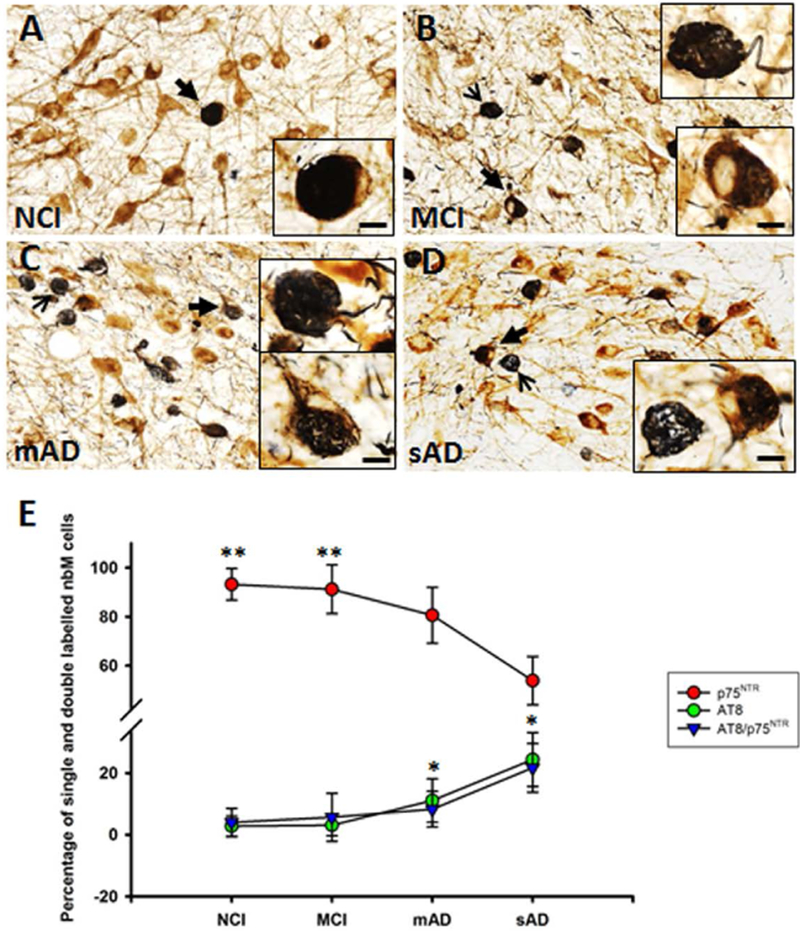
Methods: We used semi-quantitative western blotting and immunohistochemistry to evaluate HDAC and sirtuin (SIRT) levels in individuals that died with a premortem clinical diagnosis of no cognitive impairment (NCI), mild cognitive impairment (MCI), mild/moderate AD (mAD) or severe AD (sAD). Quantitative immunohistochemistry was used to identify HDAC2 protein levels in individual cholinergic nbM nuclei and their colocalization with the early phosphorylated tau marker AT8, the late-stage apoptotic tau marker TauC3 and Thioflavin-S, a marker of β-pleated sheet structures in NFTs.
Results: In AD patients, HDAC2 protein levels were dysregulated in the basal forebrain region containing cholinergic neurons of the nbM. HDAC2 nuclear immunoreactivity was reduced in individual cholinergic nbM neurons across disease stages. HDAC2 nuclear reactivity correlated with multiple cognitive domains and with NFT formation.
Conclusions: These findings suggest that HDAC2 dysregulation contributes to cholinergic nbM neuronal dysfunction, NFT pathology, and cognitive decline during clinical progression of AD.
Keywords: Alzheimer's disease; basal forebrain; epigenetics; mild cognitive impairment; neurofibrillary tangles; nucleus basalis of Meynert.
© 2018 British Neuropathological Society.
Figures

Similar articles
-
Pretangle pathology within cholinergic nucleus basalis neurons coincides with neurotrophic and neurotransmitter receptor gene dysregulation during the progression of Alzheimer's disease.Neurobiol Dis. 2018 Sep;117:125-136. doi: 10.1016/j.nbd.2018.05.021. Epub 2018 May 31. Neurobiol Dis. 2018. PMID: 29859871 Free PMC article.
-
Protein homeostasis gene dysregulation in pretangle-bearing nucleus basalis neurons during the progression of Alzheimer's disease.Neurobiol Aging. 2016 Jun;42:80-90. doi: 10.1016/j.neurobiolaging.2016.02.031. Epub 2016 Mar 8. Neurobiol Aging. 2016. PMID: 27143424 Free PMC article.
-
Tau Oligomer Pathology in Nucleus Basalis Neurons During the Progression of Alzheimer Disease.J Neuropathol Exp Neurol. 2018 Mar 1;77(3):246-259. doi: 10.1093/jnen/nlx120. J Neuropathol Exp Neurol. 2018. PMID: 29378005 Free PMC article.
-
The cholinergic system in aging and neuronal degeneration.Behav Brain Res. 2011 Aug 10;221(2):555-63. doi: 10.1016/j.bbr.2010.11.058. Epub 2010 Dec 9. Behav Brain Res. 2011. PMID: 21145918 Review.
-
Structural degeneration of the nucleus basalis of Meynert in mild cognitive impairment and Alzheimer's disease - Evidence from an MRI-based meta-analysis.Neurosci Biobehav Rev. 2023 Nov;154:105393. doi: 10.1016/j.neubiorev.2023.105393. Epub 2023 Sep 16. Neurosci Biobehav Rev. 2023. PMID: 37717861 Review.
Cited by
-
Sex-dependent effect of APOE on Alzheimer's disease and other age-related neurodegenerative disorders.Dis Model Mech. 2020 Aug 27;13(8):dmm045211. doi: 10.1242/dmm.045211. Dis Model Mech. 2020. PMID: 32859588 Free PMC article. Review.
-
Evaluation of animal model congruence to human depression based on large-scale gene expression patterns of the CNS.Sci Rep. 2022 Jan 7;12(1):108. doi: 10.1038/s41598-021-04020-1. Sci Rep. 2022. PMID: 34997033 Free PMC article.
-
The Epigenetics of Alzheimer's Disease: Factors and Therapeutic Implications.Front Genet. 2018 Nov 30;9:579. doi: 10.3389/fgene.2018.00579. eCollection 2018. Front Genet. 2018. PMID: 30555513 Free PMC article. Review.
-
Oxyresveratrol-β-cyclodextrin mitigates streptozotocin-induced Alzheimer's model cognitive impairment, histone deacetylase activity in rats: in silico & in vivo studies.Sci Rep. 2024 Apr 30;14(1):9897. doi: 10.1038/s41598-024-57188-7. Sci Rep. 2024. PMID: 38688962 Free PMC article.
-
CSF proteomic profiling with amyloid/tau positivity identifies distinctive sex-different alteration of multiple proteins involved in Alzheimer's disease.medRxiv [Preprint]. 2024 Mar 16:2024.03.15.24304164. doi: 10.1101/2024.03.15.24304164. medRxiv. 2024. PMID: 38559166 Free PMC article. Preprint.
References
-
- Mesulam MM, Mufson EJ, Wainer BH, Levey AI. Central cholinergic pathways in the rat: an overview based on an alternative nomenclature (Ch1-Ch6). Neuroscience. 1983;10(4):1185–201. Epub 1983/12/01. - PubMed
-
- Whitehouse PJ, Price DL, Clark AW, Coyle JT, DeLong MR. Alzheimer disease: evidence for selective loss of cholinergic neurons in the nucleus basalis. Annals of neurology. 1981;10(2):122–6. Epub 1981/08/01. - PubMed
-
- Etienne P, Robitaille Y, Wood P, Gauthier S, Nair NP, Quirion R. Nucleus basalis neuronal loss, neuritic plaques and choline acetyltransferase activity in advanced Alzheimer’s disease. Neuroscience. 1986;19(4):1279–91. Epub 1986/12/01. - PubMed
-
- Doucette R, Fisman M, Hachinski VC, Mersky H. Cell loss from the nucleus basalis of Meynert in Alzheimer’s disease. The Canadian journal of neurological sciences. 1986;13:435–40. - PubMed
-
- Rinne JO PL, Rinne UK. Neuronal size and density in the nucleus basalis of Meynert in Alzheimer’s disease. The Journal of Neurological Sciences. 1987;79:67–76. - PubMed
Publication types
MeSH terms
Substances
Grants and funding
LinkOut - more resources
Full Text Sources
Other Literature Sources
Medical
