. 2018 Sep 26;16(1):99.
doi: 10.1186/s12915-018-0566-8.

Synaptic coupling of inner ear sensory cells is controlled by brevican-based extracellular matrix baskets resembling perineuronal nets

Affiliations

Synaptic coupling of inner ear sensory cells is controlled by brevican-based extracellular matrix baskets resembling perineuronal nets

Mandy Sonntag et al. BMC Biol. .

Abstract

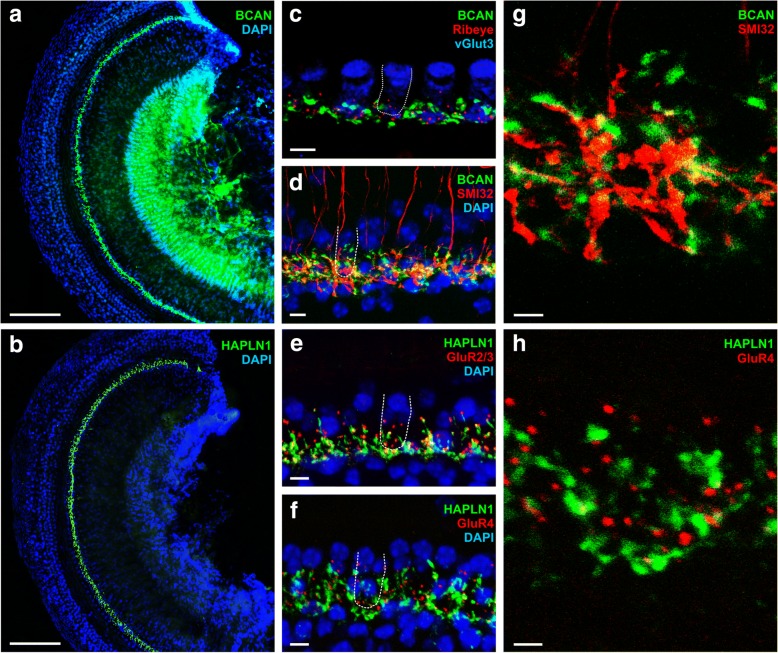
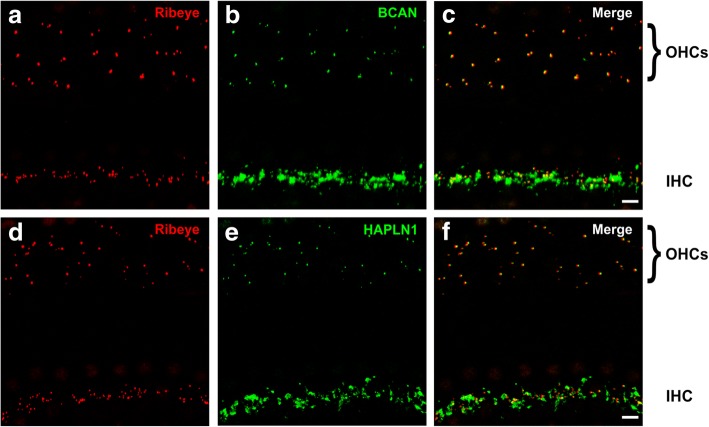
Background: Perineuronal nets (PNNs) are specialized aggregations of extracellular matrix (ECM) molecules surrounding specific neurons in the central nervous system (CNS). PNNs are supposed to control synaptic transmission and are frequently associated with neurons firing at high rates, including principal neurons of auditory brainstem nuclei. The origin of high-frequency activity of auditory brainstem neurons is the indefatigable sound-driven transmitter release of inner hair cells (IHCs) in the cochlea.

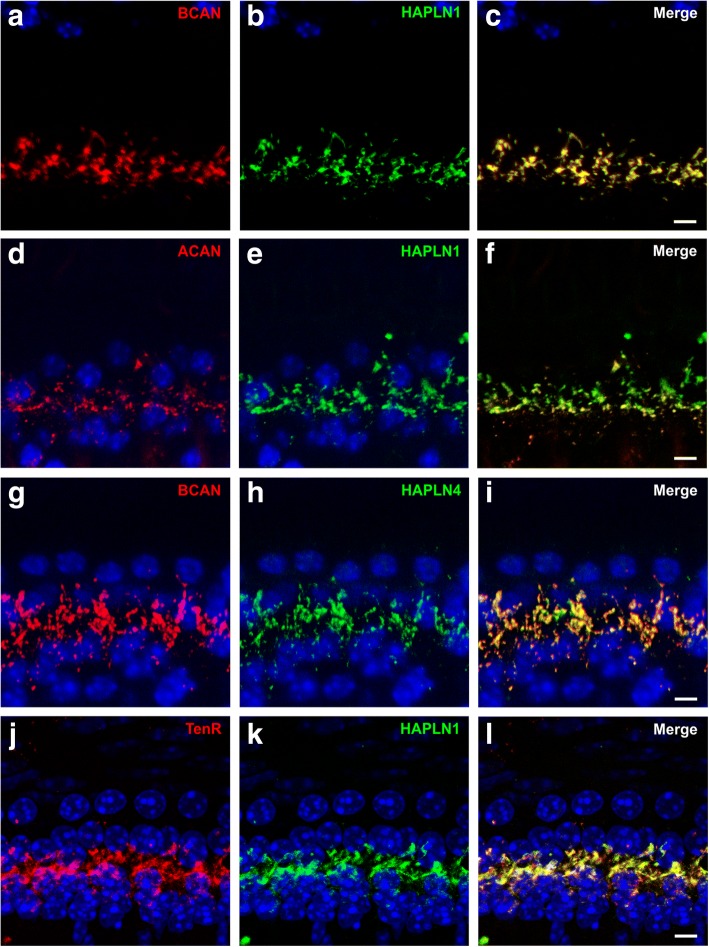
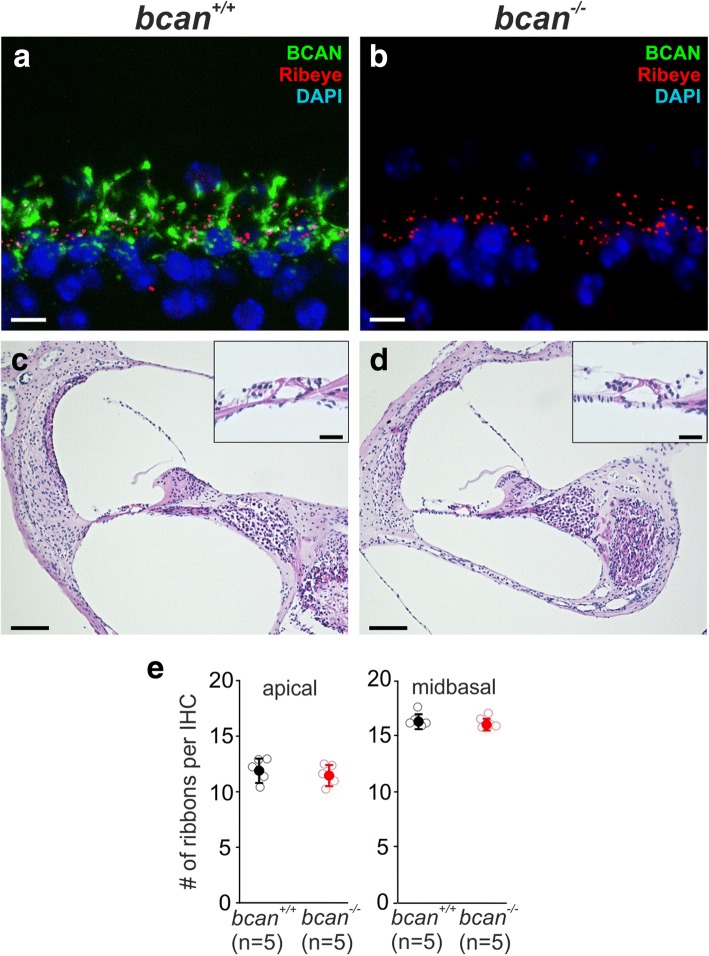
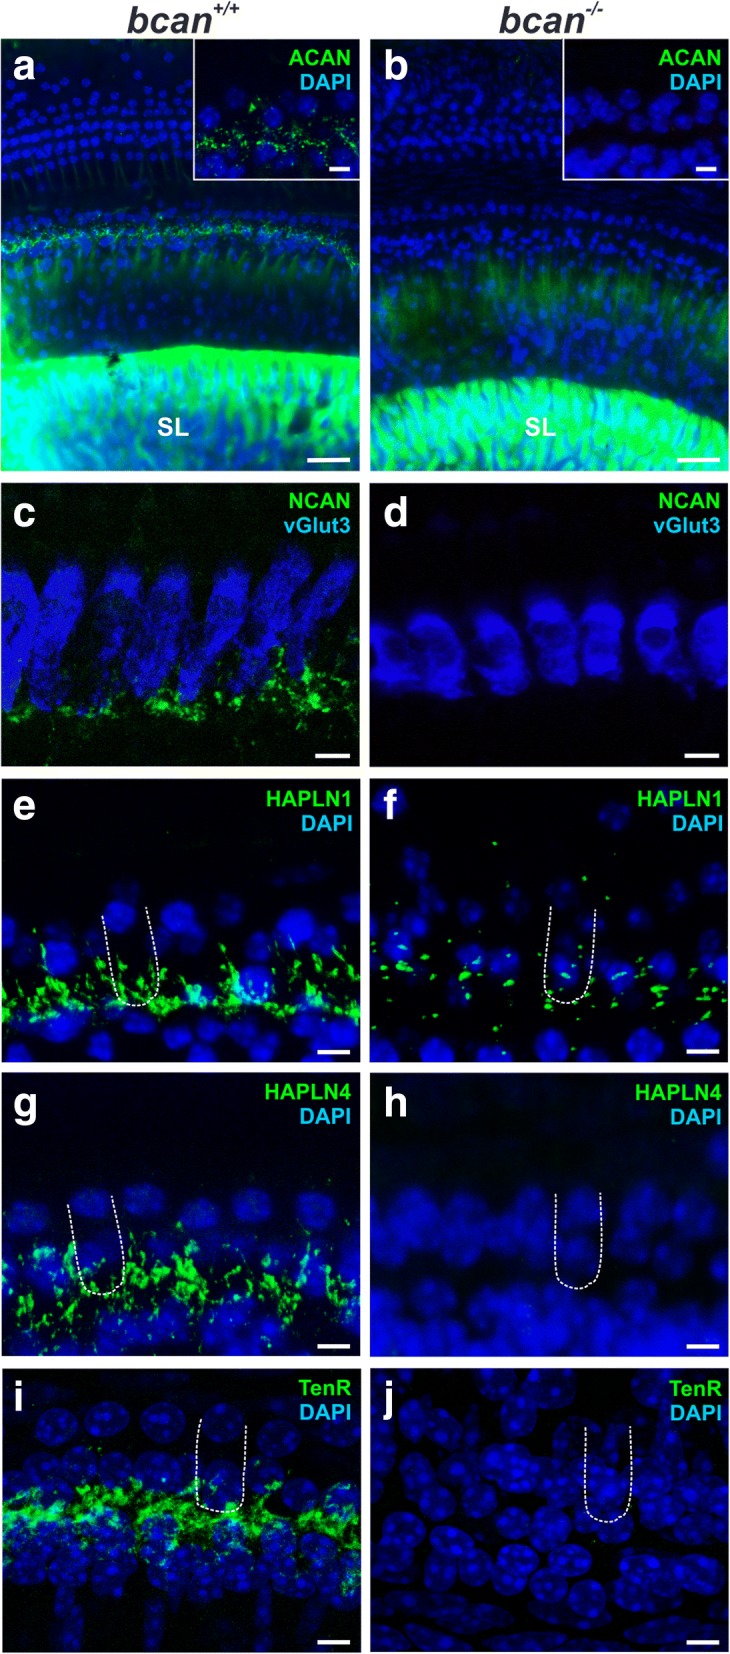
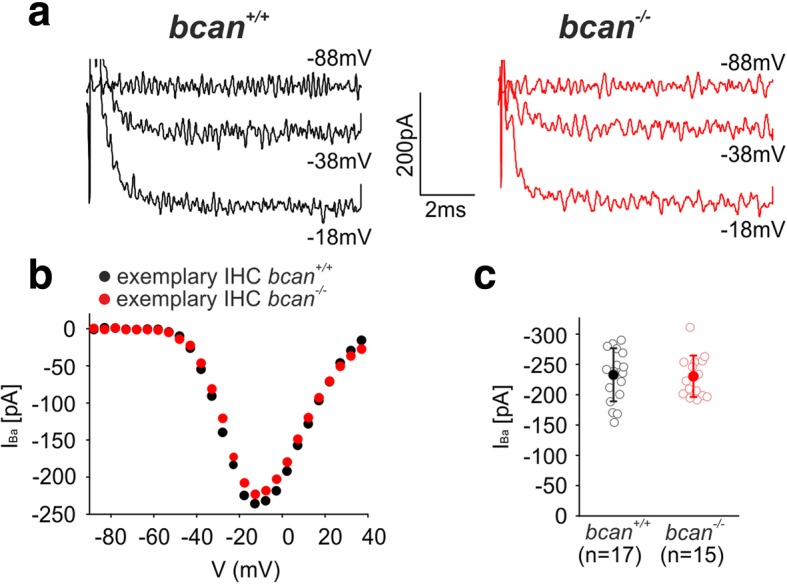
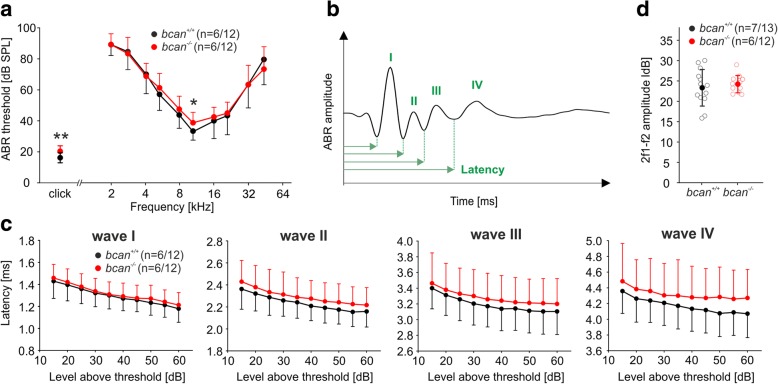
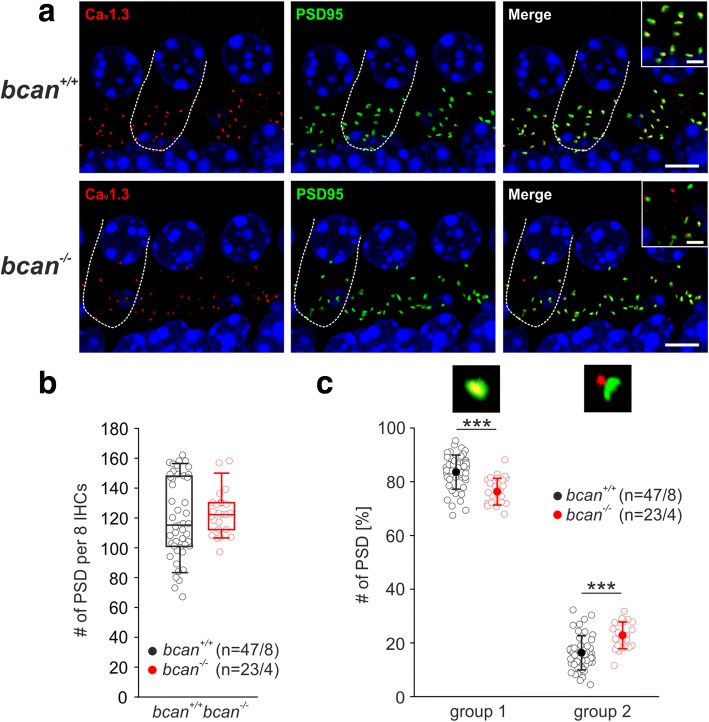
Results: Here, we show that synaptic poles of IHCs are ensheathed by basket-like ECM complexes formed by the same molecules that constitute PNNs of neurons in the CNS, including brevican, aggreccan, neurocan, hyaluronan, and proteoglycan link proteins 1 and 4 and tenascin-R. Genetic deletion of brevican, one of the main components, resulted in a massive degradation of ECM baskets at IHCs, a significant impairment in spatial coupling of pre- and postsynaptic elements and mild impairment of hearing.

Conclusions: These ECM baskets potentially contribute to control of synaptic transmission at IHCs and might be functionally related to PNNs of neurons in the CNS.

Keywords: Brevican; Cochlea; Extracellular matrix; Inner hair cell; Perineuronal net; Ribbon synapse.


Conflict of interest statement

Ethics approval

All experiments were carried out in accordance with the German law on the use of the laboratory animals and were approved by the Saxonian District Government, Leipzig (T27/16) and the regional board for scientific animal experiments of Saarland University.

Competing interests

The authors declare that they have no competing interests.

Publisher’s Note

Springer Nature remains neutral with regard to jurisdictional claims in published maps and institutional affiliations.

Figures

Fig. 1
Fig. 1
Immunohistochemical localization of chondroitin-sulfated proteoglycans (CSPGs) of the lectican family and hyaluronan and proteoglycan link protein 1 (HAPLN1) in cross-sections of the mouse cochlea. a and a′ The immunoreaction of the CSPG brevican (BCAN) was detected in a layer between the spiral ligament and the temporal bone and in the osseous spiral lamina between the spiral limbus and the auditory nerve. BCAN also appeared prominently at inner hair cells (IHC) (a′, magnification of white box in a). b and b′ Aggrecan (ACAN) labeling yields a strong immunosignal in the spiral limbus and partly in the spiral ligament. The magnification of the basilar membrane (b′, white box in b) reveals a weak staining of ACAN also at IHCs. c and c′ The immunohistochemical identification of neurocan (NCAN) resulted in a positive signal only at IHCs (c′, magnification of white box in c) while the rest of the cochlea seemed to be spared of NCAN. d and d′ HAPLN1 was detected in cochlear tissue in both the temporal bone and at IHCs (d′, magnification of white box in d). e Western blot analysis confirmed the presence of BCAN (~ 145 kDa full-length protein and 55 kDa fragment), ACAN (~ 450 kDa), NCAN (~ 150 kDa), HAPLN1 (~ 40 kDa), and HAPLN4 (~ 40–42 kDa) in the cochlear tissue of the mouse. Note that in a and a′, BCAN was labeled by a Cy3 secondary antibody. For better comparison the red color was switched to green. ad and a′d′ Maximum intensity projections of confocal stacks of cochlear cross-sections. ad, scale 100 μm. a′–d′, scale 10 μm
Fig. 2
Fig. 2
Localization of brevican and HAPLN1 in whole-mount preparations of the mouse cochlea. a, b Immunolabeling of brevican (BCAN, a) and HAPLN1 (b) revealed an extensive accumulation of these ECM molecules at IHCs. cf Double-immunolabeling with the Ribeye marker CtBP2 (red, c), the neurofilament marker SMI32 (red, d), and antibodies against GluR2/3 (red, e), and GluR4 (red, f) showed that brevican (green, c, d) and HAPLN1 (green, e, f) were expressed at the base of the IHCs in the region where the pre- and postsynaptic elements of IHC synapses are located. g, h Magnifications of indicated IHCs in d and f revealed a basket-like formation of ECM at IHCs, with brevican (green, g) tightly enclosing terminating fibers (SMI32, red, g) and HAPLN1 (green, h) forming gaps in which glutamate receptors are located (GluR4, red, h). a-h Maximum intensity projections of confocal stacks of whole-mount preparations from apical turns of organs of Corti. Nuclei are stained with DAPI (blue). In c, IHCs are marked with an anti-vGlut3 antibody (blue). In df, an exemplary IHC is indicated by the dashed outline. a, b Scale 100 μm. cf Scale 5 μm. g, h Scale 2 μm
Fig. 3
Fig. 3
Spatial relationship of brevican, aggrecan, HAPLN1, HAPLN4, and tenascin-R in whole-mount preparations of the mouse cochlea. ac The immunosignal of brevican (a, c, red) largely overlapped with that of HAPLN1 (b, c, green). d, e Double-staining of aggrecan (d, f red) and HAPLN1 (e, f green) also demonstrated a close spatial correlation between these ECM molecules. g-i Brevican immunoreactivity (g, i red) appeared to be almost completely colocalized with that of HAPLN4 (h, i green). jl Tenascin-R (TenR) immunoreactivity (j, l red) yielded large overlap with HAPLN1 immunoreactivity (k, l green). al Maximum intensity projections of confocal stacks of stretches of 5–6 IHCs from apical cochlear turns with the nuclei stained with DAPI (blue), scales 5 μm
Fig. 4
Fig. 4
Distribution of brevican and HAPLN1 at OHCs in whole-mount preparations of the mouse cochlea. ac Ribbon synapses in the three rows of OHCs and in the IHC row were labeled by the Ribeye marker CtBP2 (a, c, red). Besides its strong immunoreactivity in the IHC row, brevican occasionally also appeared in form of small punctae opposite to the ribbons of OHCs (b, c, green). df The labeling of HAPLN1 (e, f, green) also resulted in small immuno-positive punctae opposite to the ribbon synapses of OHCs (d, f, red). a-f Maximum intensity projections of confocal stacks of stretches of 5–6 IHCs from apical cochlear turns, scales 5 μm
Fig. 5
Fig. 5
General cochlear morphology of brevican-deficient (bcan−/−) mice. a, b Immunohistochemical verification of the presence of brevican (BCAN) in wildtype (bcan+/+) mouse cochleae (a, green) and of its absence in bcan−/− mouse cochleae (b, green). The ribbon synapses were labeled with the ribeye marker CtBP2 (a, b, red). Maximum intensity projections of confocal stacks of stretches of 5–6 IHCs of cochlear whole-mount preparations, scale 5 μm. c, d Hematoxylin-eosin staining of paraffin sections of bcan+/+ (c) and bcan−/− mouse cochleae (d) did not reveal any obvious differences in the general morphology of cochlear tissue. A higher magnification of the basilar membrane is depicted in the insets. Scale 100 μm, scale inset 25 μm. e Quantification of the number of ribbon synapses (CtBP2-positive punctae) per IHC in apical and midbasal cochlear turns did not yield any genotype-specific differences (apical, bcan+/+: 11.8 ± 1.1, n = 5/38 whole-mounts/IHCs, bcan−/−: 11.4 ± 0.9, n = 5/40, p = 0.524, t test; midbasal, bcan+/+: 16.3 ± 0.7, n = 5/43, bcan−/−: 16.1 ± 0.5, n = 5/41, p = 0.62, t test). Data are presented as mean ± S.D
Fig. 6
Fig. 6
Distribution of CSPGs, HAPLN1, HAPLN4 and tenascin-R in cochlear whole-mount preparations of bcan−/− mice. a, b Aggrecan labeling (ACAN, green) yielded a strong immunosignal in the spiral limbus (SL) in both bcan+/+ (a) and bcan−/− mice (b). At IHCs, aggrecan was only detectable in bcan+/+ but not in bcan−/− organs of Corti (magnification of 4–5 IHCs in the insets). c, d Neurocan (green) could be visualized at the base of IHCs in wildtype mice (c) but was absent at IHCs of bcan−/− mice (d). e, f The immunoreactivity of HAPLN1 (green) is strongly reduced at IHCs in brevican-deficient mice (f) compared to wildtype mice (e). g, h The positive immunosignal of HAPLN4 (green) at the base of IHCs in wildtype mice (g) was absent in bcan−/− mice (h). i, j The immunosignal of tenascin-R (green) at the base of IHCs in wildtype mice (i) was absent in bcan−/− mice (j). Maximum intensity projections of confocal stacks of stretches of 30–40 IHCs (a, b) or 6–7 IHCs (cj) of cochlea whole-mount preparations with nuclei stained with DAPI (a, b, ej, blue) or with IHCs labeled by an anti-vGlut3 antibody (c, d, blue). Exemplary IHCs are indicated by the dashed outline. a, b scale 25 μm, insets 5 μm, c-j scale 5 μm
Fig. 7
Fig. 7
Ba2+ currents recorded in IHCs of bcan−/− mice. a Exemplary current traces of an apical turn bcan+/+ IHC (black, left, P20) and an apical turn bcan−/− IHC (red, right, P21) in response to 8 ms step depolarizations to the voltages indicated. b Corresponding I-V-curves of the exemplary cells depicted in a (bcan+/+ IHC: black; bcan−/− IHC: red). c Average maximum Ba2+ currents did not point to any disruption of the function of presynaptic calcium channels in IHCs of bcan−/− mice (bcan+/+: − 232 ± 43.6 pA, n = 17/2 IHCs/mice, bcan−/−: − 229.5 ± 34 pA, n = 15/2, p = 0.861, t test). Data are presented as mean ± S.D
Fig. 8
Fig. 8
Hearing function assessed by auditory brainstem responses (ABR) and distortion product otoacoustic emissions (DPOAE) in bcan−/− mice. a ABR thresholds of bcan−/− mice (red) were elevated compared with wildtype mice (black) in response to both click stimuli (bcan+/+: 16.7 ± 3.3 dB SPL, n = 6/12 animals/ears; bcan−/−: 20.0 ± 3.6 dB SPL, n = 6/12 animals/ears, p < 0.01, t test) and pure tones, which covered the frequencies of best hearing of mice (at 11.3 kHz, bcan+/+: 33.3 ± 6.8 dB SPL, n = 6/12 animals/ears; bcan−/−: 38.8 ± 6.8 dB SPL, n = 6/12 animals/ears, p < 0.05, t test). b Sketch illustrating a click ABR waveform with waves I–IV indicated at the positive peaks, respectively, and the definition of latency as the time point of the negative (leading) peak of the individual wave. c Growth functions of the latencies of waves I to IV (mean ± S.D.) show consistently larger mean latencies for all four waves and all stimulus levels (except latency of wave I at 35 dB above threshold) in bcan−/− mice (red) compared to wildtype mice (black; n = 6/12, animals/ears each genotype). For clarity, the S.D. is plotted in one direction only (+ S.D. or − S.D.). d DPOAE maximum amplitudes averaged over 10–18 kHz did not differ between genotypes (bcan+/+, black: 23.3 ± 4.5 dB, n = 7/13 animals/ears; bcan−/−, red: 24.2 ± 2.1 dB, n = 6/12 animals/ears, p = 0.537, t test). * p < 0.05, ** p < 0.01. Data are presented as mean ± S.D
Fig. 9
Fig. 9
Spatial coupling of presynaptic Cav1.3 and postsynaptic PSD-95 clusters at the IHC synapse in bcan−/− mice. a Immunohistochemical double-labeling of presynaptic Cav1.3 channels (red) and postsynaptic densities (PSD-95, green) in cochlear whole-mount preparations of bcan+/+ and bcan−/− mice, with one representative IHC indicated by the dashed line. The magnification of the basal part of the labeled IHC is illustrated in the inset in the merge figure. b Quantification of the number of postsynaptic densities labeled with anti-PSD-95 did not yield any genotype-specific difference (bcan+/+ (black): 115 [101,148] per 8 IHCs, n = 47 stretches of 8 IHCs of 8 whole-mounts, bcan−/− (red): 122 [112,130] per 8 IHCs, n = 23 stretches of 8 IHCs of 4 whole-mounts, p = 0.409, Mann-Whitney rank sum test). c The analysis of the spatial coupling between Cav1.3 channel clusters (red immunosignal) and PSD-95-positive postsynaptic densities (green immunosignal) revealed a significant reduction in co-localized red and green immunopositive punctae (group 1, p < 0.001, t test) and a significant increase in spatially shifted green and red immunopositive punctae (group 2, p < 0.001, t test) in bcan−/− mice. The immunopositive spots were quantified in maximum intensity projections of confocal stacks of stretches of 8 IHCs (bcan+/+: n = 47; bcan−/−: n = 23) imaged from 8 bcan+/+ whole-mount preparations and 4 bcan−/− whole-mount preparations. Scales 5 μm, insets 2.5 μm, *** p < 0.001. Data are presented as median [first quartile, third quartile] in b and as mean ± S.D. in c

Comment in

References

    1. Carulli D, Rhodes KE, Fawcett JW. Upregulation of aggrecan, link protein 1, and hyaluronan synthases during formation of perineuronal nets in the rat cerebellum. J Comp Neurol. 2007;501:83–94. doi: 10.1002/cne.21231. - DOI - PubMed
    1. Deepa SS, Carulli D, Galtrey C, Rhodes K, Fukuda J, Mikami T, et al. Composition of perineuronal net extracellular matrix in rat brain: a different disaccharide composition for the net-associated proteoglycans. J Biol Chem. 2006;281:17789–17800. doi: 10.1074/jbc.M600544200. - DOI - PubMed
    1. Kwok JCF, Dick G, Wang D, Fawcett JW. Extracellular matrix and perineuronal nets in CNS repair. Dev Neurobiol. 2011;71:1073–1089. doi: 10.1002/dneu.20974. - DOI - PubMed
    1. Koppe G, Bruckner G, Hartig W, Delpech B, Bigl V. Characterization of proteoglycan-containing perineuronal nets by enzymatic treatments of rat brain sections. Histochem J. 1997;29:11–20. doi: 10.1023/A:1026408716522. - DOI - PubMed
    1. Wang D, Fawcett J. The perineuronal net and the control of CNS plasticity. Cell Tissue Res. 2012;349:147–160. doi: 10.1007/s00441-012-1375-y. - DOI - PubMed

Publication types

LinkOut - more resources