Consumption of a high fat diet promotes protein O-GlcNAcylation in mouse retina via NR4A1-dependent GFAT2 expression
- PMID: 30254013
- PMCID: PMC6239931
- DOI: 10.1016/j.bbadis.2018.09.006
Consumption of a high fat diet promotes protein O-GlcNAcylation in mouse retina via NR4A1-dependent GFAT2 expression
Abstract
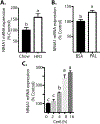
The incidence of type 2 diabetes, the most common cause of diabetic retinopathy (DR), is rapidly on the rise in developed countries due to overconsumption of calorie rich diets. Using an animal model of diet-induced obesity/pre-diabetes, we evaluated the impact of a diet high in saturated fat (HFD) on O-GlcNAcylation of retinal proteins, as dysregulated O-GlcNAcylation contributes to diabetic complications and evidence supports a role in DR. Protein O-GlcNAcylation was increased in the retina of mice fed a HFD as compared to littermates receiving control chow. Similarly, O-GlcNAcylation was elevated in retinal Müller cells in culture exposed to the saturated fatty acid palmitate or the ceramide analog Cer6. One potential mechanism responsible for elevated O-GlcNAcylation is increased flux through the hexosamine biosynthetic pathway (HBP). Indeed, inhibition of the pathway's rate-limiting enzyme glutamine-fructose-6-phosphate amidotransferase (GFAT) prevented Cer6-induced O-GlcNAcylation. Importantly, expression of the mRNA encoding GFAT2, but not GFAT1 was elevated in both the retina of mice fed a HFD and in retinal cells in culture exposed to palmitate or Cer6. Notably, expression of nuclear receptor subfamily 4 group A member 1 (NR4A1) was increased in the retina of mice fed a HFD and NR4A1 expression was sufficient to promote GFAT2 mRNA expression and O-GlcNAcylation in retinal cells in culture. Whereas palmitate or Cer6 addition to culture medium enhanced NR4A1 and GFAT2 expression, chemical inhibition of NR4A1 transactivation repressed Cer6-induced GFAT2 mRNA expression. Overall, the results support a model wherein HFD increases retinal protein O-GlcNAcylation by promoting NR4A1-dependent GFAT2 expression.
Keywords: Diabetic retinopathy; Hexosamine biosynthetic pathway; NR4A1; Type 2 diabetes.
Copyright © 2018 Elsevier B.V. All rights reserved.
Conflict of interest statement
The authors declare that they have no conflicts of interest with the contents of this article.
Figures


Similar articles
-
Phosphorylation of mouse glutamine-fructose-6-phosphate amidotransferase 2 (GFAT2) by cAMP-dependent protein kinase increases the enzyme activity.J Biol Chem. 2004 Jul 16;279(29):29988-93. doi: 10.1074/jbc.M401547200. Epub 2004 May 7. J Biol Chem. 2004. PMID: 15133036
-
O-GlcNAcylation alters the selection of mRNAs for translation and promotes 4E-BP1-dependent mitochondrial dysfunction in the retina.J Biol Chem. 2019 Apr 5;294(14):5508-5520. doi: 10.1074/jbc.RA119.007494. Epub 2019 Feb 7. J Biol Chem. 2019. PMID: 30733333 Free PMC article.
-
Retinal O-linked N-acetylglucosamine protein modifications: implications for postnatal retinal vascularization and the pathogenesis of diabetic retinopathy.Mol Vis. 2013 May 21;19:1047-59. Print 2013. Mol Vis. 2013. PMID: 23734074 Free PMC article.
-
Hexosamines, insulin resistance, and the complications of diabetes: current status.Am J Physiol Endocrinol Metab. 2006 Jan;290(1):E1-E8. doi: 10.1152/ajpendo.00329.2005. Am J Physiol Endocrinol Metab. 2006. PMID: 16339923 Free PMC article. Review.
-
O-Linked β-N-acetylglucosamine (O-GlcNAc) modification: a new pathway to decode pathogenesis of diabetic retinopathy.Clin Sci (Lond). 2018 Jan 19;132(2):185-198. doi: 10.1042/CS20171454. Print 2018 Jan 31. Clin Sci (Lond). 2018. PMID: 29352075 Free PMC article. Review.
Cited by
-
Changes in transcriptomic landscape with macronutrients intake switch are independent from O-GlcNAcylation levels in heart throughout postnatal development in rats.Heliyon. 2024 Apr 30;10(9):e30526. doi: 10.1016/j.heliyon.2024.e30526. eCollection 2024 May 15. Heliyon. 2024. PMID: 38737268 Free PMC article.
-
Regulation of protein O-GlcNAcylation by circadian, metabolic, and cellular signals.J Biol Chem. 2024 Feb;300(2):105616. doi: 10.1016/j.jbc.2023.105616. Epub 2023 Dec 29. J Biol Chem. 2024. PMID: 38159854 Free PMC article. Review.
-
Nutrient-sensitive protein O-GlcNAcylation shapes daily biological rhythms.Open Biol. 2022 Sep;12(9):220215. doi: 10.1098/rsob.220215. Epub 2022 Sep 14. Open Biol. 2022. PMID: 36099933 Free PMC article. Review.
-
Enzymatic and structural properties of human glutamine:fructose-6-phosphate amidotransferase 2 (hGFAT2).J Biol Chem. 2021 Jan-Jun;296:100180. doi: 10.1074/jbc.RA120.015189. Epub 2020 Dec 17. J Biol Chem. 2021. PMID: 33303629 Free PMC article.
-
Retinol-binding protein 4 mRNA translation in hepatocytes is enhanced by activation of mTORC1.Am J Physiol Endocrinol Metab. 2021 Feb 1;320(2):E306-E315. doi: 10.1152/ajpendo.00494.2020. Epub 2020 Dec 7. Am J Physiol Endocrinol Metab. 2021. PMID: 33284085 Free PMC article.
References
-
- Fong DS, Aiello LP, Ferris FL 3rd, and Klein R (2004) Diabetic retinopathy, Diabetes Care 27, 2540–2553 - PubMed
-
- Chhablani J, Sharma A, Goud A, Peguda HK, Rao HL, Begum VU, and Barteselli G (2015) Neurodegeneration in Type 2 Diabetes: Evidence From Spectral-Domain Optical Coherence Tomography, Invest Ophthalmol Vis Sci 56, 6333–6338 - PubMed
-
- Marcal AC, Leonelli M, Fiamoncini J, Deschamps FC, Rodrigues MA, Curi R, Carpinelli AR, Britto LR, and Carvalho CR (2013) Diet-induced obesity impairs AKT signalling in the retina and causes retinal degeneration, Cell Biochem Funct 31, 65–74 - PubMed
Publication types
MeSH terms
Substances
Grants and funding
LinkOut - more resources
Full Text Sources
Other Literature Sources
Molecular Biology Databases
Miscellaneous

