. 2018 Nov 5;215(11):2868-2886.
doi: 10.1084/jem.20171029. Epub 2018 Sep 25.

ATG16L1 orchestrates interleukin-22 signaling in the intestinal epithelium via cGAS-STING

Affiliations

ATG16L1 orchestrates interleukin-22 signaling in the intestinal epithelium via cGAS-STING

Konrad Aden et al. J Exp Med. .

Abstract

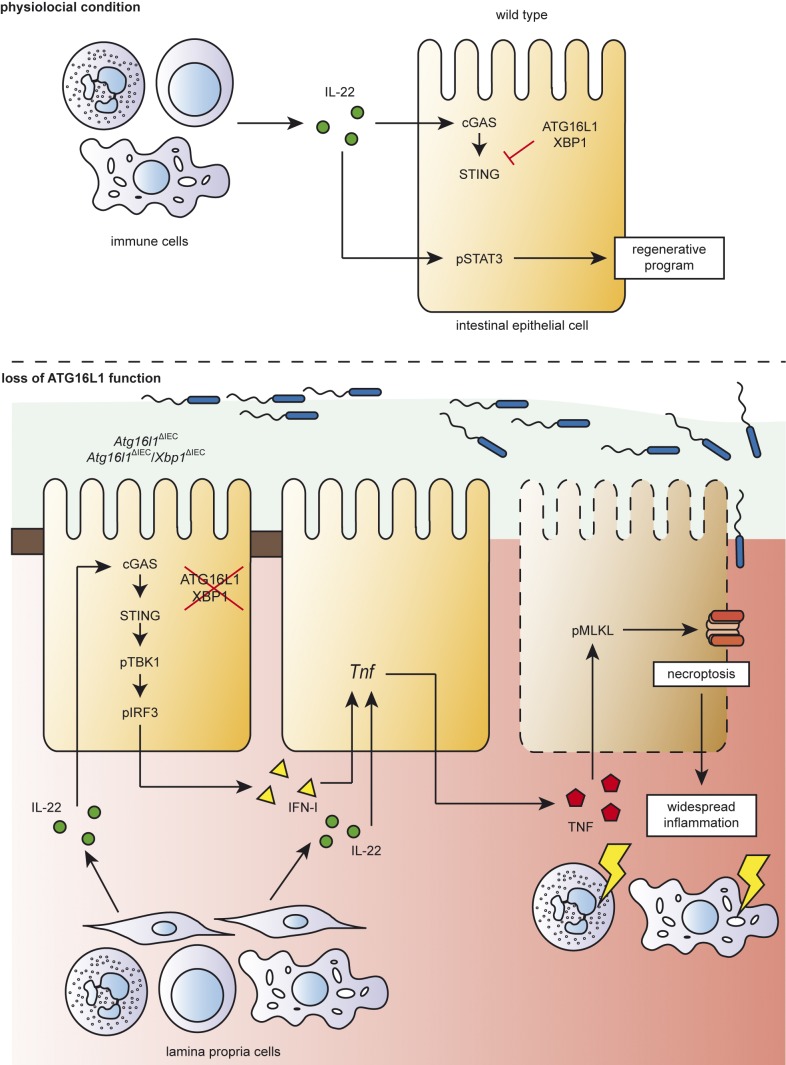
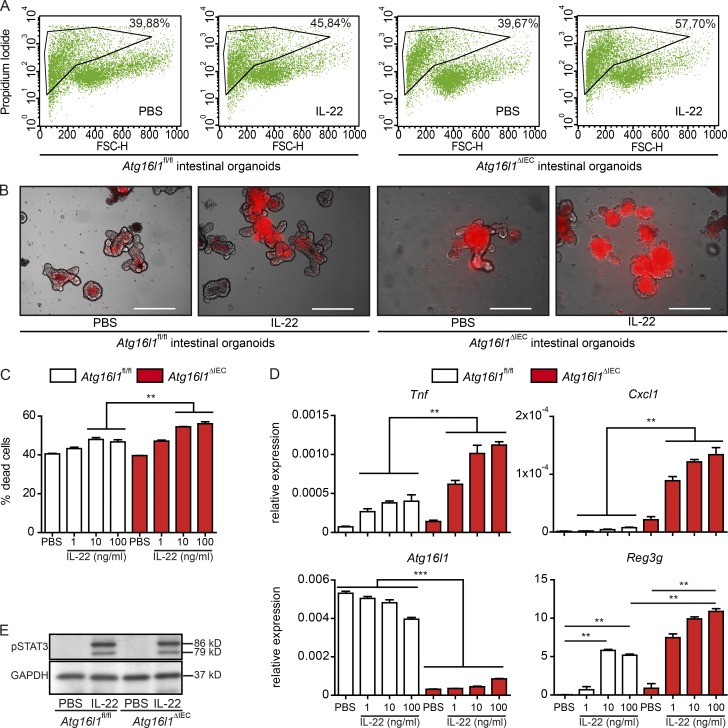
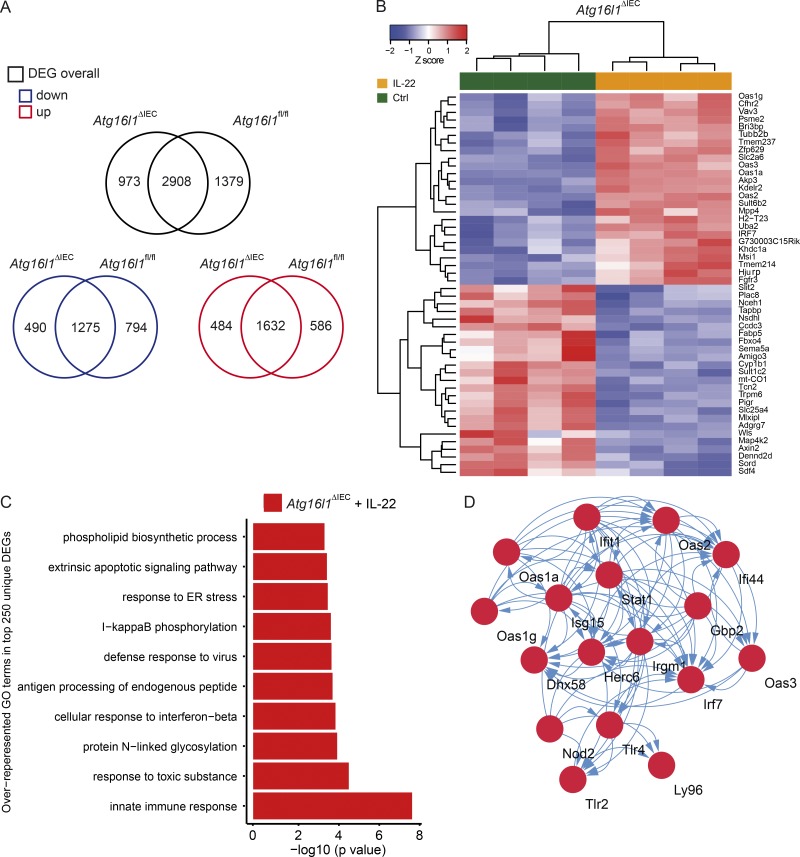
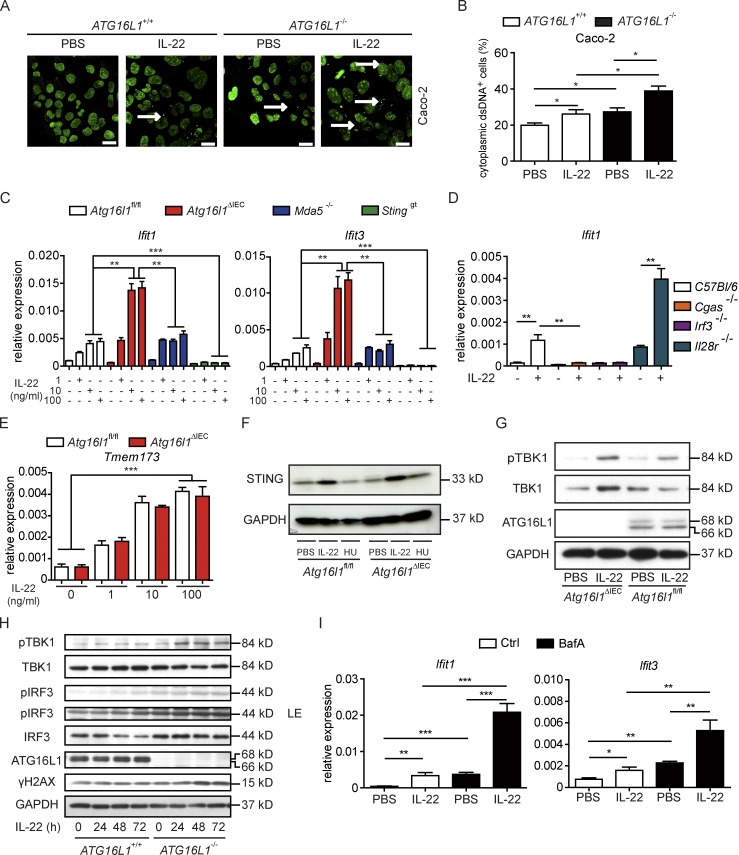
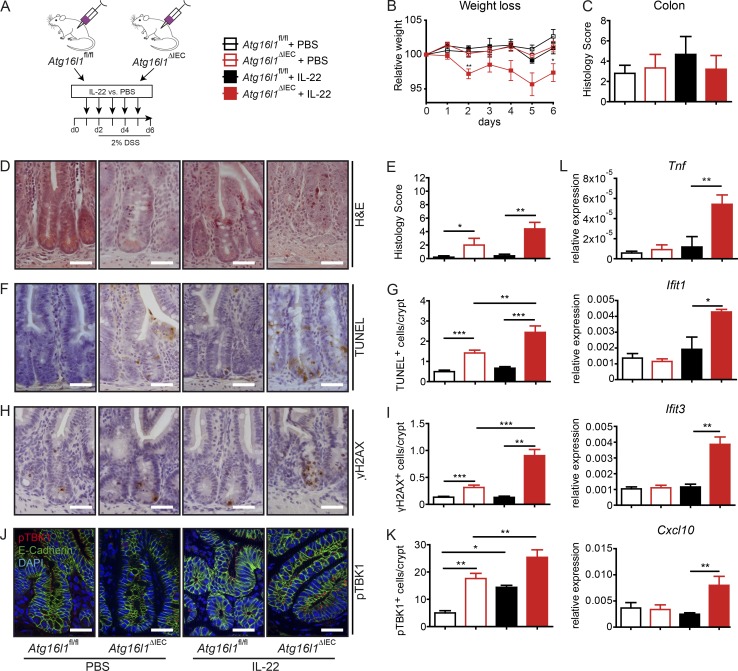
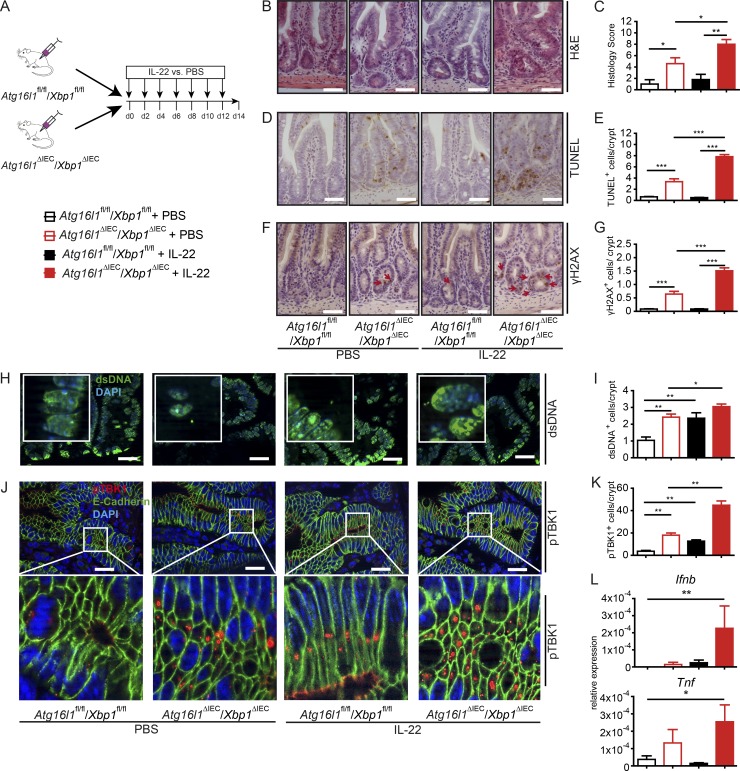
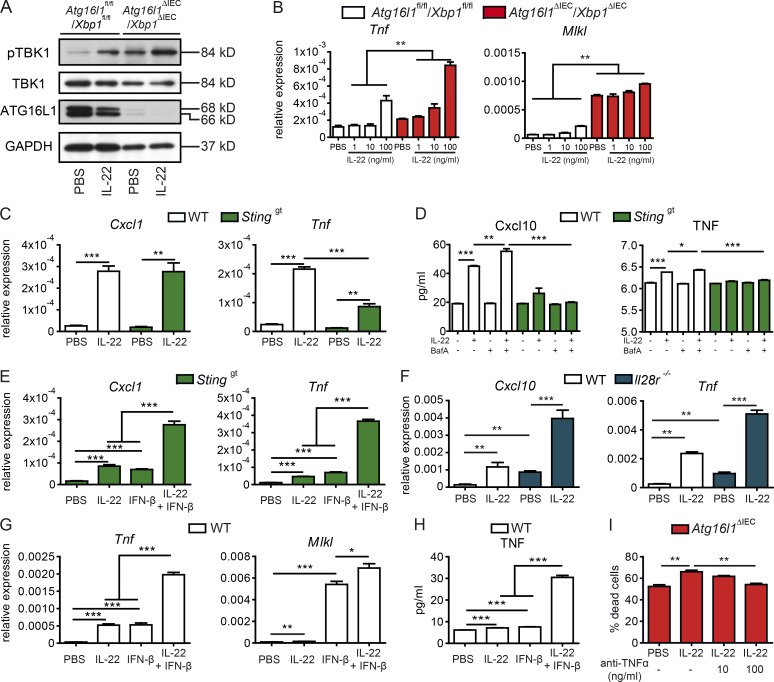
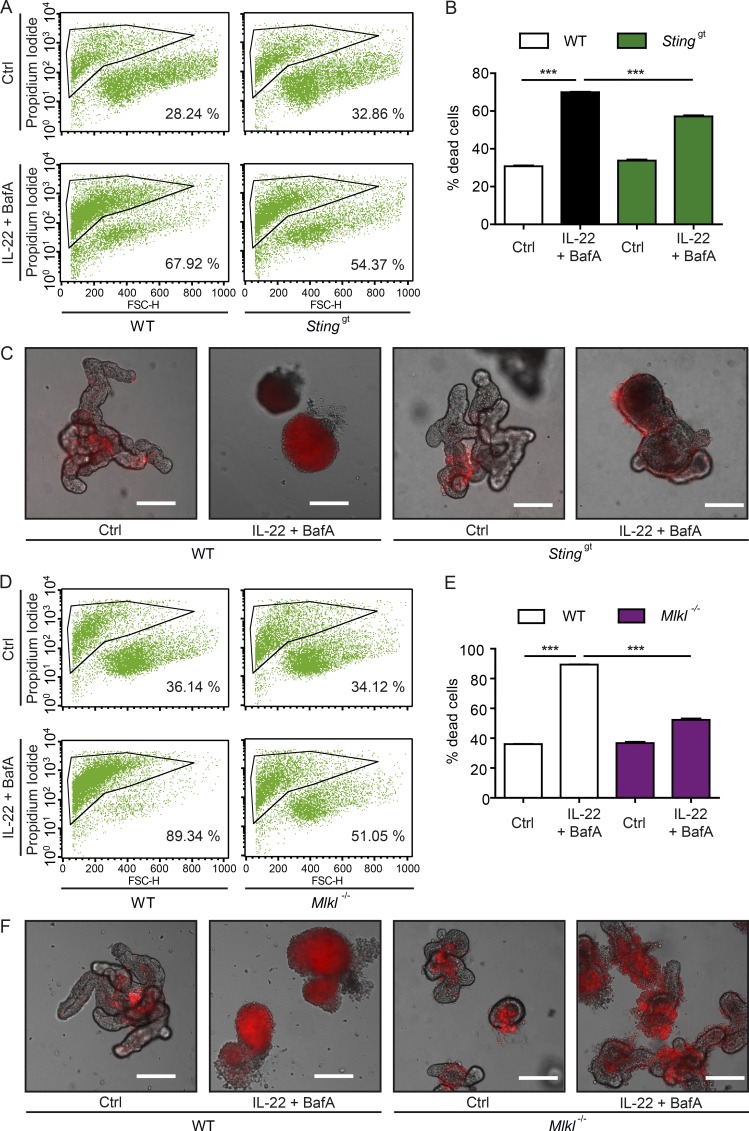
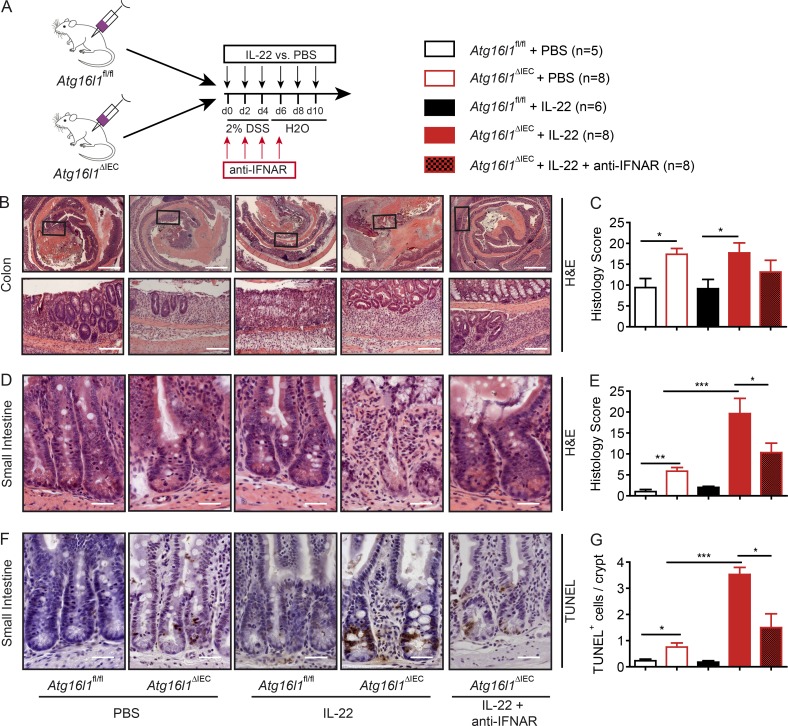
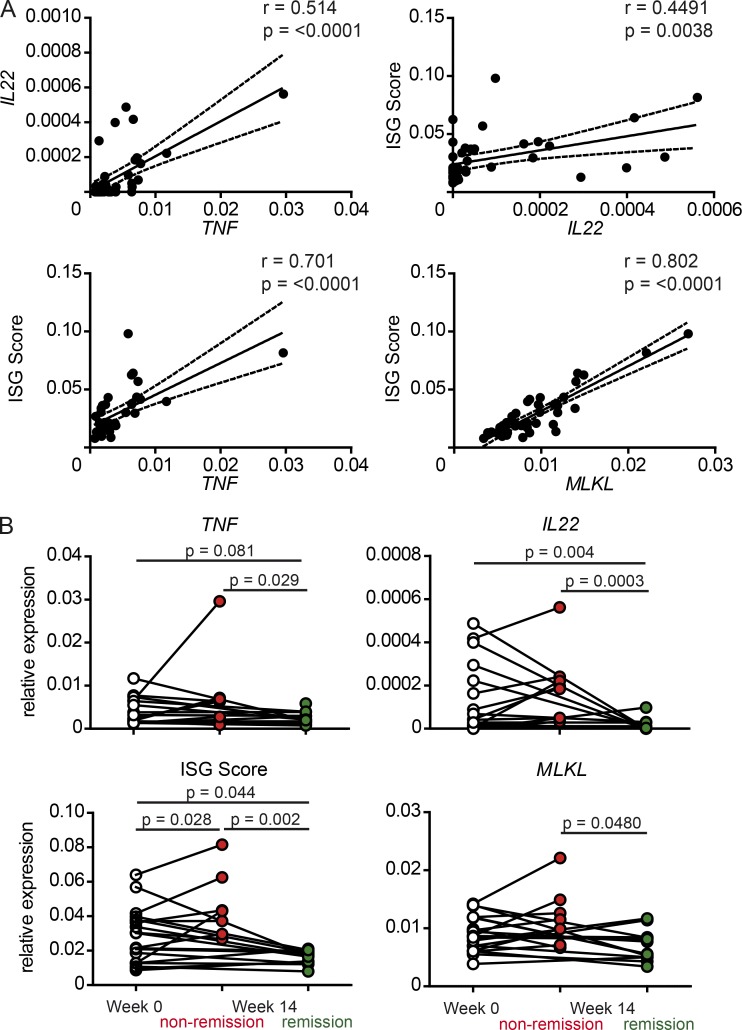
A coding variant of the inflammatory bowel disease (IBD) risk gene ATG16L1 has been associated with defective autophagy and deregulation of endoplasmic reticulum (ER) function. IL-22 is a barrier protective cytokine by inducing regeneration and antimicrobial responses in the intestinal mucosa. We show that ATG16L1 critically orchestrates IL-22 signaling in the intestinal epithelium. IL-22 stimulation physiologically leads to transient ER stress and subsequent activation of STING-dependent type I interferon (IFN-I) signaling, which is augmented in Atg16l1 ΔIEC intestinal organoids. IFN-I signals amplify epithelial TNF production downstream of IL-22 and contribute to necroptotic cell death. In vivo, IL-22 treatment in Atg16l1 ΔIEC and Atg16l1 ΔIEC/Xbp1 ΔIEC mice potentiates endogenous ileal inflammation and causes widespread necroptotic epithelial cell death. Therapeutic blockade of IFN-I signaling ameliorates IL-22-induced ileal inflammation in Atg16l1 ΔIEC mice. Our data demonstrate an unexpected role of ATG16L1 in coordinating the outcome of IL-22 signaling in the intestinal epithelium.


Figures

None
Graphical abstract
Figure 1.
Figure 1.
IL-22 induces cell death and a proinflammatory signature in Atg16l1-deficient intestinal organoids. (A) Representative FACS plots of PI-stained dissociated cells from intestinal organoids (Atg16l1fl/fl, Atg16l1ΔIEC), treated with rmIL-22 (100 ng/ml) for 24 h. (B) Representative pictures of intestinal organoids (Atg16l1fl/fl, Atg16l1ΔIEC), treated with rmIL-22 (100 ng/ml) for 24 h, stained with PI. Bars, 200 µm. (C) Flow cytometry assessment of dead cells from intestinal organoids (Atg16l1fl/fl, Atg16l1ΔIEC) stimulated with rmIL-22 (1, 10, or 100 ng/ml) for 24 h using PI (n = 3 each). (D) mRNA expression of Tnf, Cxcl1, Atg16l1, and Reg3g in small intestinal organoids (Atg16l1fl/fl, Atg16l1ΔIEC) treated with rmIL-22 (1, 10, or 100 ng/ml) for 24 h as assessed by qPCR (n = 4 each). (E) Western blot analysis from intestinal organoids (Atg16l1fl/fl, Atg16l1ΔIEC) treated with rmIL-22 (100 ng/ml) for 30 min, probed against pSTAT3 and GAPDH. Illustrated are representative data of three independent experiments. Significance determined using Mann-Whitney test and expressed as the mean ± SEM. **, P < 0.01; ***, P < 0.001.
Figure 2.
Figure 2.
Atg16l1 orchestrates an IL-22–dependent IFN-I signature in intestinal organoids. (A) Venn diagram showing numbers of differentially expressed transcripts (overall, black) and significantly up-regulated (below, red) and down-regulated (below, blue) transcripts in small intestinal organoids (Atg16l1fl/fl, Atg16l1ΔIEC) in response to stimulation with IL-22 (10 ng/ml) for 24 h (n = 4 each). Differential expression was determined using RNA sequencing and the DESEQ2 algorithm. (B) Heat map showing clustering of top 25 up- and down-regulated genes in response to IL-22 (10 ng/ml) according to genotype. (C) Gene set enrichment (GO) analysis of top 250 uniquely up-regulated genes in IL-22–treated Atg16l1ΔIEC intestinal organoids. (D) STRING-based network analysis of all genes contributing to the GO term “innate immune response” detected in C. Note a strong contribution of an IFN-I–related signature.
Figure 3.
Figure 3.
ATG16L1 coordinates an IL-22–dependent IFN-I signature via STING signaling. (A and B) Representative pictures (A) and quantification (B) of dsDNA in Caco-2 cells (ATG16L1+/+ vs. ATG16L1−/−) treated with rhIL-22 (100 ng/ml) for 24 h (n = 3 each). dsDNA was visualized in Caco-2 cells using an anti-dsDNA antibody (second antibody: Alexa Fluor 488–conjugated anti-mouse). Arrows indicate representative cytoplasmic dsDNA spots. Bars, 10 µm. (C) qPCR of Ifit1 and Ifit3 in intestinal organoids (Atg16l1fl/fl, Atg16l1ΔIEC, Stinggt, Mda5−/−) treated with or without rmIL-22 (1, 10, or 100 ng/ml) for 24 h (n = 3 each). (D) qPCR of Ifit1 in intestinal organoids (C57BL/6, Cgas−/−, Irf3−/−, Il28r−/−) treated with rmIL-22 (100 ng/ml) or PBS for 24 h (n = 3 each). (E) qPCR of Sting in intestinal organoids (Atg16l11fl/fl, Atg16l1ΔIEC) treated with rmIL-22 (1, 10, or 100 ng/ml; n = 3 each). (F) Protein lysates from intestinal organoids (Atg16l1fl/fl, Atg16l1ΔIEC) treated with either rmIL-22 (100 ng/ml) or hydroxyurea (HU; 2 µM) for 24 h were subjected to immunoblot analysis against STING. (G) Western blot analyses from intestinal organoids (Atg16l11fl/fl, Atg16l1ΔIEC) treated with rmIL-22 (100 ng/ml) for 24 h. Lysates were probed against pTBK1, TBK1, ATG16L1, and GAPDH. (H) Protein lysates from Caco-2 cells (ATG16L1+/+ vs. ATG16L1−/−), treated with IL-22 (100 ng/ml) for indicated time points were subjected to immunoblot analysis against indicated proteins. LE: longer exposure. (I) qPCR of Ifit1 and Ifit3 in intestinal organoids (C57BL/6J) treated with rmIL-22 (100 ng/ml) and BafA (5 nM) for 24 h (n = 3 each). Results (A–I) represent at least two independent experiments. Significance determined using two-tailed Student’s t test and expressed as the mean ± SEM. *, P < 0.05; **, P < 0.01; ***, P < 0.001.
Figure 4.
Figure 4.
IL-22 induces ileal inflammation in Atg16l1ΔIEC mice. (A) Stimulation scheme of Atg16l1fl/fl and Atg16l1ΔIEC mice (n = 5/5/5/5). Mice were treated with 2 µg/20 mg bodyweight of rmIL-22 i.p. every day over the course of 6 d. (B) Weight loss curve. (C) Statistical evaluation of the histological inflammation score in colon sections. (D–K) Histological evaluation of small intestinal sections with representative pictures and absolute quantification for H&E (D and E), TUNEL (F and G), and γH2AX (H and I; n = 5 each). Representative IF staining and statistical evaluation of small intestinal sections stained against pTBK1 (second antibody: Alexa Fluor 546–conjugated anti-rabbit; red) and counterstained with DAPI and anti-E-cadherin (second antibody: Alexa Fluor 488–conjugated anti-mouse; green; J and K; n = 5 each). For quantification, a minimum of 100 crypts/intestine were assessed in each treatment group by two independent observers. Bars, 100 µm. (L) Gene expression of Tnf, Ifit1, Ifit3, and Cxcl10 from small intestinal crypts (n = 4 each). Results represent one experiment. Significance determined using two-tailed Student’s t test and expressed as the mean ± SEM. *, P < 0.05; **, P < 0.01; ***, P < 0.001.
Figure 5.
Figure 5.
IL-22 aggravates epithelial cell death–mediated inflammation in Atg16l1ΔIEC/Xbp1ΔIEC mice. (A) Treatment scheme of Atg16l1fl/fl/Xbp1fl/fl and Atg161ΔIEC/Xbp1ΔIEC mice (n = 7/7/7/6). (B–K) Histological evaluation of small intestinal sections with representative pictures and absolute quantification for H&E (B and C), TUNEL (D and E), and γH2AX (F and G; n = 5 each). Representative IF staining (including magnification inserts) and statistical evaluation of small intestinal sections stained against dsDNA (second antibody: Alexa Fluor 488–conjugated anti-mouse antibody; green; counterstained with DAPI; H and I) and pTBK1 (second antibody: Alexa Fluor 546–conjugated anti-rabbit; red), counterstained with DAPI and anti–E-cadherin (second antibody: Alexa Fluor 488–conjugated anti-mouse; green; J and K; n = 5 each). For quantification a minimum of 100 crypts/intestine were assessed in each treatment group. Bars, 100 µm. (L) qPCR of Ifnb and Tnf in ileal mucosa (n = 4 each). Results represent one experiment. Significance determined using two-tailed Student’s t test and expressed as the mean ± SEM. *, P < 0.05; **, P < 0.01; ***, P < 0.001.
Figure 6.
Figure 6.
STING and IFN-I signals synergize in TNF induction and necroptosis in intestinal epithelial organoids. (A) Immunoblot analyses from protein lysates derived from Atg16l1fl/fl/Xbp1fl/fl and Atg16l1ΔIEC/Xbp1ΔIEC organoids stimulated with rmIL-22 (100 ng/ml) for 24 h and probed against pTBK1, TBK1, ATG16L1, and GAPDH. (B) Transcript levels of Tnf and Mlkl in small intestinal organoids (Atg16l1fl/fl/Xbp1fl/fl and Atg16l1ΔIEC/Xbp1ΔIEC) treated with rmIL-22 (100 ng/ml) for 24 h as assessed by qPCR (n = 4 each). (C) Transcript levels of Cxcl1, Tnf in small intestinal organoids (C57BL/6, Stinggt) treated with rmIL-22 (100 ng/ml) for 24 h as assessed by qPCR (n = 4 each). (D) Concentration of CXCL10 and TNF in the supernatant of intestinal organoids (C57BL/6, Stinggt) treated with rmIL-22 (100 ng/ml), bafilomycin A (BafA; 5 nM) or both for 24 h, as detected via ELISA (n = 3 each). (E) qPCR of Cxcl1, Tnf in small intestinal organoids (Stinggt) treated with rmIL-22 (100 ng/ml) or IFN-β (1,000 IU/ml) or both for 24 h (n = 3 each). (F) qPCR of Cxcl10, Tnf in small intestinal organoids from C57BL/6 or Il28r−/− mice treated with rmIL-22 (100 ng/ml) for 24 h (n = 3 each). (G) qPCR of Mlkl and Tnf in small intestinal organoids (C57BL/6) treated with rmIL-22 (100 ng/ml) or IFN-β (1,000 IU/ml) or both for 24 h (n = 3 each). (H) Concentration of TNF in the supernatant of intestinal organoids (C57BL/6) treated with rmIL-22 (100 ng/ml) or IFN-β (1,000 IU/ml) or both for 24 h, as detected via ELISA. (I) Assessment of dead cells from intestinal organoids (Atg16l1ΔIEC) stimulated with rmIL-22 (100 ng/ml) for 24 h in the absence or presence of anti-TNF antibody (10 and 100 ng/ml; n = 3 each). Results represent two independent experiments. Significance determined using two-tailed Student’s t test and expressed as the mean ± SEM. *, P < 0.05; **, P < 0.01; ***, P < 0.001.
Figure 7.
Figure 7.
IL-22–induced epithelial cell death depends on STING and MLKL. (A and B) Representative FACS plots (A) and flow cytometry analysis (B) of cell death of intestinal organoids (WT, Stinggt), treated with rmIL-22 (100 ng/ml) and BafA (5 nM) for 24 h and staind with PI (n = 3 each). (C) Representative pictures of intestinal organoids (WT, Stinggt), treated with rmIL-22 (100 ng/ml) and BafA (5 nM) for 24 h. Bars, 200 µm. (D and E) Representative FACS plots (D) and flow cytometry analysis (E) of cell death of intestinal organoids (WT, Mlkl−/−), treated with rmIL-22 (100 ng/ml) and BafA (5 nM) for 24 h and stained with PI (n = 3 each). (F) Representative pictures of intestinal organoids (WT, Mlkl−/−), treated with rmIL-22 (100 ng/ml) and BafA (5 nM) for 24 h. Bars, 200 µm. Results represent two independent experiments. Significance determined using two-tailed Student’s t test and expressed as the mean ± SEM. *, P < 0.05; **, P < 0.01; ***, P < 0.001.
Figure 8.
Figure 8.
IFN-I signals contribute to IL-22–induced ileitis in Atg16l1ΔIEC mice. (A) Stimulation scheme of Atg16l1fl/fl and Atg16l1ΔIEC mice treated with rmIL-22 and anti-IFNAR. Mice were treated with either rmIL-22 i.p. (2 µg/20 mg bodyweight) or PBS on days 0, 2, 4, 6, and 8. A group of mice received anti-IFNAR i.p. (10 mg/kg bodyweight). All mice were terminated at day 10. (B and C) Histological evaluation of colonic section with representative pictures (B) and absolute quantification for H&E (C; n = 5/8/6/8/8). Bars, 500 µm (upper); 200 µm (lower). (D–G) Histological evaluation of small intestinal sections with representative pictures and absolute quantification for H&E (D and E) and TUNEL (F and G); n = 5/8/6/8/8). Bars, 100 µm. Results represent one experiment. Significance determined using two-tailed Student’s t test (C, E, and G) and expressed as the mean ± SEM. *, P < 0.05; ***, P < 0.001.
Figure 9.
Figure 9.
The IL-22–IFN-I axis affects clinical outcome upon anti-TNF therapy in IBD patients. (A) Linear regression of correlation of IL22, TNF, and MLKL or a composite score (Lübbers et al., 2013) of six IFN stimulatory genes (ISG) in sigmoid biopsies from IBD patients (n = 21). (B) Relative mRNA expression of IL22, TNF, MLKL, or a composite score of six ISG in sigmoid biopsies from human IBD patients before (week 0) or after anti-TNF therapy (week 14) clustered according to clinical remission status (remission: UC = 7, CD = 7; nonremission: CD = 1, UC = 6). Significance determined using Spearman test for correlation (A) or Mann-Whitney test (B) and expressed as the mean ± SEM.

References

    1. Aden K., Rehman A., Falk-Paulsen M., Secher T., Kuiper J., Tran F., Pfeuffer S., Sheibani-Tezerji R., Breuer A., Luzius A., et al. . 2016. Epithelial IL-23R Signaling Licenses Protective IL-22 Responses in Intestinal Inflammation. Cell Reports. 16:2208–2218. 10.1016/j.celrep.2016.07.054 - DOI - PMC - PubMed
    1. Adolph T.E., Tomczak M.F., Niederreiter L., Ko H.-J., Böck J., Martinez-Naves E., Glickman J.N., Tschurtschenthaler M., Hartwig J., Hosomi S., et al. . 2013. Paneth cells as a site of origin for intestinal inflammation. Nature. 503:272–276. 10.1038/nature12599 - DOI - PMC - PubMed
    1. Anders S., Pyl P.T., and Huber W.. 2015. HTSeq--a Python framework to work with high-throughput sequencing data. Bioinformatics. 31:166–169. 10.1093/bioinformatics/btu638 - DOI - PMC - PubMed
    1. Bachmann M., Horn K., Rudloff I., Goren I., Holdener M., Christen U., Darsow N., Hunfeld K.-P., Koehl U., Kind P., et al. . 2010. Early production of IL-22 but not IL-17 by peripheral blood mononuclear cells exposed to live Borrelia burgdorferi: the role of monocytes and interleukin-1. PLoS Pathog. 6:e1001144 10.1371/journal.ppat.1001144 - DOI - PMC - PubMed
    1. Barber G.N. 2015. STING: infection, inflammation and cancer. Nat. Rev. Immunol. 15:760–770. 10.1038/nri3921 - DOI - PMC - PubMed

Publication types

MeSH terms