. 2018 Nov 29;132(22):2362-2374.
doi: 10.1182/blood-2018-07-863431. Epub 2018 Sep 25.

T-cell defects in patients with ARPC1B germline mutations account for combined immunodeficiency

Affiliations

T-cell defects in patients with ARPC1B germline mutations account for combined immunodeficiency

Immacolata Brigida et al. Blood. .

Abstract

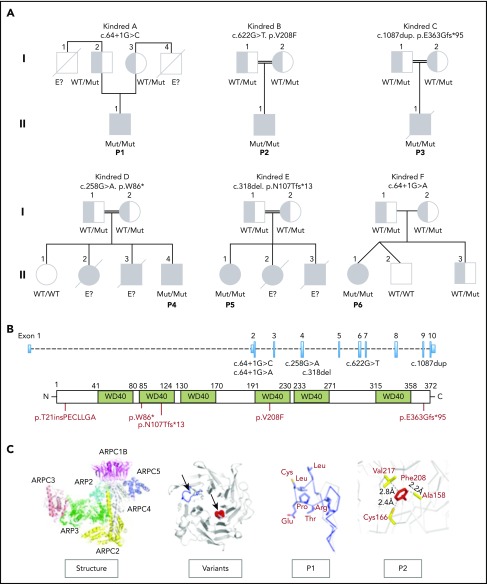
ARPC1B is a key factor for the assembly and maintenance of the ARP2/3 complex that is involved in actin branching from an existing filament. Germline biallelic mutations in ARPC1B have been recently described in 6 patients with clinical features of combined immunodeficiency (CID), whose neutrophils and platelets but not T lymphocytes were studied. We hypothesized that ARPC1B deficiency may also lead to cytoskeleton and functional defects in T cells. We have identified biallelic mutations in ARPC1B in 6 unrelated patients with early onset disease characterized by severe infections, autoimmune manifestations, and thrombocytopenia. Immunological features included T-cell lymphopenia, low numbers of naïve T cells, and hyper-immunoglobulin E. Alteration in ARPC1B protein structure led to absent/low expression by flow cytometry and confocal microscopy. This molecular defect was associated with the inability of patient-derived T cells to extend an actin-rich lamellipodia upon T-cell receptor (TCR) stimulation and to assemble an immunological synapse. ARPC1B-deficient T cells additionally displayed impaired TCR-mediated proliferation and SDF1-α-directed migration. Gene transfer of ARPC1B in patients' T cells using a lentiviral vector restored both ARPC1B expression and T-cell proliferation in vitro. In 2 of the patients, in vivo somatic reversion restored ARPC1B expression in a fraction of lymphocytes and was associated with a skewed TCR repertoire. In 1 revertant patient, memory CD8+ T cells expressing normal levels of ARPC1B displayed improved T-cell migration. Inherited ARPC1B deficiency therefore alters T-cell cytoskeletal dynamics and functions, contributing to the clinical features of CID.


Conflict of interest statement

Conflict-of-interest disclosure: The authors declare no competing financial interest.

Figures

None
Graphical abstract
Figure 1.
Figure 1.
Pedigree of ARPC1B-deficient patients. (A) Genetics and pedigree of families included in the study with reported mutations. Squares: male subjects; circles: female subjects; black filled symbols: patients with mutation; crossed-out symbols: deceased subjects. Each generation is designated by a roman numeral (I-II). No genomic DNA was available for testing for siblings labeled “E?”. (B) Nucleotide positions of mutations identified in index patients and representation of amino acid change caused by the mutations. (C) Crystal structure of the ARP2/3 complex from Bos taurus (access protein data bank: 1K8K), location of variants in the ARPC1B structure and modeling of c.64+1G>C splice donor and p.Val208Phe missense variants in P1 (blue) and P2 (red).
Figure 2.
Figure 2.
Phenotypical characterization of ARPC1B-deficient patients. (A) Histograms showing ARPC1B expression in T, B, NK cells, and monocytes in patients included in the study (blue lines) and their healthy controls (HC; blue tinted lines) determined by flow cytometry. Red filled lines: negative controls of patients. Red dashed lines: negative controls of HC. Percentage of ARPC1B+ in patients’ cells is indicated. (B) Confocal microscopy of ARPC1B, F-actin, merged with nuclei (DAPI) in a representative field of HC, P1, P2, and P7 (ARPC1B-null patient) peripheral blood lymphocytes. Bar represents 10 μm. Arrows indicate positive staining for ARPC1B and F-actin.
Figure 3.
Figure 3.
Defective assembly of the IS in ARPC1B-deficient T lymphocytes. (A) Confocal images of T cells from a HC and P1, P2, and P7 adhering to ICAM1/anti-CD3 Ab-coated slides and stained for F-actin, ARPC1B, α-tubulin, and DAPI. Images representative from 1 out of 3 experiments. (B) Quantification of the area of individual cells interacting with ICAM1/anti-CD3 Ab. Median bar with minimum-maximum. Red lines: median average for HD and patients. %: Mean percentage of the medians between patients and HDs. Results of 2 independent experiments. (C) Distribution of T-cell morphologies according to the indicated subtypes: cell without protrusion, emission of filopodia, or assembly of a circular lamellipodia. (D) Representative confocal images of control T cells or T cells from P1, P2, and P7 upon interaction with P815 that have been precoated or not with anti-CD3 Ab. Fixed conjugates were stained for F-actin, ARPC1B, and DAPI. Representative images from 1 out of 2 experiments. (E) Quantification of the proportion of T cells engaged in conjugates with P815 targets precoated or not with anti-CD3 Ab. Conjugate formation was assessed at the indicated time points upon cell mixture. Results of 2 independent experiments.
Figure 4.
Figure 4.
Impaired migration and proliferation of peripheral blood lymphocytes. (A) Percentage of migrated freshly isolated lymphocytes after 3 hours of stimulation with increasing concentrations of SDF1-α in P1 and P2 as compared with HC (n = 6). Mean ± SEM. (B) Spontaneous migration in P1 (red bar), P2 (blue bar), and HC (n = 6; green bar). Mean ± SEM. (C-D) Percentage of proliferation determined by cell trace dilution in CD4+ and CD8+ T cells for HC (blue, n = 3) and patients P1, P2, and P6 with anti-CD3 alone or in combination with anti-CD28. Median (bar) and patients’ symbols are indicated. Stimulation index: ratio between stimulated and unstimulated cells. (E) Restoration of proliferation in transduced PHA T-cell blasts of P2 and a HC. T cells were stimulated with increasing doses of plate-bound anti-CD3. Graph summarizes the proliferation of T cells sorted according to mCherry or GFP expression. Vectors used for transduction are indicated. Mean ± SEM. cpm, counts per minute.
Figure 5.
Figure 5.
Characterization of revertant CD8+T cells. (A) Histograms showing the presence of a revertant ARPC1B+ population in CD4+ and CD8+ compartments in freshly isolated PBMCs of P1 (red line) as compared with HC (dashed line). Blue line: negative control. Box represents the percentage of ARPC1B+ cells in naïve, central memory (CM), TSCM (CD3+CD8+CD45RA+CD62L+CD95+), EM (CD3+CD8+CD45RACD62L), and TEMRA (CD3+CD8+CD45RA+CD62L) gated on CD8+ T cells. P1, black line; HC, dashed line; negative control, blue line. (B) Determination of Vβ in gated CD3+CD8+ARPC1B+ T cells in P1 (red bars) and P6 (blue bars) as compared with HC (gray bars, n = 3). Mean ± SD. Arrows indicate relative expansion of Vβ.
Figure 6.
Figure 6.
Preferential migration of revertant CD8+T cells. (A) Electropherograms showing homozygous peaks in CD4+CD8ARPC1B and CD4CD8+ARPC1B and heterozygous peak in CD4CD8+ARPC1B+ in sorted subpopulations in PHA T-cell lines of P1 as compared with bulk population in a HC. The site of second mutation is indicated in red. (B) Ratio of migrated ARPC1B+CD8+ (red) and ARPC1BCD8+ (blue) T cells at to SDF1-α as compared with HC (n = 6, shaded area). Mean ± SEM. Input: percentage of T cells expressing ARPC1B before migration.

Comment in

Similar articles

Cited by

References

    1. Goley ED, Welch MD. The ARP2/3 complex: an actin nucleator comes of age. Nat Rev Mol Cell Biol. 2006;7(10):713-726. - PubMed
    1. Dobbs K, Domínguez Conde C, Zhang S-Y, et al. . Inherited DOCK2 deficiency in patients with early-onset invasive infections. N Engl J Med. 2015;372(25):2409-2422. - PMC - PubMed
    1. Haddad E, Zugaza JL, Louache F, et al. . The interaction between Cdc42 and WASP is required for SDF-1-induced T-lymphocyte chemotaxis. Blood. 2001;97(1):33-38. - PubMed
    1. Westerberg LS, Meelu P, Baptista M, et al. . Activating WASP mutations associated with X-linked neutropenia result in enhanced actin polymerization, altered cytoskeletal responses, and genomic instability in lymphocytes. J Exp Med. 2010;207(6):1145-1152. - PMC - PubMed
    1. Krause M, Gautreau A. Steering cell migration: lamellipodium dynamics and the regulation of directional persistence. Nat Rev Mol Cell Biol. 2014;15(9):577-590. - PubMed

Publication types

Substances