Clinical Trial
. 2018 Nov 22;132(21):2249-2259.
doi: 10.1182/blood-2018-06-860593. Epub 2018 Sep 25.

A pilot study of lower doses of ibrutinib in patients with chronic lymphocytic leukemia

Affiliations
Clinical Trial

A pilot study of lower doses of ibrutinib in patients with chronic lymphocytic leukemia

Lisa S Chen et al. Blood. .

Abstract

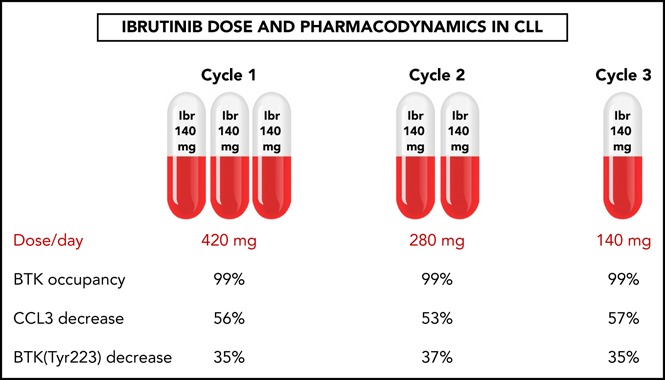
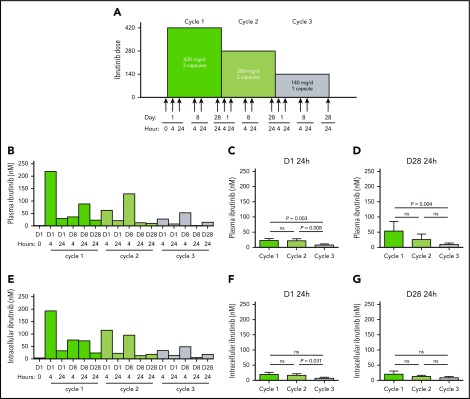
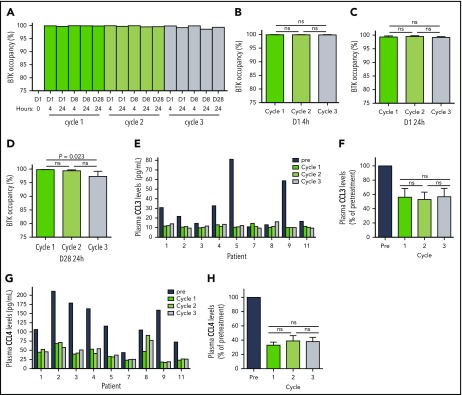
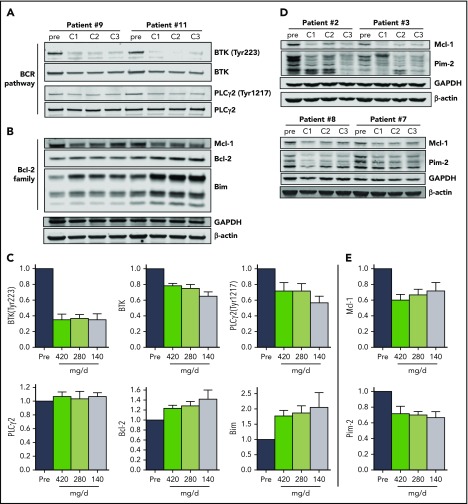
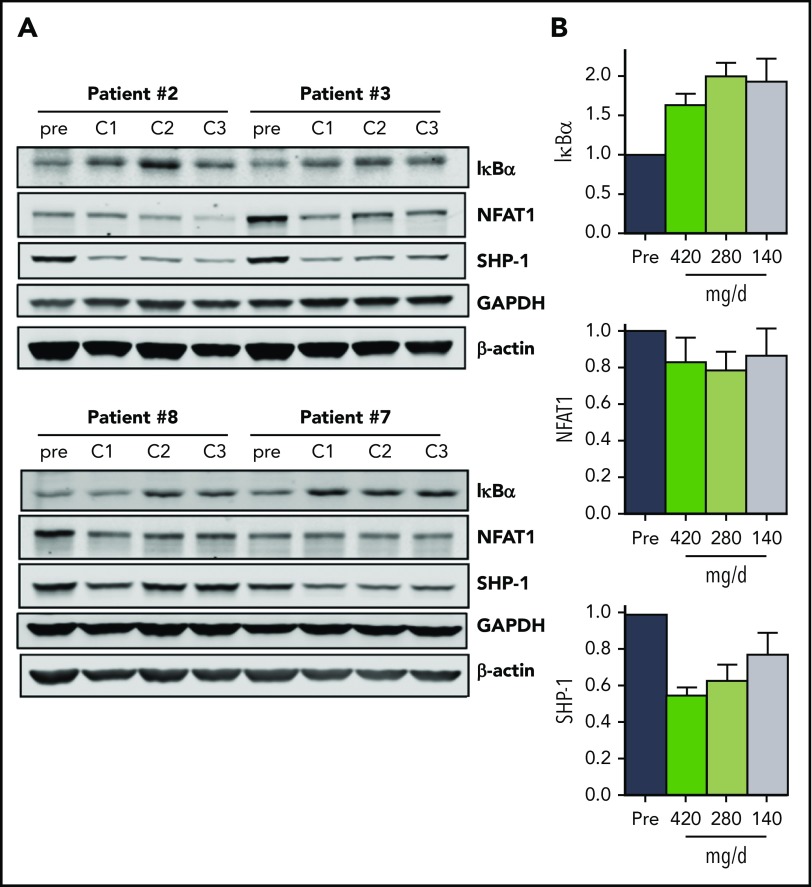
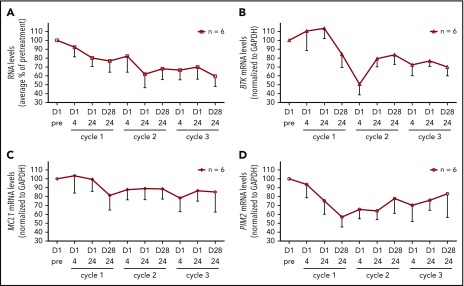
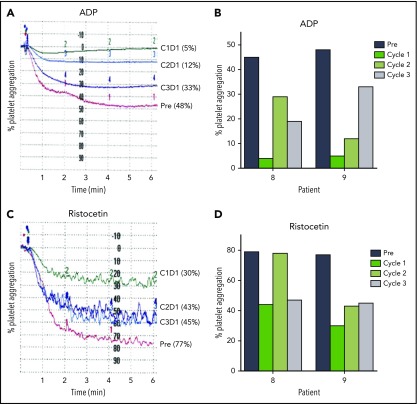
Ibrutinib is highly efficacious and used at 420 mg/d for treatment of chronic lymphocytic leukemia (CLL). We previously demonstrated a decline in Bruton's tyrosine kinase (BTK) protein levels in CLL cells after 1 cycle of ibrutinib, suggesting ibrutinib dose could be lowered after the first cycle without loss of biological effect. To test this postulate, a pilot study (NCT02801578) was designed to systematically reduce ibrutinib dosing within the same patient with CLL over the course of three 28-day cycles. After an initial cycle of 420 mg/d, the dose was reduced to 280 mg/d in cycle 2, and then to 140 mg/d in cycle 3. Eleven patients began study treatment, and 9 completed the 3 cycles. Plasma and intracellular pharmacokinetics (PK), BTK occupancy, and pharmacodynamic (PD) response at different doses of ibrutinib were compared. Plasma and intracellular levels of ibrutinib were dose-dependent, and even the lowest dose was sufficient to occupy, on average, more than 95% of BTK protein. In concert, BTK downstream signaling inhibition was maintained with 140 mg/d ibrutinib in cycle 3, and there were comparable reductions in total and phospho-BTK (Tyr223) protein levels across 3 cycles. Reductions of plasma chemokine CCL3 and CCL4 levels, considered to be biomarkers of ibrutinib response, were similar during the 3 cycles. These PK/PD data demonstrate that after 1 cycle of ibrutinib at the standard 420 mg/d dose, the dose can be reduced without losing biological activity. Clinical efficacy of lower doses needs to be systematically evaluated. Such dose reductions would lower drug cost, lessen untoward toxicity, and facilitate rationale-based combinations. This trial was registered at www.clinicaltrials.gov as #NCT02801578.


Conflict of interest statement

Conflict-of-interest disclosure: V.G., N.J., P.A.T., and W.G.W. have received research funding from Pharmacyclics for previous investigations. The remaining authors declare no competing financial interests.

Figures

None
Graphical abstract
Figure 1.
Figure 1.
Ibrutinib protocol design and PK and PD at 3 doses of ibrutinib. (A) Clinical protocol design for the systematic reduction of ibrutinib dosing in patients with CLL over the course of three 28-day cycles, from 420 to 280 mg/d and then to 140 mg/d. Peripheral blood samples were collected from each patient at the indicated times (arrows). (B-G) Plasma and cellular pharmacology of ibrutinib over the course of 3 cycles of treatment with ibrutinib at 420 mg/d (green), 280 mg/d (light green) and 140 mg/d (gray). (B) Ibrutinib plasma levels in a representative patient with CLL (patient 2) over the course of 3 cycles of treatment. (C-D) Mean plasma ibrutinib levels (n = 8) on (C) D1 24 hours and (D) D28 24 hours. (E) Intracellular ibrutinib levels in a representative patient with CLL (patient 2) over the course of 3 cycles of treatment. Mean intracellular ibrutinib level (n = 6) on (F) D1 24 hours, (G) D28 24 hours, as measured by high-performance liquid chromatography-MS. Error bars represent standard errors of the mean (SEMs). Paired comparisons were performed using 2-sided Wilcoxon signed rank test. ns, not significant.
Figure 2.
Figure 2.
Pharmacodynamic evaluation of reduced doses of ibrutinib. (A) BTK occupancy in a representative patient with CLL (patient 2) over the course of 3 cycles of treatment with ibrutinib at doses of 420 mg/d (dark blue), 280 mg/d (medium blue), and 140 mg/d (light blue). Mean percentages of BTK occupancy in patients (n = 8) on (B) D1 4 hours, (C) D1 24 hours, (D) D28 24 hours. Error bars represent SEMs. (E) CCL3 levels in patients with CLL over the course of 3 cycles of ibrutinib treatment. (F) Mean decrease in CCL3 levels in patients (n = 9). (G) CCL4 levels over the course of 3 cycles of ibrutinib treatment. (H) Mean decrease in CCL4 levels in patients (n = 9). Error bars represent SEMs. Paired comparisons were performed using 2-sided Wilcoxon signed rank test. ns, not significant.
Figure 3.
Figure 3.
The effect of ibrutinib on BCR pathway and Bcl-2 family proteins during 3 doses of ibrutinib. Immunoblot analyses of (A) BCR pathway proteins and (B) Bcl-2 family proteins in CLL cells from patients 9 and 11 on D28 of each cycle. (C) Mean levels (n = 6) of the proteins shown in (A) and (B) normalized to both β-actin and glyceraldehyde-3-phosphate dehydrogenase (GAPDH) averaged and then expressed relative to pretreatment levels. The data are the means of the 2 values; error bars represent SEMs. (D) Immunoblot analyses of early-response gene proteins. Note: the images of these immunoblots are from the same gels shown in supplemental Figure 4A; thus, the GAPDH and β-actin loading controls are the same. (E) Mean levels (n = 4) of the proteins shown in (D) normalized to both β-actin and GAPDH averaged and then expressed relative to pretreatment levels. The data are the means of the two values; error bars represent SEMs.
Figure 4.
Figure 4.
The effect of ibrutinib on NF-κB pathway during 3 doses of ibrutinib. Immunoblot analyses of (A) NF-κB pathway proteins in CLL cells from patients 2, 3, 7, and 8 on D28 of each cycle. (B) Mean levels (n = 4) of the proteins shown in (A). Protein levels were normalized to both β-actin and GAPDH, averaged and then expressed relative to pretreatment levels. Error bars represent SEMs.
Figure 5.
Figure 5.
Effect of ibrutinib treatment on total RNA and specific mRNA transcript levels during dose reductions over the course of 3 cycles. (A) Total RNA levels in CLL cells from patients (n = 6) during therapy and normalized by cell number. The RNA levels are expressed as percentages of pretreatment RNA levels in CLL cells before the start of therapy in the same patient ± SEMs. (B-D) Transcript levels of (B) BTK, (C) MCL-1, and (D) PIM2 were measured using real-time reverse transcription polymerase chain reaction and normalized using GAPDH as an internal standard. The results are expressed as percentages of the gene expression levels in CLL cells from patients (n = 6) before the start of therapy and represent the means of triplicate experiments for each patient ± SEMs.
Figure 6.
Figure 6.
Lower doses in cycles 2 and 3 reduce inhibition of platelet function by ibrutinib. Platelet aggregation in platelet-rich plasma isolated from patients before and during ibrutinib therapy was measured by light transmission aggregometry after stimulation with 20 μM ADP in (A) patient 9 and (B) patients 8 and 9; or 1.5 mg/mL ristocetin in (C) patient 9 and (D) patients 8 and 9 before the start of therapy and on D1 24 hours of each cycle.

Comment in

  • Is less equal with ibrutinib dose?
    Rogers KA. Rogers KA. Blood. 2018 Nov 22;132(21):2211-2212. doi: 10.1182/blood-2018-10-878579. Blood. 2018. PMID: 30467185 No abstract available.
  • Ibrutinib dose intensity in high-risk chronic lymphocytic leukemia.
    Forestieri G, Terzi di Bergamo L, Deodato M, Frustaci AM, Moia R, Deambrogi C, Rasi S, Autore F, Merli M, Mattarucchi R, Fahrni G, Scarfo' L, Gussetti D, Bulian P, Zanatta A, Spina V, Bruscaggin A, Pini K, Piffaretti D, Pirosa MC, Salehi M, Marques de Almeida J, Passweg J, Cavalli F, Zucca E, Gerber B, Stussi G, Gattei V, Ghia P, Gregor M, Passamonti F, Laurenti L, Gaidano G, Tedeschi A, Rossi D, Condoluci A. Forestieri G, et al. Hematol Oncol. 2022 Dec;40(5):1100-1104. doi: 10.1002/hon.3032. Epub 2022 Jun 1. Hematol Oncol. 2022. PMID: 35613703 No abstract available.

Similar articles

Cited by

References

    1. Advani RH, Buggy JJ, Sharman JP, et al. . Bruton tyrosine kinase inhibitor ibrutinib (PCI-32765) has significant activity in patients with relapsed/refractory B-cell malignancies. J Clin Oncol. 2013;31(1):88-94. - PMC - PubMed
    1. Imbruvica - Prescribing information. https://www.accessdata.fda.gov/drugsatfda_docs/label/2015/205552s002lbl.pdf. Accessed 1 June 2018.
    1. McMullen JR, Boey EJ, Ooi JY, Seymour JF, Keating MJ, Tam CS. Ibrutinib increases the risk of atrial fibrillation, potentially through inhibition of cardiac PI3K-Akt signaling. Blood. 2014;124(25):3829-3830. - PubMed
    1. Kamel S, Horton L, Ysebaert L, et al. . Ibrutinib inhibits collagen-mediated but not ADP-mediated platelet aggregation. Leukemia. 2015;29(4):783-787. - PubMed
    1. Levade M, David E, Garcia C, et al. . Ibrutinib treatment affects collagen and von Willebrand factor-dependent platelet functions. Blood. 2014;124(26):3991-3995. - PubMed

Publication types

MeSH terms

Associated data