

Genomic Characterization of Six Virus-Associated Cancers Identifies Changes in the Tumor Immune Microenvironment and Altered Genetic Programs
- PMID: 30254145
- PMCID: PMC6239894
- DOI: 10.1158/0008-5472.CAN-18-1342
Genomic Characterization of Six Virus-Associated Cancers Identifies Changes in the Tumor Immune Microenvironment and Altered Genetic Programs
Abstract
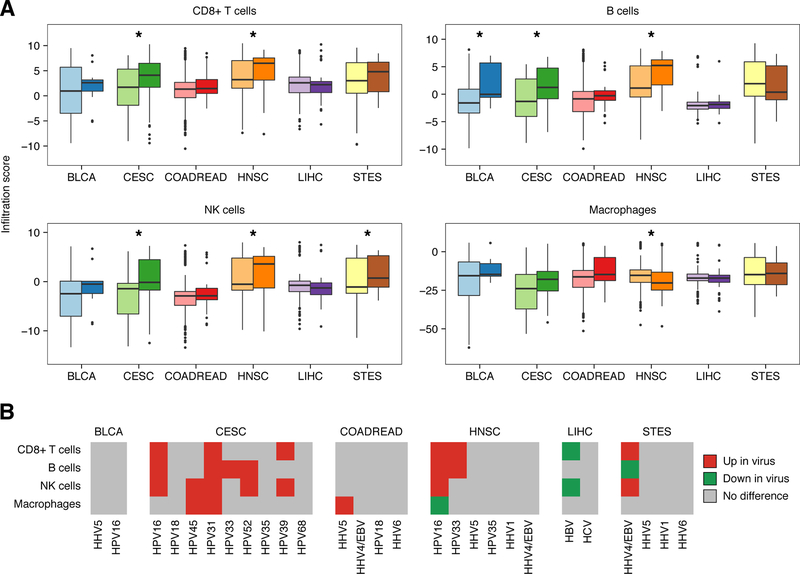
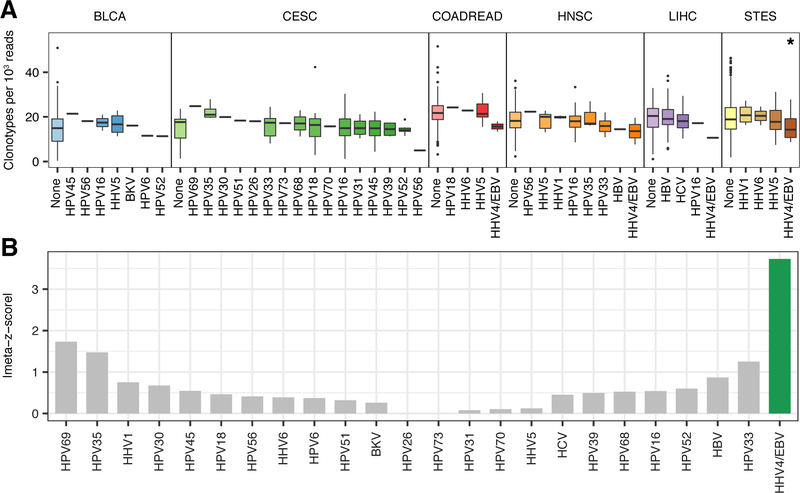
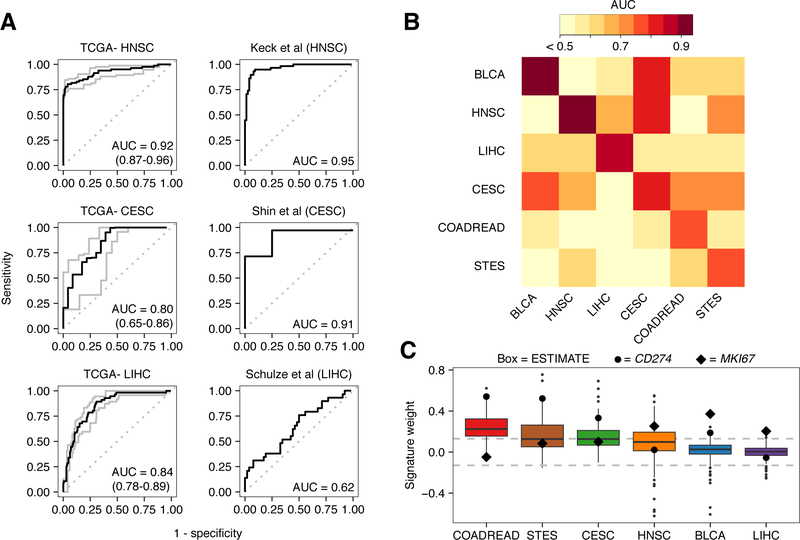
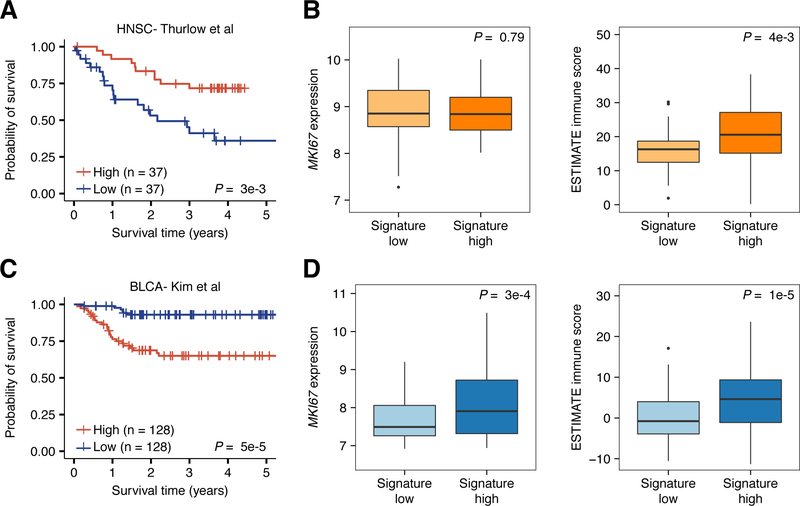
Viruses affect approximately 20% of all human cancers and induce expression of immunogenic viral oncoproteins that make these tumors potent targets for immune checkpoint inhibitors. In this study, we apply computational tools to The Cancer Genome Atlas (TCGA) and other genomic datasets to define how virus infection shapes the tumor immune microenvironment and genetic architecture of 6 virus-associated tumor types. Across cancers, the cellular composition of the microenvironment varied by viral status, with virus-positive tumors often exhibiting increased infiltration of cytolytic cell types compared with their virus-negative counterparts. Analyses of the infiltrating T-cell receptor repertoire in these patients revealed that Epstein-Barr virus infection was associated with decreased receptor diversity in multiple cancers, suggesting an antigen-driven clonal T-cell response. Tissue-specific gene-expression signatures capturing virus-associated transcriptomic changes successfully predicted virus status in independent datasets and were associated with both immune- and proliferation-related features that were predictive of patient prognosis. Together, the analyses presented suggest viruses have distinct effects in different tumors, with implications for immunotherapy.Significance: This study utilizes TCGA and other genomic datasets to further our understanding of how viruses affect the tumor immune response in different cancer types.Graphical Abstract: http://cancerres.aacrjournals.org/content/canres/78/22/6413/F1.large.jpg Cancer Res; 78(22); 6413-23. ©2018 AACR.
©2018 American Association for Cancer Research.
Conflict of interest statement
Disclosure of Potential Conflicts of Interests
The authors declare they have no competing interests.
Figures
Similar articles
-
Computational Characterization of Suppressive Immune Microenvironments in Glioblastoma.Cancer Res. 2018 Oct 1;78(19):5574-5585. doi: 10.1158/0008-5472.CAN-17-3714. Epub 2018 Jun 19. Cancer Res. 2018. PMID: 29921698
-
Comprehensive analyses of tumor immunity: implications for cancer immunotherapy.Genome Biol. 2016 Aug 22;17(1):174. doi: 10.1186/s13059-016-1028-7. Genome Biol. 2016. PMID: 27549193 Free PMC article.
-
Genomic Analysis of Immune Cell Infiltrates Across 11 Tumor Types.J Natl Cancer Inst. 2016 Jun 22;108(11):djw144. doi: 10.1093/jnci/djw144. Print 2016 Nov. J Natl Cancer Inst. 2016. PMID: 27335052 Free PMC article.
-
Classifying Cancers Based on T-cell Infiltration and PD-L1.Cancer Res. 2015 Jun 1;75(11):2139-45. doi: 10.1158/0008-5472.CAN-15-0255. Cancer Res. 2015. PMID: 25977340 Free PMC article. Review.
-
The Diagnostic, Prognostic, and Therapeutic Potential of Adaptive Immune Receptor Repertoire Profiling in Cancer.Cancer Res. 2020 Feb 15;80(4):643-654. doi: 10.1158/0008-5472.CAN-19-1457. Epub 2019 Dec 30. Cancer Res. 2020. PMID: 31888887 Review.
Cited by
-
EBV-associated diseases: Current therapeutics and emerging technologies.Front Immunol. 2022 Oct 27;13:1059133. doi: 10.3389/fimmu.2022.1059133. eCollection 2022. Front Immunol. 2022. PMID: 36389670 Free PMC article. Review.
-
LAG-3 as a Potent Target for Novel Anticancer Therapies of a Wide Range of Tumors.Int J Mol Sci. 2022 Sep 1;23(17):9958. doi: 10.3390/ijms23179958. Int J Mol Sci. 2022. PMID: 36077354 Free PMC article. Review.
-
Soluble PD-1: Predictive, Prognostic, and Therapeutic Value for Cancer Immunotherapy.Front Immunol. 2020 Nov 19;11:587460. doi: 10.3389/fimmu.2020.587460. eCollection 2020. Front Immunol. 2020. PMID: 33329567 Free PMC article. Review.
-
Virus expression detection reveals RNA-sequencing contamination in TCGA.BMC Genomics. 2020 Jan 28;21(1):79. doi: 10.1186/s12864-020-6483-6. BMC Genomics. 2020. PMID: 31992194 Free PMC article.
-
High-Throughput Sequence Analysis of Peripheral T-Cell Lymphomas Indicates Subtype-Specific Viral Gene Expression Patterns and Immune Cell Microenvironments.mSphere. 2019 Jul 10;4(4):e00248-19. doi: 10.1128/mSphere.00248-19. mSphere. 2019. PMID: 31292228 Free PMC article.
References
-
- Robert C, Long GV, Brady B, Dutriaux C, Maio M, Mortier L, et al. Nivolumab in previously untreated melanoma without BRAF mutation. N Engl J Med 2015;372:320–30 - PubMed
-
- Garon EB, Rizvi NA, Hui R, Leighl N, Balmanoukian AS, Eder JP, et al. Pembrolizumab for the treatment of non-small-cell lung cancer. N Engl J Med 2015;372:2018–28 - PubMed
Publication types
MeSH terms
Substances
Grants and funding
LinkOut - more resources
Full Text Sources
Other Literature Sources
